Important zone for bitcoinBitcoin has 7 weeks with (3 Closing price and 4 opening price between 35600$ and 35828$
this zone is very important for bitcoin
Pivot

How to use Pivot points Indicators to our advantage!Hi every one
A pivot point is a technical analysis indicator, or calculations, used to determine the overall trend of the market over different time frames. The pivot point itself is simply the average of the intraday high and low, and the closing price from the previous trading day. On the subsequent day, trading above the pivot point is thought to indicate ongoing bullish sentiment, while trading below the pivot point indicates bearish sentiment.
The pivot point is the basis for the indicator, but it also includes other support and resistance levels that are projected based on the pivot point calculation. All these levels help traders see where the price could experience support or resistance. Similarly, if the price moves through these levels it lets the trader know the price is trending in that direction
A pivot point is an intraday technical indicator to identify trends and reversals commonly used in equities, commodities, and forex markets.
Pivot points are calculated to determine levels in which the sentiment of the market could change from bullish to bearish, and vice-versa.
Day traders calculate pivot points to determine levels of entry, stops, and profit-taking by trying to determine where the majority of other traders may be doing the same
The pivot point indicator can be added to a chart, and the levels will automatically be calculated and shown. Here's how to calculate them yourself, keeping in mind that pivot points are predominantly used by day traders and are based on the high, low, and close from the prior trading day. If it is Wednesday morning, use the high, low, and close from Tuesday to create the pivot point levels for the Wednesday trading day.
After the market closes, or before it opens the next day, find the day's high and low, and the close from the most recent previous trading day.
Sum the high, low, and close and then divide by three.
Mark this price on the chart as P.
Once P is known, calculate S1, S2, R1, and R2. The high and low in these calculations are from the prior trading day.
What Do Pivot Points Tell You?
Pivot points are an intra-day indicator for trading futures, commodities, and stocks. Unlike moving averages or oscillators, they are static and remain at the same prices throughout the day. This means traders can use the levels to help plan out their trading in advance. For example, they know that, if the price falls below the pivot point, they will likely be shorting early in the session. If the price is above the pivot point, they will be buying. S1, S2, R1, and R2 can be used as target prices for such trades, as well as stop-loss levels.
We hope that you've learn something with this post .
Have a nice day and Good luck.

AMD Pivot BreakoutAMD pivot breakout on above average volume. Volume was below the average and declining during the consolidation. It is under the moving average but price action is looking strong. Nvidia is leading the way at all time highs after breaking a long term base and I am looking for AMD to start following in the same direction.
Entry: $82.92
Stop-Loss: $78.95 (-4.78%)

Keep an eye on this pivot point! 👁 👍Lyft is doing a nice pullback right now, in the 30min chart. The 20 is pretty close, but since the BB are so spread open, I believe it’ll move sideways for some time.
The 60.26 is a pivot, and if Lyft breaks it, it’ll do something good.
The problem is the RSI in the 4h chart, showing a bearish divergence + false breakout from the top area at 59s. This is another indicator that Lyft is not ready yet, but it can be in the future. It is one of the stocks that are on my radar, but it is not doing anything impressive for now.
Let’s watch the pivot in the 30min chart closely!
If you liked this trading idea, remember to click on the “Follow” button to get more trading ideas like this, and if you agree with me, click on the “Agree” button 😉.
See you soon,
Melissa.


BTC, we still need a pivot point at topPi Cycle Top indicator worked and daily fibonacci retracement also working. Waiting for new pivot point at top.

18k Bitcoin TargetUsing the daily pivot and fibonacci levels, my current target for bitcoin is 18k. You can see the previous pivot line in blue which can be used to find targets based on past support/resistance levels. This 18k level also has confluence with the 1.618 fibonacci extension based off the first wave down from the top.

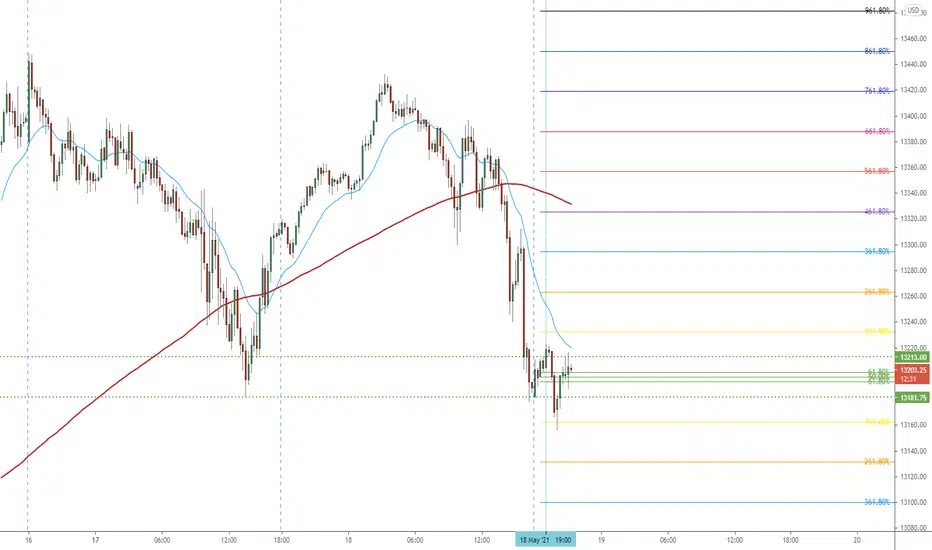
NQ Power Range Report with FIB Ext - 5/19/2021 SessionContract - CME_MINI:NQM2021
- PR High: 13213.25
- PR Low: 13181.50
Evening Stats
- Gap: = N/A
- Session Open ATR: 250.52
- Volume: 19k
- Open Int: 225k
- Trend Grade: Retracement
- From ATH: -6% (Rounded)
Key Levels (Rounded - Think of these as a range)
- Long: 14104
- Mid: 12530
- Short: 12598
Keep in mind this is not speculation or a prediction. Only a report of the Power Range with Fib extensions for target hunting. Do your DD! You determine your risk tolerance. You are fully capable of making your own decisions.

#BLZUSDT watch list to break downtrend lineprice ready to going up to first target from here.
please wait until the price break down trend line from above.
then take long position.

#CHZUSDT long positionfirst target: 50% profit from here. 0.75 $
goal target: 140% profit ----- 1.2$

BLZ/USDT TRENDLINEHi guys
i see blz/usdt binance chart on 4h timeframe in an intersting place
but it can correction more also it can go to intersting prices
and it has low marketcap so the risk of this position is more than others
also it could get effects from btc easily
support and ressistance lines are visible in the chart
i will be happy to read your opinion and if you enjoyed mine like it please
wish you the best
bb


AUDCAD: short for ~100 pipsFresh supply zone + edge of bank levels zone + stop hunt above pivot point = short opportunity


LTNC Significant LevelsSupport and resistance LTNC. A push above .085 can create a squeeze and the low volume distribution at .047 is a pivot.

xrp weekly retrace short swingentry on daily H3 Camarilla pivot. target developing weekly central pivot level. stop at daily H4 or above developing H3 for weekly levels
if only bullish can wait for retrace and enter on the pivot retracment

ES Hits target after target for longsIt will come down to the next mean reversion for a look to enter now, but wow if you were long this last week or so, you are happy! It was pretty easy to stay in this trend this time around, and good places to take targets too.

Monthly setup - CVS1/Apr/2021 12:30 PM AUTHOR: Brandon Gum
--
Monster setup here.
RSI at pivot level.
Price above 67 pivot is constructive.
======================

USDJPY - Pivot - Keltner - Sto - ADX 1 April 20211. Identify the trend
* On the chart:
a. Part of Dow theory: multi-trades active at the impulse waves.
Uptrend trend:
- HH / Higher High: The following peak is higher than the previous one .
- HL / Higher Low: The back bottom is higher than the previous one .
Downtrend:
- LL / Lower Low: The back bottom is lower than the previous one .
- LH / Lower High: The posterior peak is lower than the previous one
b. Keltner price channel:
- Uptrend: Go above Upper 2
- Downtrend: Down to Lower 2
* Under Chart:
Stochastic indicator: 21 past candles
- Uptrend: Index K and D surpass 80
- Buy zone: Index D is large 80.
----------------------------
- Downward trend: K and D indexes go down to 20.
- Sell zone: Index D is less than 20.
RSI indicator: 21 past candles
- Uptrend: value exceeds 80 | - Downward trend: value exceeds 20.
ADX indicator: Used to identify a strong trend
- ADX smooth: 9. - DI: 9
2. Entry point:
- Buy: wait to buy on the Basis Keltner channel.
- Sell (sell): wait for sell at the Basis Keltner channel.
3. Take profit, stoploss
ATR indicator (20) ( Average true range ) * 2

CADCHF | Dow - Keltner - RSI - Stochastic - ADX 1 April 20211. Identify the trend
* On the chart:
a. Part of Dow theory: multi-trades active at the impulse waves.
Uptrend trend:
- HH / Higher High: The following peak is higher than the previous one.
- HL / Higher Low: The back bottom is higher than the previous one.
Downtrend:
- LL / Lower Low: The back bottom is lower than the previous one.
- LH / Lower High: The posterior peak is lower than the previous one
b. Keltner price channel:
- Uptrend: Go above Upper 2
- Downtrend: Down to Lower 2
* Under Chart:
Stochastic indicator: 21 past candles
- Uptrend: Index K and D surpass 80
- Buy zone: Index D is large 80.
----------------------------
- Downward trend: K and D indexes go down to 20.
- Sell zone: Index D is less than 20.
RSI indicator: 21 past candles
- Uptrend: value exceeds 80.
- Downward trend: value exceeds 20.
ADX indicator: Used to identify a strong trend
- ADX smooth: 9
- DI: 9
2. Entry point:
- Buy: wait to buy on the Upper Keltner channel.
- Sell: wait for sell at the Lower Keltner channel.
3. Take profit, stoploss
ATR indicator (20) ( Average true range ) * 2

BTC bitcoin short. mothly close pivot reversionTarget is the incoming pivot and L3 you see on chart. Keep in mind this last day of price action could adjust those incoming levels to come in both lower or higher the the monthly close. However that will only mean the retrace comes from a highe point. Easy to avoid risk by average cost entry up small to large. Or if bullish you ought to wait until the monthly pivot magnet hits to enter a long. Places where you could manage risk are the monthly H4 on chart. or also the daily/weekly H4 areas. at around 60300.
it is worth noting that btc has retrace to its newly developed pivot when price opens away from the current price or just prior to its close the last 37 out of 39 monthls. Cant really argue with those backtest stats. You could look into that yourself if curious

BTC/USD Nearly All Key Historic Support/Resistance LevelsI have made the chart available to use/edit (Link in the comments, if it gets approved)
You can use the object tree tab (bottom right) to hide or show certain resistance groups to make it less cluttered.
Don't take the prediction too seriously, was just a conservative estimate for fun.
Key:
Multicoloured horizontal - Fibonacci extention from previous bear market bottom to bull market top
Orange horizontal - Previous Highs
Red diagonals - Previous 2 bull run peaks (probably new floor, I would be bearish if broke below)
White diagonals - Pivot point (Key highs and lows charted across a key pivot point)
Purple diagonals - Uptrend bottoms (Deeper correction more likely if breaks below)
Cyan/Blue EMA - 15/55 EMAs (If the 15 falls below the 55 on D/W candles possible indication of correction and/or bearmarket)
Yellow/Orange MA - Golden Cross (50/200 MA on D/W candles, yellow falling below orange is bad news, moving above good news)
Red MA - (21 MA on W candles, historically BTC has used this as support during bullruns, ie good buy points, fall below is bad news)
BITFINEX:BTCUSD
