GBPUSD Ascending Channel Trend Angle AnalysisWelcome to my second analysis using the trend angle tool within an ascending channel. This strategy intrigues me as I trade largely dependent on patterns and price action.
Presented is a 1 hr chart with an inner bottom support that serves as an early pivot with the main bottom support beneath. Furthermore our top channel resistance correlates with the ascending pattern. Notably trend angle ascend off channel support is trending at a 52 degree angle.
Naturally I calculated a 532 angle ascend from the recent pivot in play. Our first take profit is at our previous high with second take profit breaching through Top/Bottom straight channel resistance to retest our ascending channel resistance.
Our MACD and RSI are confirming our current ascend. MACD/SIGNAL crossed along support to trek towards 0 line. Our RSI is trading at an indicator angle of 52 degrees matching our chart angle trend.
Please comment with thoughts and ideas. Thank you.
Pivot

Trend angle ascending channel analysisNote: This is a fun/practice analysis using the trend angle tool within ascending/descending channel patterns. Do not take this trade literal.
Presented is a 1 hour chart. We can scope out an ascending channel patter as presented. Using the trend angle I calculated a 50 degree angle ascend to retest top channel off the bottom channel retest in play.
My take profit marks correlate to pivots within the channel. With a MACD/SIGNAL cross and up through the zero line we may see a push to retest the top. If this occurs our RSI will match a 50 degree trend angle according to chart trend.
Please comment with thought s and ideas. Thank you.

daily pivot retrace. short term down51.3k p/l3 can scalp to it or wait and try to buy dip there
Stop loss H4 or just over H3 if scalping to it
Camarilla pivots / CPR

Another gold shortSo I enter gold again after stop out thi morning for nice money. Now I enter again because
Fast Hull cross down over slow hull.
gold pull back to resistant line make good entry point
rsi still making lower low with price
price below center regresssioin line
descended triangle which usually meaning reversal, but see price still at top of wedge so still good profiting potential even if reversal at bottom line of wedge. Here I take half profit then watching how price reacts.
also pivot is weak that I show because this weak pivot reacting to prior pivot. So this weakens it.

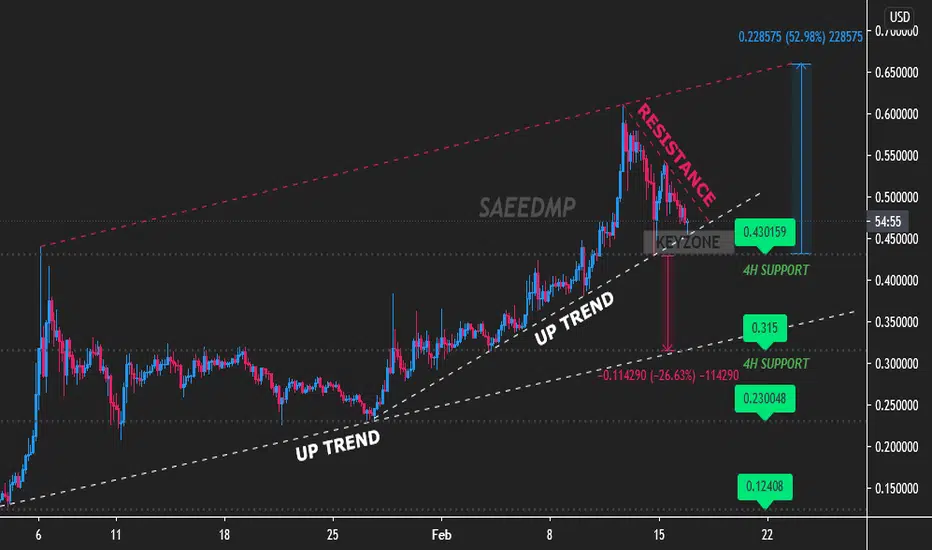
XLMUSD (Stellar) 17 February 2021 4Hours TimeframeHi traders and welcome to my channel ...
As you can see XLMUSD still in the uptrend channel … for now, I think it’s going to touch 4h support at 0.430159 and then we have continuation of long move to 0.65
but if breaks the static support at 0.430159 it going to retest and drop more to next level of support area at 0.315.
Good luck guys and be careful
All info can be found in my chart.
*Support this idea with a Like or Comments if you find it useful* ... Thank you
________________________________⠀
DISCLAIMER: This Information Is Not a Recommendation to Buy or Sell. It Is to Be Used for Educational Purposes Only
Top channel rejection for a sell offPresented on the 1 hr chart we see a potential pivot in play with top resistance rejection.
Indicators are set to confirm with a full MACD/SIGNAL cross just above the 0 line. This will confirm a sell off in play.
Watch for a pivot at 1.07400. With a MACD/SIGNAL cross through the 0 line the trend may truck right through our pivot zone.
Take profit at current channel bottom support at 1.07200. Stop loss above current resistance with a full close out above.
Please comment with thoughts and ideas. Thank you.

Continued supportWe see continued support in play at 0.71800. Seemingly we are in play with a support and pivot presented on the 1 hour chart.
Our MACD/SIGNAL found key indicator support to set up for a cross to push momentum upwards. Naturally RSI will kick out of the oversold zone.
Follow previous patter and take profit .72500 ad wait for a retest. Stop loss below current support.
Please comment with thoughts and ideas. Thank you.

Continuation analysisWith JPY's weakness we see pairs breaching key levels.
Presented is the 1 hr chart. I sentiment continuation to retest the next tow key resistance levels. 148.000 is a strong rejection point so if there is a breach we can sentiment our next retest at 149.000.
Take profit at 148.00 and 149.00 for continuation. Stop loss below established support.
Observe chart and please comment with thoughts and ideas. Thank you.

Established support for a buyWe have found established support with a strong pivot/ Still room for an entry to retest the next resistance with this increased in volume.
Our MACD/SIGNAL cross has established clear increase in volume with RSI slowly moving towards the overbought zone. A MACD/SIGNAL cross through 0 line will help increase momentum through resistance levels.
Take profit at resistance levels and look for pivots. Stop loss below established support.
Please comment with thoughts and ideas. Thank you.

Key resistance retest forecastPresented is the 4 hr chart. I mapped out the first key resistance with the previous resistance breach (which now is an established support).
MACD/SIGNAL made a cross while above 0 line. RSI is breaching overbought zone. Current RSI pattern tells us a pivot is near however we have not seen these levels for a bit so a change in pattern (breaching further into overbought zone) may be in play. I will pay close attention to RSI play out to determine my pivot point.
Stopmloss below new support and take profits as presented on chart while watching for a pivot.
Please comment with thoughts and ideas. Thank you.

Directional analysisPresented is a brief directional analysis using the 1 hr chart.
The trend continued its sell off to start the week following last weeks close. For continuation sentiment I analyze the day chart. Here I see a retest of the next support (very near). This is a great opportunity for buyers to be patient for a potential pivot. Strong sentiment would lean towards sell continuation if we see a clear breach through support on the day chart with no rejection.
If the above scenario plays out expect sellers to load increase sell off to the next Key support at .82900 (presented on chart).
I will be watching the MACD/SIGNAL closely for a diversion (which would tell us too lean towards a support breach) or a full signal cross (which would tell us to lean towards a pivot reversal). RSI will continue to zig-zag swim ( I call dolphin swimming through the waves) along the bottom of the oversold zone until MACD/SIGNAL plays out its role.
I will publish a trade analysis based off a breach or pivot of the looming support.
Please comment with thoughts and ideas. Thank you.

Technical buy analysis off wick supportCurrently we are seeing some wick support at 1.53700 with pivots. I sentiment a pivot in play here pending technical indicators play out.
MACD seems to be completing its sell off as it is rounding out of bin territory and setting for a snipe cross through SIGNAL followed by an immediate cross through the 0 line. This surely would pivot RSI out the oversold zone to start the trek back towards overbought.
Take profit at top resistance however be mindful the take profit might be a wick touch only to retrace back to the trends pivot zone (which I mapped out on this 1 hr chart). Stop loss of course would be a breach below this support hold with continuation.
Please comment with thoughts and ideas. Thank you.

4hr Chart technical buy analysisPresented is a technical analysis on the 4hr chart.
As we can observe there is huge buyer volume following a MACD/Signal cross. Further more a 0 line cross will spike further momentum. I boxed a pivot zone area as you can correlate previous pivots at the expressed level. pay attention to the 1 hr chart to determine if a pivot in trend is in play or a pivot multiple bar retrace to continue bull trend. RSI is currently slanting further towards the overbought zone, a typical indication of buyers in control.
Take profit as mapped on chart and stop loss below a break of the current support hold.
Please comment with thoughts and ideas. Thank you.

Technical sell analysisPresented is a 1hr chart sell analysis.
We can see rejection around 118.000. We may see a slight pivot to make a complete retest of 118.000 before the drop.
I sentiment an incoming sell off if MACD/SIGNAL make a full cross through the 0 line. While this is happening we can see RSI forming a lower low breaking support in a slant pattern heading for the oversold zone.
I have 3 TP targets as mapped on the chart. These targets also serve as potential pivots. Do not jump the gun and close out unless there are pivots the\at breach key resistance.
Please comment with thoughts and ideas. Thank you.

ROOT Ascending Channel key pointCurrently at a pivot point in the uptrend.
Could expect to see a big move either way once supply zone is tested.

Sell off top channel resistanceThis is a 1 hr chart technical analysis. We are finding continued rejections around 127.100 following previous trend patterns off support/resistance pivots.
Currently RSI is forming lower lows while price is within higher high range. This correlating with a MACD/SIGNAL cross down through 0 line to retest our key supports of 126.700 and 126.500 (which are our TP targets). Stop loss is place above top resistance with a breach and continuation.
Please comment with thoughts and ideas. Thank you.


BTC daily open likelihood points seenWill test the pivot. and will visit and likely reject the first 3. no matter we visit H3 or L3. first one of those we go to will be a lie. especially if it leaves purple line untouched


$TLRYTilray, Inc. engages in the research, cultivation, processing, and distribution of medical cannabis. The company offers its products to patients, physicians, pharmacies, governments, and hospitals; and for researchers for commercial purposes, as well as compassionate access and clinical research applications. It operates in Argentina, Australia, Canada, Chile, Croatia, Cyprus, the Czech Republic, Germany, Israel, Ireland, New Zealand, South Africa, Switzerland, the United States, and the United Kingdom. The company was incorporated in 2018 and is headquartered in Nanaimo, Canada.

GBPUSD Buy - Ride the waveGBP USD is trending to the upside and has done a break and retest on the intraday timeframes. With the usd being a sell we anticipate this trade to have some continued upside.

Sell off top resistanceTechnical sell off top resistance.
MACD/SIGNAL are set to cross to establish momentum forcing RSI out of overbought zone.
Please comment with thoughts and ideas. Thank you.

Buy analysis Looking for a pivot off this support.
Please observe people chart. This is a 2 entry trade with stop loss below previous low. TP 1 is within a pivot zone. Let 2nd entry breach too TP 2 or close with trend pivot reversal.
Please comment with thoughts and ideas. Thank you.
