Can escape the range that lasts more than two years?It have temporarily updated the latest low of 0.74126 this week.
Recently, the resistance line works smoothly and it goes down one step, so if you go as it is, it will be the trend price since 2015.
Weekly chart
There are four lines that become the barrier. (There are many)
1) MPP (S2) 0.73356
2) YPP (S1) 0.72900
3) MPP (S3) 0.72586
4) Horizontal line near 0.71500 (0.71589 on my chart)
Penetrating through these in order and receiving resistance will be a downtrend.
However, even if it comes down trend, it will take a lot of time.
There is also the possibility of lowering slowly so that it is not a trend.
Because, as you can see from the past chart, AUDUSD is easily blocked by YPP.
Nevertheless, as you know, not to have a wishful observation, but to look at the movements at that time to attack areas where risk/reward is good.
Therefore, if keeping down this way, I think that it is enough to take into account only that it is wary of the long trade.
MPP (S1) 0.74517 is the key point for the latest opportunity seen on the 4h chart.
1) Confidence that MPP (S1) 0.74517 functions as resistance
Short, Target is above MPP (S2).
We will be careful of WePP that will be updated tomorrow.
If you are more confident of lowering above YPP (S1) 0.72900 = above Double Zero 0.73000 is also an option.
2) It is doubtful whether MPP (S1) 0.74517 functions as a resistance
If it goes above MPP (S1) 0.74517 and functions as support, I will long, otherwise observe it.
I would be grateful if you like it idea,give me follow or agrees!
------------------------- --------------------------
Brown thick line: Yearly Pivot Points (YPP in the text)
Light blue thick line: Monthly Pivot Points (MPP in the text)
Green thin line: Weekly Pivot Points (WePP in the text)
Indigo thickLine: Horizontal line or Trend line seen by weekly or monthly
Indigo thin line: Horizontal line or Trend line seen by 4hourly or daily
Indigo dotted line: outstanding double zero
Red curve: EMA 20 close
Indigo curve: EMA 200 close
Green curve: EMA 800 close
Black curve: EMA 1600 close
x mark: Line which may not function
------------------------- --------------------------
Pivot

Can escape the range that lasts more than two years?It have temporarily updated the latest low of 0.74126 this week.
Recently, the resistance line works smoothly and it goes down one step, so if you go as it is, it will be the trend price since 2015.
Weekly chart
There are four lines that become the barrier. (There are many)
1) MPP (S2) 0.73356
2) YPP (S1) 0.72900
3) MPP (S3) 0.72586
4) Horizontal line near 0.71500 (0.71589 on my chart)
Penetrating through these in order and receiving resistance will be a downtrend.
However, even if it comes down trend, it will take a lot of time.
There is also the possibility of lowering slowly so that it is not a trend.
Because, as you can see from the past chart, AUDUSD is easily blocked by YPP.
Nevertheless, as you know, not to have a wishful observation, but to look at the movements at that time to attack areas where risk/reward is good.
Therefore, if keeping down this way, I think that it is enough to take into account only that it is wary of the long trade.
MPP (S1) 0.74517 is the key point for the latest opportunity seen on the 4h chart.
1) Confidence that MPP (S1) 0.74517 functions as resistance
Short, Target is above MPP (S2).
We will be careful of WePP that will be updated tomorrow.
If you are more confident of lowering above YPP (S1) 0.72900 = above Double Zero 0.73000 is also an option.
2) It is doubtful whether MPP (S1) 0.74517 functions as a resistance
If it goes above MPP (S1) 0.74517 and functions as support, I will long, otherwise observe it.
I would be grateful if you like it idea,give me follow or agrees!
------------------------- --------------------------
Brown thick line: Yearly Pivot Points (YPP in the text)
Light blue thick line: Monthly Pivot Points (MPP in the text)
Green thin line: Weekly Pivot Points (WePP in the text)
Indigo thickLine: Horizontal line or Trend line seen by weekly or monthly
Indigo thin line: Horizontal line or Trend line seen by 4hourly or daily
Indigo dotted line: outstanding double zero
Red curve: EMA 20 close
Indigo curve: EMA 200 close
Green curve: EMA 800 close
Black curve: EMA 1600 close
x mark: Line which may not function
------------------------- --------------------------

Is 5000.0 reaching realistic?MPP (S1) 6353.9 from the small return which makes me think that it is a downtrend again It was this week's price movements.
Currently it is stopped with double zero 6000.0 and it is a small range.
Although the shape is irregular when looking at the daily chart, there are head and shoulders.
When penetrating down the its neck line, I feel realistically that it reaches near double zero 5000.0.
Daily
Looking it as a downtrend, the strategy is briefly as follows.
1) It was judged that double zero 6000.0 functioned as resistance
Short.
The target is double zero above 5000.0 or above MPP (S2) 5221.9 if it goes bullish, but I think that it should be decided by the way of risk reward such as taking WePP updated at the beginning of the week into consideration or making it above 5500 .
2) Doubtful whether double zero 6000.0 is functioning
MPP (S1) Return to near 6353.9, Short if it can be determined that it functions as a resistance.
If it clearly penetrate MPP (S1) 6353.9 and function as support, or if it skyrockets, We will see.
------------------------- --------------------------
Brown thick line: Yearly Pivot Points (YPP in the text)
Light blue thick line: Monthly Pivot Points (MPP in the text)
Green thin line: Weekly Pivot Points (WePP in the text)
Indigo thickLine: Horizontal line or Trend line seen by weekly or monthly
Indigo thin line: Horizontal line or Trend line seen by 4hourly or daily
Indigo dotted line: outstanding double zero
Red curve: EMA 20 close
Indigo curve: EMA 200 close
Green curve: EMA 800 close
Black curve: EMA 1600 close
x mark: Line which may not function
------------------------- --------------------------

Natural gas that became difficult to penetrate 3.000?It was stopped cleanly at MPP 3.028 last weekend and pushed back, it raised it again, but this time it was pushed back to double zero 3.000.
weekly chart
In terms of weekly chart, it is sometimes the center of the range, and in the long term it is a market where we can not imagine which direction it will go.
In this situation, I think that we will continue to conduct short-term trade by seeing the young,and highly reliable resistance and support reactions.
1) Double Zero Judge that 3.000 functions as resistance.
Short and set limits above MPP 2.853 or above 2.900.
2) It is doubtful that double zero 3.000 is functioning.
Return to MPP 3.02 again or possibly reach YPP 3.052, so continue observation.
------------------------- --------------------------
Brown thick line: Yearly Pivot Points (YPP in the text)
Light blue thick line: Monthly Pivot Points (MPP in the text)
Green thin line: Weekly Pivot Points (WePP in the text)
Indigo thickLine: Horizontal line or Trend line seen by weekly or monthly
Indigo thin line: Horizontal line or Trend line seen by 4hourly or daily
Indigo dotted line: outstanding double zero
Red curve: EMA 20 close
Indigo curve: EMA 200 close
Green curve: EMA 800 close
Black curve: EMA 1600 close
x mark: Line which may not function
------------------------- --------------------------

Does double zero does not work for ethereum?Although it is an Ethernet that looks like bitcoin for a long time,
What is clearly different from other virtual currencies is that it will not quite stop at double zero.
However YPP is functioning to a certain extent and there are signs that it repeled in the vicinity several times.
It got closer, but is there a resistance of YPP this time?
1) Function as resistance
A chance of short.
Double zero 500.00 is considered to penetrate and the target is near 450.00 near the immediate lows.
If it aims a little more, it is before 433.67 in the next MPP.
2) Penetration not functioning as resistance
If it keep YPP over a certain period of time and use YPP as a support line you will get a long choice.
------------------------- ---------------------- - -
Brown thick line: Yearly Pivot Points (YPP in the text)
Light blue thick line: Monthly Pivot Points (MPP in the text)
Green thin line: Weekly Pivot Points (WePP in the text)
Indigo Line: Horizontal line or Trend line seen by weekly or monthly
Indigo fine wire: Horizontal line or Trend line seen by 4hourly or daily
Dotted dotted line: outstanding double zero
Red curve: EMA 20 close
Indigo curve: EMA 200 close
Green curve: EMA 800 close
Black curve: EMA 1600 close
x mark: Line which may not function
------------------------- ---------------------- - -

Would gold decide to Downtrend?It is gold down since last Friday, but it is currently staying under YPP 1269.009.
If YPP functions as resistance as it is, if the trend line of the weekly feet below (currently around 1242.000) also goes down, I think that it is the aspect of the downtrend.
weekly chart
As the most recent trade.
1) Judge that YPP 1269.009 functions as a resistance.
Short and set limit above MPP 1258.160.
2) Pull out YPP 1269.009
MPP 1278.303 is above YPP1269.009, I think that the immediate long is difficult.
------------------------- --------------------------
Brown thick line: Yearly Pivot Points (YPP in the text)
Light blue thick line: Monthly Pivot Points (MPP in the text)
Green thin line: Weekly Pivot Points (WePP in the text)
Indigo thickLine: Horizontal line or Trend line seen by weekly or monthly
Indigo thin line: Horizontal line or Trend line seen by 4hourly or daily
Indigo dotted line: outstanding double zero
Red curve: EMA 20 close
Indigo curve: EMA 200 close
Green curve: EMA 800 close
Black curve: EMA 1600 close
x mark: Line which may not function
------------------------- --------------------------

AUDUSD Divergence to Untouched PivotPotential W pattern setting up a long entry to an untouched Weekly Pivot on AUDUSD to 7500's. Both the Mac-d and RSI giving added confirmation with divergences.

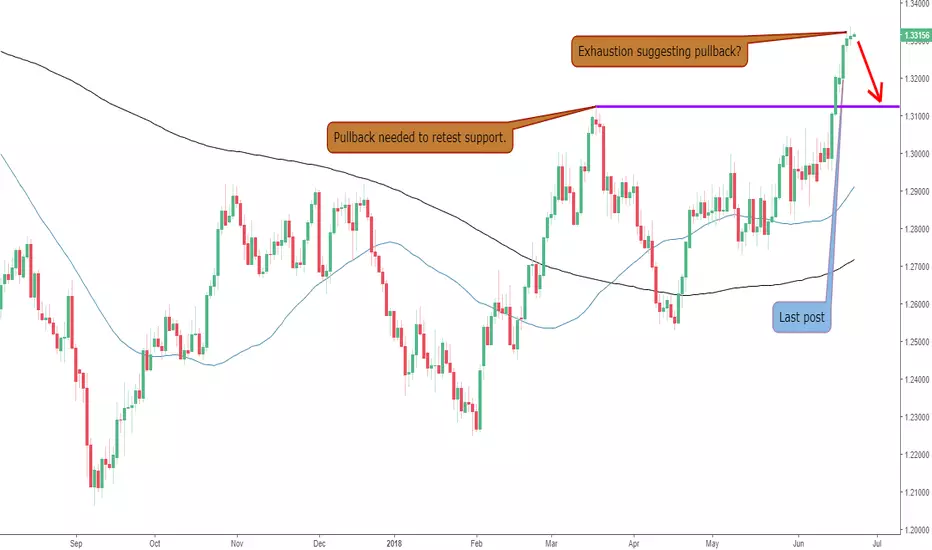
Indecision on The USDCADLast post: June 20th. See chart .
Review: Price had broken through and established a bull trend above the March high.
Update: Recent indecision in the market suggests the much needed pullback is a possibility.
Conclusion: Standing aside and letting price dictate a pullback or a trend continuation. A pullback is preferable.
Any comments or questions, do not hesitate to leave them below. Give us the thumbs up if you share our sentiments!
Sublime Trading
Horizontal line near 1.32000 works?It seems that it responded to a horizontal line near 1.32000(In my chart,1.32108). The movement is similar to eurusd, but will it respond cleanly?
1) The horizontal line functions as a resistance
I choose short aim to before.MPP 1.30760
2) The horizontal line does not function as a resistance
I want to consider the long if it goes above the horizontal line and functions as a support, but since it is a phase where the trend seems to be going down, let's observe carefully.
------------------------- --------------------------
Brown thick line: Yearly Pivot Points (YPP in the text)
Light blue thick line: Monthly Pivot Points (MPP in the text)
Green thin line: Weekly Pivot Points (WePP in the text)
Indigo thickLine: Horizontal line or Trend line seen by weekly or monthly
Indigo thin line: Horizontal line or Trend line seen by 4hourly or daily
Indigo dotted line: outstanding double zero
Red curve: EMA 20 close
Indigo curve: EMA 200 close
Green curve: EMA 800 close
Black curve: EMA 1600 close
x mark: Line which may not function
------------------------- --------------------------

1.16 Horizontal line reactivate?The horizontal line of around 1.16 (1.16077 in my chart) became a move as if it would work again.
1) Short when judging that it is resisted to the horizontal line
Since there are double zero 1.15000 and YPP 1.14786 under the current value,
Even if we trade here, it seems to be a short position with short S/L.
2) Before making a judgment, watch again as you cross the horizontal line
We will observe whether it functions as support or whether the horizontal line is ignored.
------------------------- --------------------------
Brown thick line: Yearly Pivot Points (YPP in the text)
Light blue thick line: Monthly Pivot Points (MPP in the text)
Green thin line: Weekly Pivot Points (WePP in the text)
Indigo thickLine: Horizontal line or Trend line seen by weekly or monthly
Indigo thin line: Horizontal line or Trend line seen by 4hourly or daily
Indigo dotted line: outstanding double zero
Red curve: EMA 20 close
Indigo curve: EMA 200 close
Green curve: EMA 800 close
Black curve: EMA 1600 close
x mark: Line which may not function
------------------------- --------------------------

strugle of MPP 110.769 AgainAlthough we can see a return to the horizon which attacked a few days ago overall, UJ is no exception.
Also, unlike the previous contact at 6/15, it is stopped cleanly.
On the other hand, when considering that the wall of the limit order is thin due to overshooting of double zero 110.000 over two times,
It seems to be becoming short-term advantage.
1) It was confirmed that MPP 110.769 functioned as resistance.
Aim for a short, try a double zero 110.000 penetration.
However, if it is determined that 110.000 penetration has failed, the position is handled.
2) price penetrated above MPP 110.769.
If MPP can be confirmed as a support line, consider a long targeting around 110.5 which is before the weekly trend line.
------------------------- --------------------------
Brown thick line: Yearly Pivot Points (YPP in the text)
Light blue thick line: Monthly Pivot Points (MPP in the text)
Green thin line: Weekly Pivot Points (WePP in the text)
Indigo thickLine: Horizontal line or Trend line seen by weekly or monthly
Indigo thin line: Horizontal line or Trend line seen by 4hourly or daily
Indigo dotted line: outstanding double zero
Red curve: EMA 20 close
Indigo curve: EMA 200 close
Green curve: EMA 800 close
Black curve: EMA 1600 close
x mark: Line which may not function
------------------------- --------------------------

S & P 500 cleanly responded to horizontal line 2738.6The S & P 500, which has continued to raise for a long time, stopped raising before 2800.0 and then backed down.
Currently it is stopped by the horizontal line near the high price of last month.
Horizontal line 2738.6 is
1) Functioned as a support line.
Long until MPP 2768.0 long.(long if it can attack safely WPP 2762.1 long)
2) It does not function as a support line.
Wait for functioning as a resistance or wait for other resistance and follow with a short.
------------------------- --------------------------
Brown thick line: Yearly Pivot Points (YPP in the text)
Light blue thick line: Monthly Pivot Points (MPP in the text)
Green thin line: Weekly Pivot Points (WePP in the text)
Indigo Line: Horizontal line or Trend line seen by weekly or monthly
Indigo fine wire: Horizontal line or Trend line seen by 4hourly or daily
Dotted dotted line: outstanding double zero
Red curve: EMA 20 close
Indigo curve: EMA 200 close
Green curve: EMA 800 close
Black curve: EMA 1600 close
x mark: Line which may not function
------------------------- --------------------------

Could MPP0.99139 support?usdchf was gradually lowered from double-zero 1.0000 to YPP 0.98340 in May,
It's trying to get back to the original level unnoticed.
If it is supported by MPP 0.99139, long materials up to double-zero 1.00000 can be tested.
------------------------- ---------------------- - -
Brown thick line: Yearly Pivot Points (YPP in the text)
Light blue thick line: Monthly Pivot Points (MPP in the text)
Green thin line: Weekly Pivot Points (WePP in the text)
Indigo Line: Horizontal line or Trend line seen by weekly or monthly
Indigo fine wire: Horizontal line or Trend line seen by 4hourly or daily
Dotted dotted line: outstanding double zero
Red curve: EMA 20 close
Indigo curve: EMA 200 close
Green curve: EMA 800 close
Black curve: EMA 1600 close
------------------------- ---------------------- - -

The TRYJPY Weakens Further Last post: June 13th. See chart .
Review: Price had bounced off resistance suggesting weakness back in the direction of the bear trend.
Update: Price has continued to weaken but is a distance away from breaking and closing below the pivot support of May.
Conclusion: Applying patience and waiting for price to clear support before placing further short trades.
Any comments or questions, do not hesitate to leave them below. Give us the thumbs up if you share our sentiments!
Sublime Trading

TRON will be in Bearish trendTRON will be in Bearish trend and a long time...
Who can stop this DOWN trend?
nobody!
Optimal price for TRXUSD around 0.03
Previous Forecast:
Dirtrex.com - external crypto asset manager.


Bulls Moving Price on The USDTRYLast post: May 25h. See chart .
Review: The bulls resumed control of the market following a volatile day in the market.
Update: This was short-lived as the bears came in strong and pulled back to a pivot support zone where price has bounced to the upside.
Conclusion: Applying patience until the high of May and the major round number 5.0000 is cleared. Will then consider more long trades.
Any comments or questions, do not hesitate to leave them below. Give us the thumbs up if you share our sentiments!
Sublime Trading

GBPAUD: Triangle breakout followed by a pivot.We are selling the pivot breakout. The target is at the 100% fibo expansion of the pivot and the stop loss at the top of the pivot.


USDHUF: Buy after pivot breakoutWe are buying a pivot breakout at the 60 minutes that is a continuation of a major uptrend at H4.
The stop loss is at the last bottom of the pivot an the target at a 100% fibo expansion.

Bounce of Year PivotsYear CAM (Camarilla) S3 and Year Pivot Bounce. Very nice. $GBPUSD $USDJPY $EURUSD $DXY

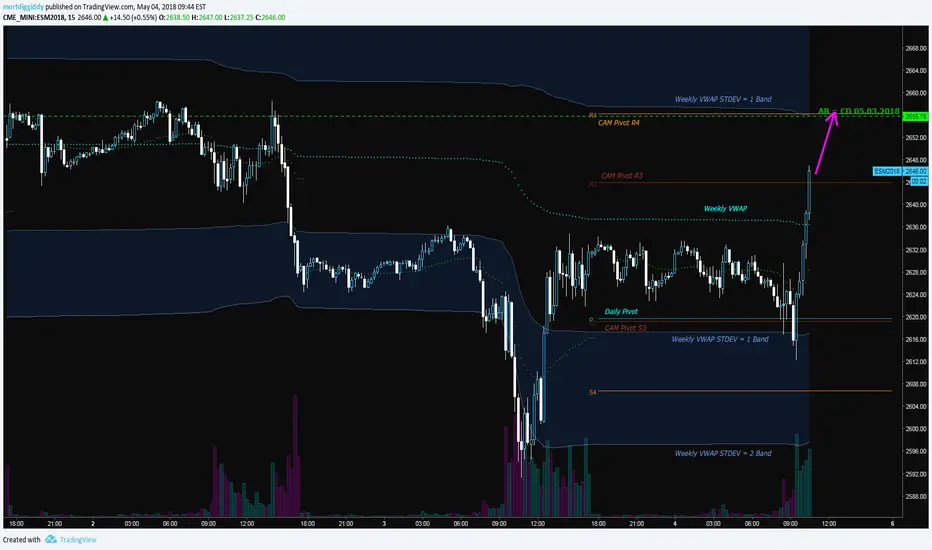
Target TodayBig bounce off VWAP band and pivot today. $SPY $QQQ $DIA $IWM $VXX $TLT Follow through from yesterday.