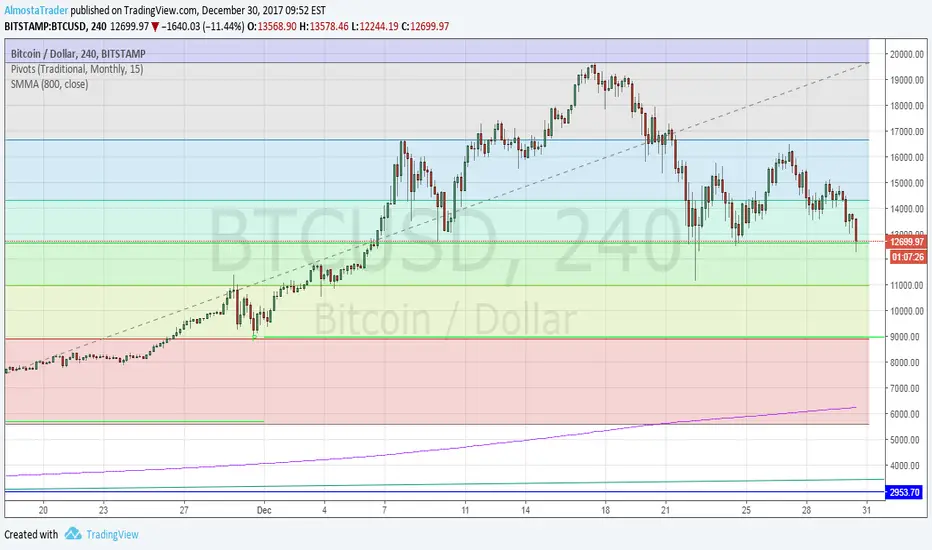
Price is being rejected by the downside of an up trend line...It seems to be a good moment for short with two possible targets... the first one at the quartely pivot and the second one at the Yearly Pivot... I hope your opinions guys...
Pivot

GBPUSD: Sell after trendline breakout and bearish pivotThe trade will be made after the reversal confirmation. The stop loss is at the top of the correction and the target aims at the bottom of the ascending channel.

SHORT Bitcoin reversal imminant? well wait until 15th April So after my last chart and roadmap for bitcoin 2018 spring to summer:
we gotta get a good close idea of what may happen in the days leading up to this....
some of you might just wanna take a break or do something else but i know there is bucket loads of puppers and cats all tuned in to this market right now, i mean we love seeing things fall as much as we do building them, its just natural
anyhow its only 5 days away, was meant to do this a week ago, many apologies for that but everyday has been confirming what i first starting thinking about the tax returns and the cashouts since the last layer of the bubble popped
we seem to be inside a triangle on the 60m chart and looks like if it breaks that support we will see a test of 600/5800
next on the list of bounce areas are $5800-600, 4200 and then if it does get panic sold extremes of $3600
$4k and $5k might come into play as psychological levels
all these levels are backed up by the trusted gann fans and fibs, lets see if it plays out and this is what im following......
if you DO have any questions about this or anything else please leave a comment or join our chat in telegram link below
REMEMBER all these can play out in next five days or maybe longer, also someone like George Soros can come along and buy tens of thousands of bitcoins at once etc etc list go on
everything is possible, its just whether its probable, bitcoin has taught us, never say never and i have been in BTC since it was a few $$
this looks like a good time to get in, if buying on bounces keep stop loss under the last low, or hodl for all hell!
bless up and bring on the cheap bitcoins!
JOIN US ON THE LINKS BELOW for 24/7 FREE crypto coin analysis and ZERO pump and dump spam :)

PivotBoss Wick Reversal SetupPATTERN SUMMARY
1. The body is used to determine the size oftlle reversal wick. A wick tllat is between 2.5 to 3.5 times larger than
the size of the body is ideal.
2. For a bullish reversal wick to exist, tlle close ofthe bar should fall witllin tlle top 35 percent of the overall range
of the candle.
3. For a bearish reversal wick to exist, the close of the bar should fall within the bottom 35 percent of the overall
range of the candle.
PATTERN PSYCHOLOGY
Figure 2-4 shows several types of bullish and bearish reversal wick candlesticks that can all signal
profitable reversal opportunities in the market, especially if these patterns are paired with key pivot levels. In
traditional candlestick jargon, these particular candlesticks would have names ranging from hammer, hanging
man, inverted hammer, shooting star, gravestone doji, or dragonfly doji, depending on where the candle is
placed in a trend. Now you can see why I simply call these candlesticks wicks, or even tails. Instead of fumbling
over the proper naming of these candlesticks, I believe it is more important to know what these patterns
represent. What are they telling you?
Types of Candlestick Reversal Wicks
When the market has been trending lower then suddenly forms a reversal wick candlestick, the likelihood of
a reversal increases since buyers have finally begun to overwhelm the sellers. Selling pressure rules the decline,
but responsive buyers entered the market due to perceived undervaluation. For the reversal wick to open near the
high of the candle, sell off sharply intra-bar, and then rally back toward the open of the candle is bullish, as it
signifies that the bears no longer have control since they were not able to extend the decline of the candle, or the
trend. Instead, the bulls were able to rally price from the lows of the candle and close the bar near the top of its
range, which is bullish - at least for one bar, which hadn't been the case during the bearish trend (see Figure 2.5).
The Stages of a Reversal Wick
Stage 1 Stage 2 Stage 3
Essentially, when a reversal wick forms at the extreme of a trend, the market is telling you that the trend
either has stalled or is on the verge of a reversal. Remember, the market auctions higher in search of sellers, and
lower in search of buyers. When the market over-extends itself in search of market participants, it will find itself
out of value, which means responsive market participants will look to enter the market to push price back toward
an area of perceived value. This will help price find a value area for two-sided trade to take place. When the
market finds itself too far out of value, responsive market participants will sometimes enter the market with
force, which aggressively pushes price in the opposite direction, essentially forming reversal wick candlesticks.
This pattern is perhaps the most telling and common reversal setup, but requires steadfast confirmation in order
to capitalize on its power. Understanding the psychology behind these formations and learning to identify them
quickly will allow you to enter positions well ahead of the crowd, especially if you've spotted these patterns at
potentially overvalued or undervalued areas.

HOW TO TRADE PIVOTS THE RIGHT WAYBest Pivot Point Strategy PDF
Pivot Points are one of our favorite trade setups, and we’re going to show you what is the best method to trade pivot points through our best pivot point strategy PDF.
The pivot point strategy doesn’t require significant trading capital, and it can yield positive results right away.
More often than not retail traders use pivot points the wrong way. They usually sell to quickly when the first pivot point resistance level is reached and buy too soon when the first pivot point support level is reached.
This is the wrong way to trade because you’re trading against the prevailing momentum which is one of the reasons why retail traders lose money.
Now, before we go any further, we always recommend taking a piece of paper and a pen and note down the rules of the trading strategy. For this article, we’re going to look at the sell side.
Step #1: Trade only at the London open or the 8:00 AM GMT
The best time to trade the pivot points strategy is around the London session open. However, it can be used for the New York session open with the same rate of success.
We trade the London open because that’s the time big banks are opening for business, and the smart money operates in the market.
Note* We’re going to use the 15-minutes time frame and trade based off of the daily pivot points.
Step #2: Sell at the market if after the first 15-Minutes we’re trading below the Central Pivot Point
If after the first 15-minutes into the London trading session we’re trading below the central pivot point then we sell at the market.
The trade logic behind this simple rule is that once the market is displaying a disposition to trade below the central pivot point, the same as with the law of motion, we assume that the bearish momentum will continue to persist.
If the price of any currency pair is trading below the central pivot point, then the bias for the day is bearish and we’re only looking for selling opportunities.
Important Note * If after the first 15-minutes into the London session we’re too close to the first support level we better skip this trade opportunity because the profit margin has tightened.
Step #3: Hide your Protective Stop Loss 5-10 pips above the Central Pivot
It’s essential to have a good strategy for your stop loss as much as to have an entry strategy.
If the price breaks above the central pivot point then the sentiment has shifted on the bullish side and it’s wise to get out of any short trades. However, in order to accommodate any false breakouts, we also use a buffer of about 5-10 pips above the central pivot point for our SL.
Step #4: Take Partial Profit #1 at Support 1; Take Partial Profit #2 at Support 2.
We employ a multiple take profit strategy because we want to make sure we give the market the chance to reach for deeper support levels.
The first pivot point support level is the first trouble area and we want to bank some of the profits here. We also advice moving your protective stop loss to break even after you took profits.
At the second pivot point support level is where we want to liquidate our entire position and be square for the day.
Note** the above was an example of a SELL trade using the best pivot point strategy PDF. Use the same rules for a BUY trade – but in reverse.
To find out the complete strategy with chart examples PM me and I will be happy to help.


BTC – Multiple Indicators Bullish Short-Term Trend FormingSummary:
It would appear that in the short term Bitcoin is forming a bullish trend that should be a confirmed trade beginning at the range of 8850 if a four hour candle is formed above that level until it meets resistance at 9881. If Bitcoin fails to break out past 8850, it's possible that it could recover at the resistance line around 8400. If 8400 fails to hold than the next downside target would be in the range of 7670.
The chart:
I apologize in advance if the chart seems a little busy but we have a number of indicators pointing to the same price levels which makes for a very nice confirmation and I think it's important to show that.
At the moment 17:51 UTC, Bitcoin is trading at 8579. This puts Bitcoin just above the red dotted line on the chart which shows the low points for trading since 20 March. This is a significant resistance line from which Bitcoin has bounced in just the last couple of hours. The yellow dotted line just below the last candle is the short-term trend up line.
In a larger picture, Bitcoin is in the middle of the long-term triangle as bounded by the blue dotted lines. These are major support resistance for the price of Bitcoin. One of the confirmations that I have for the current price trading range is the last few pivot points which I've plotted out showing R1 (red) at the top which is the upper resistance it also intersects the upper line of the descending major price trend. The lower pivot line S1 (red) handily also intersects the lower major trendline of the triangle for Bitcoin's trading range.
We also have the light blue solid channel which shows the recent trading range of Bitcoin. As you can see Bitcoin is poised to break this channel's upper line, which would be a net positive for the short-term future. Should Bitcoin rise above the solid blue upper channel line and form a candle on the four hour chart somewhere in the neighborhood of 8850, then I would expect price to trade upward until the next Fibonacci pivot point at R1 (red) with the price of 9881. R1 will be a significant resistance point so if we were to make it that far, I would take profits there and expect a pullback into the range of the P pivot center line (Brown colored) on the chart. This level is also confirmed by the upper light blue line of the descending trend channel as a resistance/support line.
So in short, we have several confirmations for the upper and lower bounds as well as the outlined trade.
Please, Don't forget to Like Agree, Comment and Follow Me, It's additional encouragement for me to share my work.
All statements and expressions I offer are my opinions, and not meant as investment advice or solicitation. Information provided is not personal investment advice. Seek guidance from a professional investment advisor before trading or investing. Trading cryptocurrencies can be a potentially profitable opportunity for investors. You should carefully consider your investment objectives, level of experience, and risk appetite. Most importantly, do not invest money you cannot afford to lose. I am not a registered investment advisor.
Wishing you success,
Isaac

GAS/BTC Correction + buy zoneGAS is in a correction. Buy zone in blue box at the daily pivot support matching with volume profile.

XBT BTC Short Position - It is time for a retracement correctionIt is time for a major selloff soon for Bitcoin.
All timeframes are grossly overbought and showing signs of bearish momentum divergence inbound.
Regardless of the fundamental aspects causing any bitcoin increase of price I highly suspect the technicals and high selling pressures will move this correction downward just as it has in the past.
You can also see it's at a critical level of support (green arrows) dating back several months which then transitioned likely into a strong resistance (red arrow). It's unlikely BTC has the power to blast through this level right now.
This is not financial advice and is for educational purposes only.

SALT Long-term Prediction and Potential Profit TargetsYou can see SALT starting to breakout its downtrend falling wedge with good volume.
Labeled are some tiered entry and exit points using Fib retracement/extensions.
SALT is a real project with a solid team and an A+ track record. Huge plans this coming month and Q2. The future is looking bright for SALT. This news could skyrocket SALT which appears poised for a big swing up.
This is for educational purposes only and is in no way investment advice of any kind.

Swing & Pivot Rules - Extreme ExampleMy rules for Pivot & Swing Highs/Low says:
If a H. is broken, the L. is confirmed.
If a L. is broken, the H. is confirmed.
Just with these simple rules one is able to enhance his ability to analyze markets dramatically.
Like these information?
Watch the footer where the links are placed.
P!

BTC prediction As you can see, BTC has just finished a classic ABC correction move following a much larger 12345 Elliot impulse down in a bear trend.
I expect some sideways consolidation and a nice battle between bulls and bears.
It's hard to make a solid prediction up versus down at this time, but what is likely is whichever bias is chosen it's really going to take off quickly.
If BTC moves up, it will reach another critical decision around the 9.5-9.6 k range. Bulish movement up beyond here would tend to confirm an official reversal. It could also be rejected from this level back to its dynamic sloping support.
If BTC moves down, it could restart a new bearish impulse supercycle downward, testing the bottom to form U-shaped double-bottom or perhaps a more violent lower-low with a V-shape.
Time will tell! Either way, should be fun to watch the King as usual :)
This is for education and speculative purposes only and is not meant to serve in any way as investment or trading advice for any financial means.

S&P 500 index bullish?Yesterday the stock market touched SMA 200 as well as the yearly pivot. Also the last candlestick is a bit doji-like. It may be an indication that we can start buying the stock market.

BTC dragonfly 1 D - short term reversal likelyHere you can see a Long legged / dragonfly doji forming.
This indecision signal could be the first sign of a potential short or long term bullish reversal. Keep an eye on this.

Bitcoin BTC Fibronacci Technical AnalysisThis analysis is a "Fib.-trifecta" combining a retracement, fan and spirals.
I actually had to calculate the next Fib. level by hand. I don't think trading is usually this extreme, but hey, this is crypto!
If we break current support, the next support level should be aound 7,200 with a likely range of 6850 - 7,540 per the Bitfinex pricing.
If this happens, I think this will be the end of this very strong correction and we should get a major bounce up and out of this falling wedge.
Let's see what the King has in store for us this weekend.

BTC Correction Reversal Point at $8,500You can see the convergence of horizontal support, dynamic sloping support, downtrend channel support and Fibonacci support.
All converge at a time of a grossly oversold market with relative strength index bullish momentum divergence which is future confirmed with market structure.
Regardless of whether this is the "final bottom", this is a strong buy opportunity and we will start an uptrend as "bottom shorters" find themselves underwater in their positions.
This is fun!

$sc breakdown
orange boxes are possible reversal zones
I think we breakdown at the end of the pattern to the horizontal support or fakeout upwards to the reversal zone and break downards
Daily Log RSI and Wavetrend don't indicate oversold yet. More accumulation to come inside this order block
Looking for volume and/or deviation from pitchfork as trend confirmation

A deeper look at the EURUSD.
Even though the us dollar is experiencing weakness, There is resistance to be found and pivot points still to be driven to the ground.
The horizontal lines display continuation and reversal points pertaining to Fibonacci re-trace-mint on prior overall greater trends.
There are 3 scenarios.
-Consolidation around these pivot points, Breaking and returning until a direction is decided.
-A bounce off then and continuation into down trend.At which point we could reapply the Fibonacci for the according downward trend, To identify continuation extents.
-The final scenario, is the pivot points are broken at which point we would apply the correct Fibonacci re-trace-mint, to see possible location of it reversal extent.


LTCUSD Forecast Currently in a consolidating channel. The yellow lines display points of breakout from the consolidation pattern. The lines are just one of many other signals that go into entering the trader.
The breakout trend lines can also act as a pivot point for trend reversal. Be aware of support and resistance in those areas.
breakoui trend lines = yellow lines, also know as channel lines.
Stochastic are showing convergence

Weekend updateRound numbers look like some support: $11,000 and then $9,000.
Also a monthly pivot going to be offering support at the $9,000 mark.
Please help!-If this is in the wrong section I apologize!
I am a new trader and I am trying to buy and sell small amounts in short amounts of time..I am trying to configure my chart with the pivot reversal strategy and the SMI oscillator. It seems like the default values (especially for the PRS) do not give good indication of when to buy and when to sell. The red indicating to sell are usually lower than the blue arrows indicating when to buy. Also the little ticker at the top always shows the sell price being lower than the buy price...so I am trying to figure out what input values I can put in so that I can sell high and buy low...thank you all so much!

Supports for SiaEven though riding the BTC waves, SIA respecting lines nicely like the top reversal perfect with resistance trend formed by previous two tops, making the supports formed more reliable, even in the face of BTC movements.
Expect support at first purple and first red horizontal, next tried and tested supports would be the lower purple. Even if BTC drops to its 9-10k supports I doubt that SIA will test lower red.
Green is a prediction - If SIA breaks purple, then visually, at this rate, green would form nice support to bounce from, from by the two previous intermediate lows.
MA's and other indicators removed for clarity of LINES ONLY.
Please leave a like, thought's and comments on how to improve analysis appreciated.
