Pivot

Top Events & Setups To Trade Today - EUR/USD & GBP/USD in Focus!Good Morning, traders. It's such a phenomenal beginning of the week. Our forex trading signals closed more than 100 pips. The long-term position in Gold is doing great, and the short-term position helped to pocket nearly 55 pips. Likewise, another signal shared in A Quick Trade Setup on EURJPY closed 60 pips. Now I'm serving up EUR/USD and GBP/USD to secure high probability trades.
Read More for Trade Ideas: www.fxleaders.com

Trend phase up of w1 as long as the pivot point is not broken1. Strategic Direction:
- Weekly is in a Trend up phase (based on FZR of w1)
- Daily is in a trend up phase (based on FZR of d1)

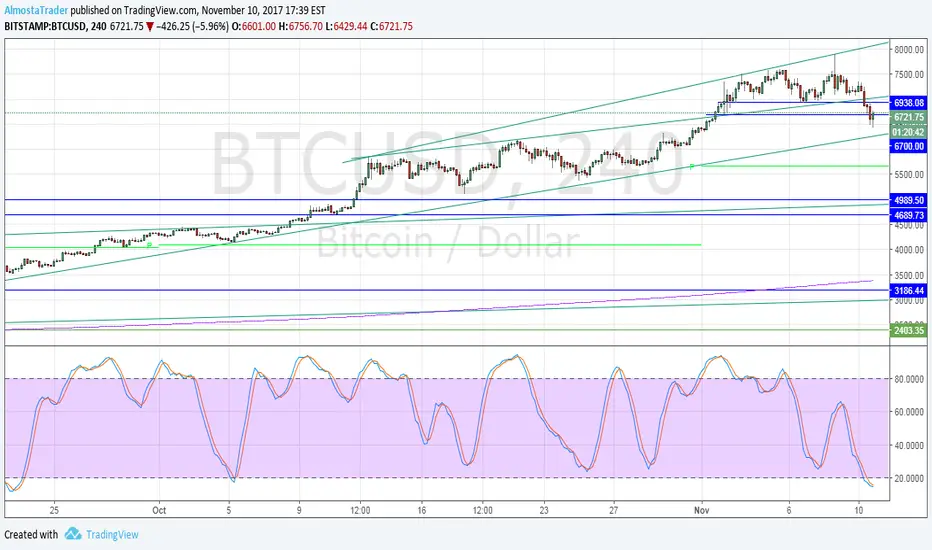
Bitcoin: BTCUSD Pivot point for today looks to be 6450Bitcoin: BTCUSD Update/levels for longs This trade is in balance, but OK above 6450
The trend is overall positive right now barring super near term test of lower parallel and successful, so far, retest of the key
level at 6450 - which looks to be the pivot for day on downside) So If broken at any point and our stop 50 points lower is struck we should look to reverse short
again on the next rally attempt towards 6440 once it's broken - it must then fail there to trigger the short with stop 50
points above. But until the stop is hit, the trade is good and we stay long to target at 6940 and then we look to close out
and get short again with stop 50/60 points above.
We then need price to fall below the lower parallel of this impulse wave with some red candles appearing, bigger the
better...so if don't see this, just some lazy backing and filling but held up by the lower parallel it means Bitcoin is stronger
than anticipated and needs a plan B, again...the width of the parallels is 250 points, great for day-traders and maybe even
for swing traders who are willing to sit with it for a while as one of 3 things occur, most likely:
1. It does what it's meant to, reaches target, get short again, red candles, quite big, a failed bounce and then break of the
lower parallel about 250 lower at 6700 by this point in time and all's well with the short back to 6510 target and then
reverse again, going long with stop under 6420. Sweet.
2. It falls below 6450 and then our stop below here and we're out with 50 point loss plus spreads and reversing completely.
3. It hits our desired target but It doesn't want to break the the lower parallel around 6700 when tested, it holds. In which
case close out shorts and wait to see if the bounce is strong with nice green candles again or feeble and likely to fail ...if
so short gain when failure is evident, on first retest of the failed lower parallel from underneath (with stop 50 points
above), looking for 6510 target, as above from there.
On upside, further out in time, and so we are prepared with straight-forward plans (for experienced traders, anyway) for
any eventuality: Any break above 6960 which is then sustained on the next pull back would be very surprising (so could
happen, it's BItcoin don't forget) and mean we have to long again with stops 50 points under 6940 level.
So the pivot point on upsdie is 6960 by look of thins

$BTCUSD heading into the weekend!Have a great weekend everyone! Watch for the pivot lower, if it breaks support!
THE IMPORTANCE OF VOLUME ANALYSISGood day, All!
Originally, I just wanted to publish another trading idea:
But the more I was looking at the chart, the more it looked like a good example of volume analysis technique.
Basically, the concept is pretty simple - when the price is testing strong supply/demand zones, support/resistance levels, trend lines/etc, significant volume spikes are always accompanying these attempts and further price moves.
Such an impulse is usually enough for the price to travel certain distance, but is loosing its momentum over time.
In order to keep it moving, the price should be supported by further regular medium or higher than that volume spikes.
If the momentum is lost, the market is entering the flat period.
At the same time, the stopping volume at important key points is usually quite higher than the volume which is just enough to keep the price going in already established trend. Really high volume is a great way to detect that something interesting is going on and that this MAY (but NOT necessarily!) be an indication of a turning point.
I would like to underline that sudden volume dynamics change should not be used directly to predict the future trend, but rather should be used to check if the price really keeps its previous direction or it signifies the increased probability of the reversal.
Volume changes at certain levels are initiating, supporting and stopping the waves and patterns which are creating the market as we know it and thus being definitely worth at least keeping a close eye on the sudden changes of their dynamics.
This is my very first purely educational post and I hope it was helpful :-)
If you have any questions, feel free to ask in comments or PM me.

EURJPY Short on break of supportIf the trend support and monthly support level breaks, enter this short towards pivot S3. Be aware of the monthly support levels for your TP's.
Good trading this week!

$EURUSD 4HAll I can see is that we ran into the 200 DMA and hit the monthly pivot? You see anything else?

AUD/USD SELL 09/10/2017
AUD/USD also did not show any significant reaction of the labor market data in the USA on Friday. The only thing that we should note is the new support 0.7744 which contains large volume. Nevertheless, our previous scenario of opening short positions remains actual, but now we need to wait for the sharp breakdown of the support. A move should be supported by increased/large volume. A stop loss should be placed above the breakdown volume bar. A potential of the deal is 70 points.
The bottom line: short positions after a sure breakdown of the support.

$EURUSD daily.Thought I would step back a little and take a look at the bigger picture. Looking to take out a Monthly Pivot, some divergence, support and then we are probably headed lower.


TSI signaling potential VIX move. (Trend Shift Indicator)Rarely does TSI indicate strong green-over-red crossovers in CBOE:VIX derivatives.
TSI is for equities and not derivatives, however, this signal could be an early sign of some potential life in NASDAQ:TVIX and AMEX:UVXY etc.
Link to TSI below.

AUDJPY. Long- daily ema
- pivot
- level
season in october for long position if risk on
I'm waiting for confirmation and good entry point

SPX500 price rejection at prior Week MedianHere, I offer a look at using the prior time frame Median as a means of bullish or bearish sentiment/trend.
The indicator plots PRIOR Daily, Weekly and Monthly Medians.
Currently, this week, we have Bearish Cross of the short term Daily Median below the prior Week Median give us an obvious bearish formation. Conversely, possible value in longer term view for Bulls.
Price has been rejected from the prior Weekly Median as we see an ascending wedge being formed. Point of exhaustion/explosion to play out very soon.

Gold – Again 1250 or escape from 1200-1300 band ???I marked the points where PA touched 1250 level since 2013_
Level 1250 has worked as a strange pivot point within 1200-1300 consolidation band. See how many times we saw 1250 during last four years.
Following FOMC meeting of last week, downward price action_ is favored. A critical event required to push the price back above 1300.
Otherwise as far as the price stays within 1200-1300 band, 1250 seems inevitable.

Missed yearly pivot 2016GBPJPY has reached this year´s pivot.
Only last year is still missed, so price doesn´t like missed pivots and therefore it wants to get back on these missed levels.
3000 pips up!
Patience is the word.
