BTC Breakout is Real Flag Playing Out with Wave 3 MomentumBitcoin is looking really clean here. After weeks of sideways grind inside what looked like a consolidation trap, the structure has finally matured into something meaningful, a classic bullish flag breakout layered inside a broader Elliott Wave count.
What really stands out is how the flag structure (B → C) formed a smooth pullback after the strong A → B impulse. That was the pole. Now we’ve broken out of the flag, and momentum is picking up again, likely heading into wave (3) of the new leg pointing towards D.
This isn’t just about a flag the entire move is developing inside a wide ascending channel, and price is following it almost perfectly. The bullish momentum coming off the breakout zone is clean, no choppiness just strong candles and impulsive drive.
We might get a short-term breather (sub-wave 4 of current wave 3), but structure suggests more upside is likely as long as price holds above that $113K–$115K zone.
What I'm Watching Right now:
Support zone: $113K – $115K
Short-term target: $123-$127K
Final projection (if channel holds): $140K–$145K
Measured move from the flag and wave count both point up there, so I’ll be watching for minor pullbacks as entry opportunities.
Personal Take
I like when patterns align naturally not forced. This one’s got that nice blend of momentum, structure, and price behavior. I’m not rushing entries here, but will scale into dips if price holds support and volume confirms.
Have you spotted this setup on your end too? Drop your view in the comments always keen to see how others are reading this.
Follow for clean, no hype market breakdowns.
Pivot Points

Bitcoin Roadmap=>End of RallyBitcoin ( BINANCE:BTCUSDT ) has gained nearly +10% in the recent weekly candle so far. The question is where this rally could end up. So to get to that zone, let’s go to the weekly timeframe .
Before we start this analysis, let’s take a look at my last analysis on the weekly timeframe , which was well into the Potential Reversal Zone(PRZ) . ( Analysis time: 9 JUN 2025 )
Bitcoin has now entered the Potential Reversal Zone(PRZ) and Time Reversal Zone(TRZ=June 23 to August 4) , and these zones could be the zones where this Bitcoin rally will end. Do you agree with me?
In terms of Elliott Wave theory , Bitcoin appears to be completing a main wave 5 , as the main wave 3 was an extended wave . The main wave 5 could end at the Potential Reversal Zone(PRZ) .
I expect Bitcoin to start a main correction from the Potential Reversal Zone(PRZ) and could continue to support lines and near the $105(at least) .
What do you think about the end of the Bitcoin rally?
Note: Sell orders near $120,000 are very heavy.
Note: Cumulative Long Liquidation Leverage attractive volume for liquidation.
Note: If Bitcoin goes above $130,000, it can continue to rise to the Resistance lines (near $150,000).
Please respect each other's ideas and express them politely if you agree or disagree.
Bitcoin Analyze (BTCUSDT), weekly time frame.
Be sure to follow the updated ideas.
Do not forget to put a Stop loss for your positions (For every position you want to open).
Please follow your strategy and updates; this is just my Idea, and I will gladly see your ideas in this post.
Please do not forget the ✅' like '✅ button 🙏😊 & Share it with your friends; thanks, and Trade safe.

Gold continues to rise after keeping low and breaking high
Last Thursday and Friday, I repeatedly mentioned the position of 3344 to my members. As a strong resistance position in the early stage, every time the price falls below the low point, the pressure to find the bottom and rebound is this area, and then continue to break the low under pressure. This time, we emphasize that breaking through and standing firmly on 3344 is the key. If it can break through and stand firmly, the next resistance is 3358, followed by 3373.
Now the price has broken upward as expected, completing the qualitative change. The next step is to look at the switching of space. Keep low and break high to see acceleration. After breaking the low point, consider sweeping.
Specific key points are expanded:
1. The daily line pattern is still closing and flat. The lifeline is the space switching point in the past one or two months, which will determine the subsequent market space rhythm. At present, the price has successfully broken through the lifeline and switched upward to enter the lifeline to the upper track. 3339-3396
Then, in the case of subsequent market holding the lifeline, maintain the upper range sweep, yes, it is still the rhythm of sweeping, just change the space
2. The four-hour pattern opens slightly upward, pointing to the upward direction
Starting from the lower track 3283 of the squat probe pattern, it has risen steadily. After repeatedly determining the lifeline position 3310 area, it will start to rise further and the pattern will open upward
The lifeline position coincides with the support 3330-3328 area repeatedly determined last Friday, and together they become the last defensive dividing line for the bulls to rise
3. The double-line interval 3330-3325 of the hourly chart has become a space switching area, which previously suppressed the price from falling further, and now it has turned into support, and will rely on the price to further rise Step up, pay attention to the role of the dividing line
4. Maintain the idea of switching with the same profit space, start from 3283 and calculate 3313, then 3328, then 3343, then 3358, and finally 3373, and then 3388, and 3403 (here needs to be highlighted)
5. As shown in the figure, the purple large channel range is swept, the space range is about 100-150 US dollars, this wave of increase is about 100 US dollars, and there is still room to pay attention to. The upper track of the channel overlaps with the upper track of the daily line pattern in the 3396-3400 area, and the 3403 position mentioned above together become the next space dividing line area
In summary, for the current gold, it is still in the rising stage, and the idea remains low and bullish. Pay attention to the process The intensity and amplitude of the adjustment can be squatted to gain leverage, or sideways for a period of time to gain space. Both are ways of correction. After the correction is completed, continue to be bullish and break through.
Referring to this idea, we gave a long position from 3358-3356 in the afternoon. As expected, it sprinted to 3375 as of press time. Those who keep positions should pay attention to the upward loss point, and then pay attention to further rise.
Of course, today's trend will be more tiring, so there is still an opportunity to step back and buy low. Pay attention to the 3364-3362 position to continue to buy low (aggressive 3366 can start), stop loss 3355, target 3380-3388
Another extreme sweep needs to pay attention to the 3342-3339 and 3330-3328 areas. This needs to be determined according to the situation. Pay attention to 3388 and 3396-3403 when switching upward.

GBPUSD: Two Strong Bullish Area To Buy From ?GU is currently in a bullish trend when examined on a daily time frame. There are two potential areas for purchase. The first area is currently active, as we anticipate a price reversal from this point. There is a significant possibility that price could decline to the second area and subsequently reverse from there directly. The sole reason we believe price could drop to the second area is if the US Dollar experiences corrections, which could cause GU to drop to our second area and subsequently rebound.
If you appreciate our analysis, we kindly request that you consider the following actions:
-Liking the Ideas
-Commenting on the Ideas
-Sharing the Ideas
We extend our sincere gratitude for your continuous support. We trust that our insights have provided even a modicum of assistance.
Team Setupsfx_
❤️🚀

8 Year XRP / US OIL Range Break out?Not to get ahead of myself, but... The 8 year range XRP has been in is about to give, too.
The fibonaccis on that point to (at current oil prices):
- $110 (also in range of a number I'd called for)
- $165 (also in range of a number I'd called for)
- $1035 (w/ full global adoption and swift - not out of the question, but I hadn't been able to substantiate this high with my current model. But I am over solving in the model and have a lot of conservative assumptions, basic math could support it - but alot of unknowns getting there.)
#LINKUSDT: Distribution Phase Has Started! Will It Hit $45? The accumulation phase has just ended, and the distribution phase has just begun. Our current concern is whether the bullish volume holds on and the trend continues to remain bullish. Please do your own research before blindly following the analysis, as this is just our bias and does not guarantee that the price will exactly follow the chart.
Thank you for your support throughout. We wish you the best!
Team Setupsfx_

#EURNZD: Wait For Price Breakthrough,Swing Buy With ConfirmationEURNZD is trading at a critical level where the price has previously rejected multiple times. If the price breaks through this region, we could see a swing move and touch the previous higher high. The main question is to wait for a proper breakthrough. When the price does that, we can enter with confirmation. Remember, patience is key!
Good luck and trade safely. Do your own due diligence.
Team Setupsfx_

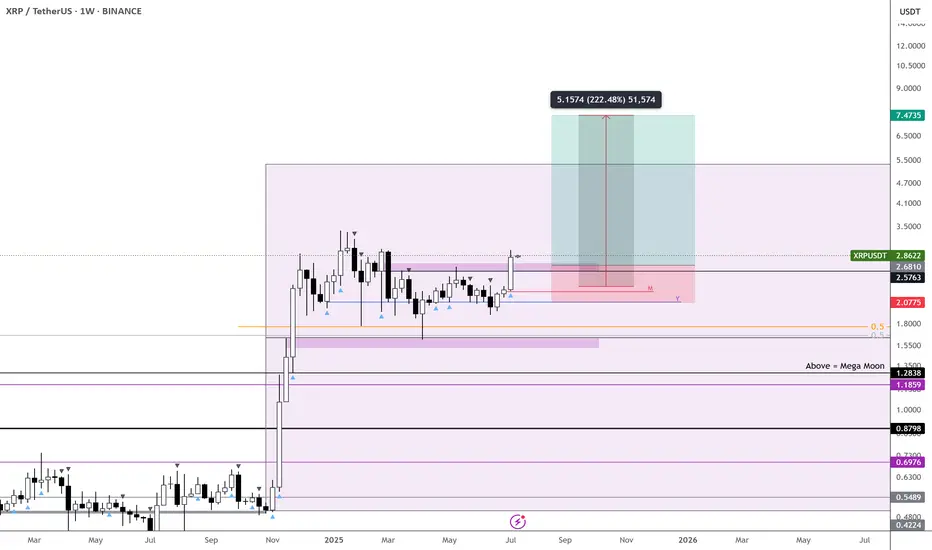
XRP – Dual Trends Active, Ready to Outperform - $7 Incoming
Two active trends on CRYPTOCAP:XRP right now—monthly and weekly confirmations are in, which significantly boosts the probability of hitting the first target.
Honestly, I see this outperforming CRYPTOCAP:ETH , though both are worth holding.
With both timeframes aligned, I’m expecting a strong move.
Targeting $7 on CRYPTOCAP:XRP and over $7k on $ETH.
NASDAQ - Bullish BiasHTF Overview: 4H shows strong bullish intent with momentum driving price higher. Clear upside direction supported by sustained breaks in structure.
Liquidity Note: Noticed a key liquidity zone beneath current price (marked in blue). Although deeper mitigation was possible, price remained bullish.
MTF Refinement (30M): Dropped to the 30M for structural clarity and saw an earlier reaction. A bullish OB was formed and respected — now monitoring it for a potential mitigation.
LTF Execution Plan: If the 30M OB is revisited, I’ll be looking to the 1M/5M for confirmation (CHoCH or BOS) before executing long positions.
Mindset: Momentum is with the bulls — just waiting for smart money to confirm their next move.
Bless Trading!

PEPE – Strongest Setup Among Top Meme Coins
Out of the higher-cap meme coins, I’m leaning more toward $PEPEUSDT.
From a price action perspective, it’s showing more strength than CRYPTOCAP:DOGE , CRYPTOCAP:SHIB , and $WIF. That’s not to say the others won’t pump—but personally, CRYPTOCAP:PEPE looks the most appealing here.
The green box is a solid area to build a position. It’s held the trimester lows well and continues to test them while responding bullishly.
Let’s see how it plays out over the next two months—but I like the odds of upside from here.

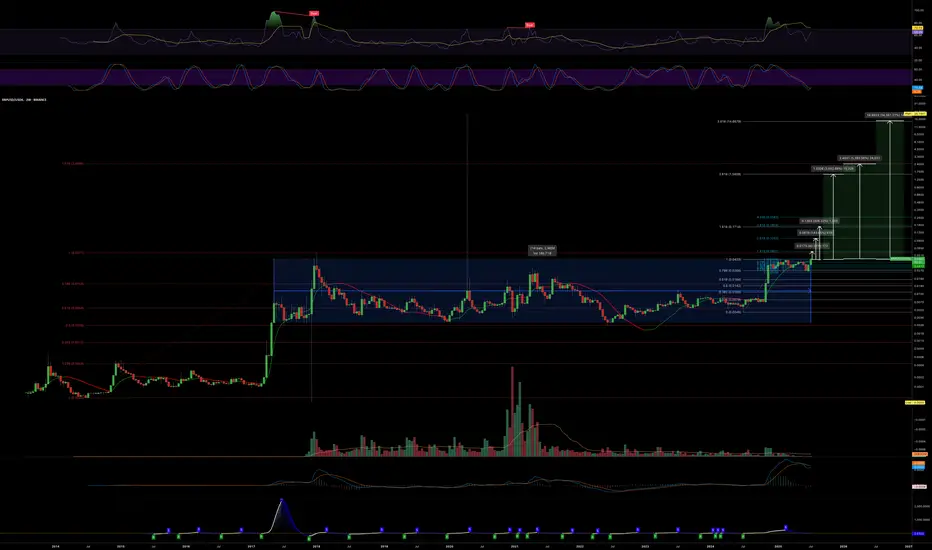
FIL Secondary trend. Channel zone. 31 03 2025Logarithm. Time frame 3 days (less is not needed).
Main trend. Time frame 1 week.
Published more than 2 years ago 22 01 2023
FIL/USD Main trend. From the maximum of $237 -99%
In the specified range, a horizontal channel with a large % step (exactly 370%) was formed earlier (2.590 - 7.157/10.7). There have already been 3 pumping waves in this channel. From the pumping highs in the main trend, the price fell by -98.98%
Secondary trend . This horizontal channel with a step of 370% and work with trend reversal formations.
Local trend , zone of formation of a descending wedge, zone of capitulation and trend reversal.
FIL/USDT Local trend. Wedge. Price clamping . 30 06 2024
Working now with the forming descending wedge and trend reversal in case of its breakthrough.

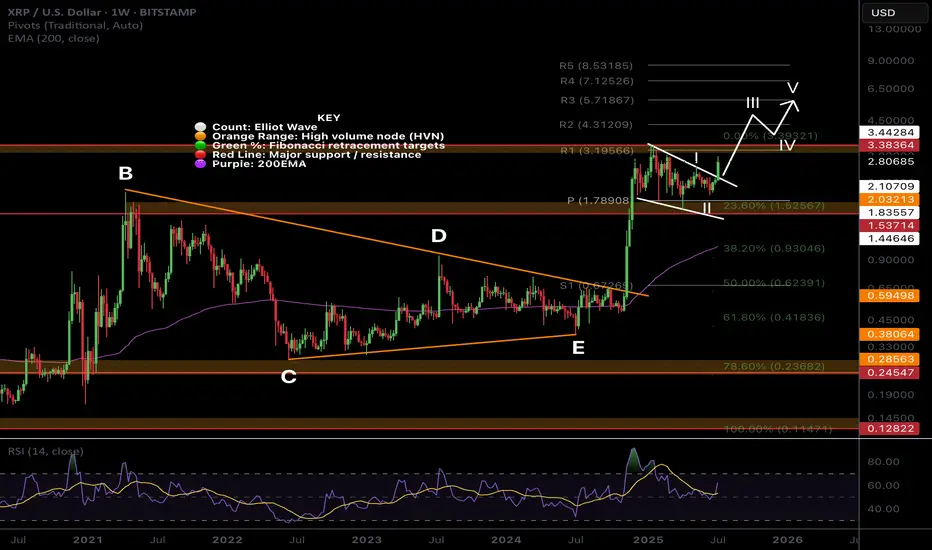
$XRP Macro Tiangle Final Thrust ContinuationCRYPTOCAP:XRP completed a macro triangle pattern last year. Triangles proceed a terminal motif wave which already completed a wave 3.
Wave (3) of (5) is underway with a terminal target around $5.7 after price broke out of the pennant / wedge pattern.
Weekly RSI confirmed bullish divergence.
Safe trading
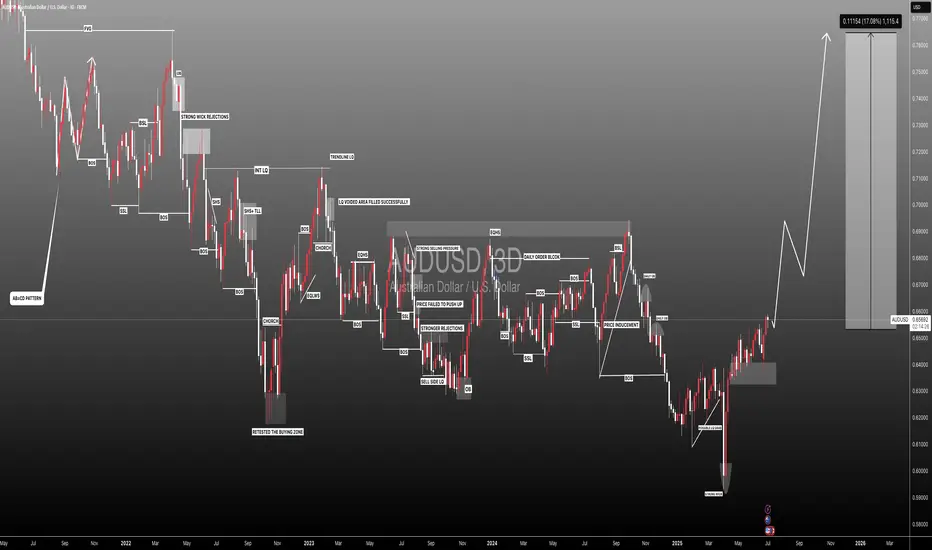
#AUDUSD: +1100 Pips Possible Swing Bullish Move! AUDUSD a strong sign of bullish behaviour has appeared alongside bullish momentum. As we have NFP tomorrow, we expect market to remain volatile; what we think now is to have market settled down before we can have any confirmation. We recommend to remain extra cautious tomorrow, once market get settled we can then enter with accurate risk management.
Like, comment and Share for more!
Team Setupsfx_
$XRP / $USOIL is breaking out of the 7.5 month range. It's time.CRYPTOCAP:XRP / TVC:USOIL is breaking out of the 7.5 month range. It's time.
Fibonacci says it's a 4x from here, $12 at current oil prices, within the $8-12 range I'd been calling for.
Other potential pivots (at current oil prices).
- $4.2
- $7.2
If Oil goes up and the chart structure holds - that effectively would be compounding in USD terms.

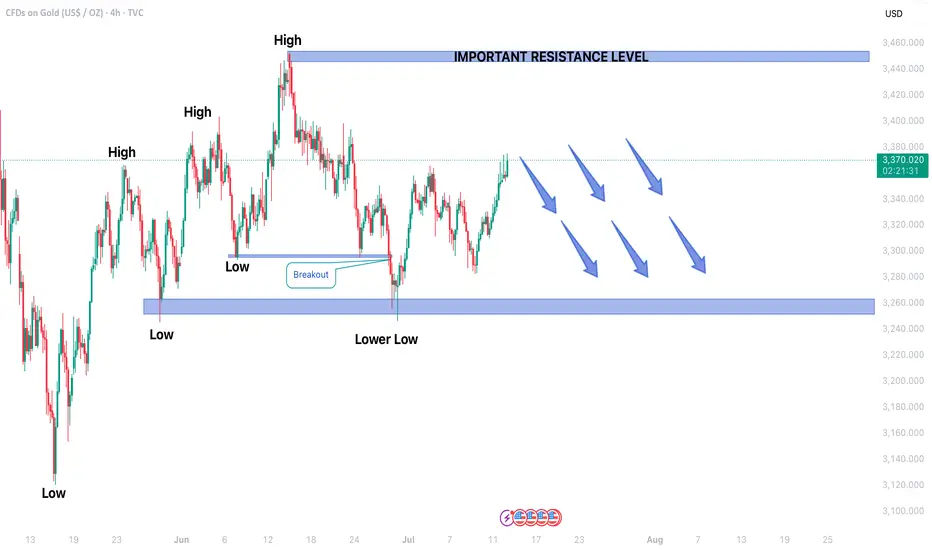
GOLD TRADING IN BEARISH TREND IN 4H TIME FRAMEGold price forming Lower lows which indicated Bearish trend movement.
Price is currently moving in Secondary Trend.
In upcoming sessions secondary trend may end and price may start forming Primary trend.
After a candlestick reversal pattern, Gold may continue to fall.
Price may hit the support level of 3250$ in upcoming sessions.
On higher side 3450$ may act as an important resistance level.
WTI Crude Oil Reverses Lower Near $70 ResistanceA bearish engulfing candle has formed on the daily WTI crude oil chart, with its high perfectly respecting the 38.2% Fibonacci retracement just beneath the $70 handle. Given that the bounce from the June low has been relatively weak compared to the sharp decline from $78, I’m now on alert for a potential break beneath the $64 support level.
That said, the 200-day SMA and EMA currently sit between $65.21 and $65.31, which could offer near-term support. Should oil prices attempt to grind higher within the 1-hour bullish channel, bears may look to fade rallies into the weekly pivot (67.59) or the $68.00 handle, positioning for a potential rollover. A clean break below the 200-day averages would shift focus firmly back to $64, near the June low.
Matt Simpson, Market Analyst at City Index and Forex.com

USDJPY| - Bullish Play Within Bearish HTF ContextHTF Overview (4H): Structure is still technically bearish, with buy-side liquidity (BSL) untouched and a major 4H supply OB unmitigated above. Expecting price to seek out that zone before any full reversal.
MTF Refinement (30M): Refined structure shows a potential bullish leg forming to push toward the 4H supply. Price is reaching for nearby sell-side liquidity (SSL), acting as inducement.
Execution Plan: Waiting for a clean sweep of SSL. Once that occurs and the 30M OB is mitigated, I’ll drop to LTF (1M/5M) to confirm bullish intent with CHoCH or BOS before executing a long.
Mindset: Playing the internal bullish wave with precision while respecting higher timeframe narrative. Quick to react if the HTF bias reasserts itself.
Bless Trading!

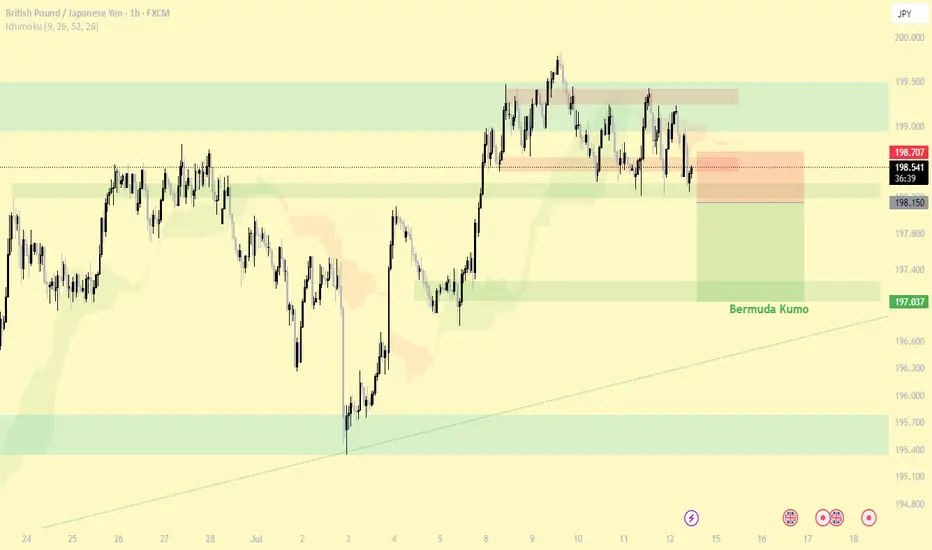
#GBP/JPY Monday 14 Jul 2025Reasons for entering the trade:
1- Breaking the last low of the high and the range area
2- Breaking the 4H support
3- Bermuda Kumo (4H)
Entry: 198.150
TP: 197.037
SL: 198.218
WTI Crude Oil Analysis – 4-Hour TimeframeWTI Crude Oil Analysis – 4-Hour Timeframe
At the moment, the price is trading below a key resistance zone (marked in red), which has previously triggered multiple pullbacks. The current price behavior near this area reflects market hesitation to break through this level.
🔴 Bullish Scenario:
If the price manages to break above this resistance zone and holds above it, we can expect the upward movement to continue toward higher resistance levels. This move may unfold in a step-by-step trend, accompanied by intermediate pullbacks. The next resistance zones could act as potential targets for the bullish wave.
🔴 Bearish Scenario:
If the price reacts negatively to the current resistance area and fails to break through, a bearish correction may follow. In this case, the nearby short-term support levels could be the first targets for sellers. If those supports are also broken, the likelihood of a deeper decline and continuation of the downward trend increases.

GBPUSD Week 29 Swing Zone/LevelsAfter 7 straight weeks of profitable gold trading, we’re shifting gears to GBPUSD.
Why this pair? It’s offering a classic low-risk, high-reward setup that many traders appreciate:
🔒 Stop Loss: 10–15 pips
🎯 Take Profit: 50–100 pips
We’re analyzing price action using a simple but powerful concept:
Each zone is drawn based on how the high and low of one day compares with the next. For example:
Monday’s high/low vs Tuesday’s range
Tuesday’s vs Wednesday’s, and so on
This method helps spot potential continuation zones as market structure unfolds across the week.
👉 The key? Patience, and letting the levels tell the story.
As always price action determines trades

Gold (XAUUSD) Analysis – 4-Hour TimeframeGold (XAUUSD) Analysis – 4-Hour Timeframe
Currently, the price is moving in an upward trend and approaching a key resistance area. Recent volatility suggests that buyers have shown enough strength to break through previous resistance zones and are now attempting to overcome the next significant barrier ahead.
🔴 Bullish Scenario:
If the price manages to break above the current resistance and hold above it, we can expect a continuation of the upward move toward higher zones. In this case, the bullish wave could extend toward the next resistance levels (marked in blue).
🔴 Bearish Scenario:
If the price reacts negatively to the current resistance area and fails to break above it, a corrective decline may follow. The nearest support zone below could play a crucial role in maintaining the bullish structure. However, if this support is also broken, the path could open for a deeper pullback toward lower support levels.

FULL BACK SUPPORT LEVEL 📉 AUDUSD – Potential Rebound from Key Support
Price is currently responding to a well-established horizontal support level, indicating a possible short-term bullish retracement.
The appearance of a bullish imbalance candle on the 1-hour timeframe further strengthens the case for a recovery move.
🎯 Target: 0.658
🕐 Timeframe: 1H
📌 Outlook: Short-term Bullish

CL down sub $60 before moving up above $73Expected support or reversal zone based on last swing high for CL is at $60. This matches with 0.786 fib level of last move up, suggesting a standard SBS structure forming. Expecting a move up to at least $73 (fib 0.236), possibly also well beyond this.
Based on time fib of last swing high I expect the bottom to occur before July 20th.
