BTCUSD – Range Scalping Zones IdentifiedPrice tapped into a previous short zone near 108.6 and showed rejection. We’re watching for downside follow-through toward the 104.2 to 104.5 range where a potential long opportunity may form.
This chart outlines clean range-based levels for scalping. These zones line up with prior liquidity sweeps and local structure shifts. Scalpers can look to react at these levels depending on how price behaves when we get there.
Ideal for traders on lower timeframes like the 15m, but the concept applies across intraday setups. Always wait for confirmation before entering.
Pivot Points

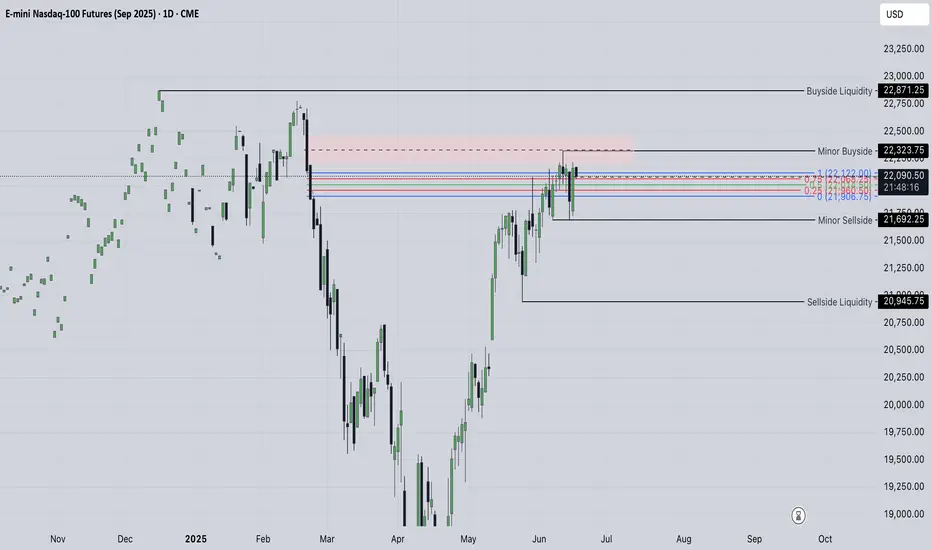
NQ studyI am quite sure the sharp move is coming... which way will it happen we will see, for longer term positions there are no reasonable entries, so once we get a breakout of this distribution or consolidation either way we are likely to see the bigger traders joining along which will accelerate the movement, so far we are looking bullish and ld like to see prices remain above the measured imbalance from 24th of february and its 50 % level, as well as going higher should let us overtake the pink imbalance positioned higher and the minor buyside though we have already received the rejection from that area.
in this case
Looking for sellside delivery first of all I am interested in the minor sellside (20945) as we have formed the equal lows down there, breaking this level will likely put us in shorts for a period of time receiving so called correction to the upward movement we had.
Eurofins Scientific SE Stock Quote | Chart & Forecast SummaryKey Indicators On Trade Set Up In General
1. Push Set Up
2. Range Set Up
3. Break & Retest Set Up
Notes On Session
# Eurofins Scientific SE Stock Quote
- Double Formation
* (Diagonal) - *Shift & Entry | Completed Survey
* (2nd Entry Area)) + *Lower Band Feature | Subdivision 1
- Triple Formation
* (P1)) / (P2)) & (P3)) | Subdivision 2
* (TP1) = a / Long Consecutive Range
* (TP2) = b / Short Consecutive Pullback | Subdivision 3
* Daily Time Frame | Trend Settings Condition
- (Hypothesis On Entry Bias)) | Indexed To 100
- Position On A 1.5RR
* Stop Loss At 118.00 EUR
* Entry At 123.00 EUR
* Take Profit At 128.00 EUR
* (Uptrend Argument)) & No Pattern Confirmation
* Ongoing Entry & (Neutral Area))
Active Sessions On Relevant Range & Elemented Probabilities;
European-Session(Upwards) - East Coast-Session(Downwards) - Asian-Session(Ranging)
Conclusion | Trade Plan Execution & Risk Management On Demand;
Overall Consensus | Buy

Macromics Group: Market Trends Overview (June 2025)Global Economic Landscape: What Has Changed?
June 2025 marks significant shifts in the global economy. After several years of instability caused by the pandemic, inflation, and geopolitical tensions, markets are gradually stabilizing. However, new challenges are emerging: rising risks in Asia, digital transformation in Europe, and strategy shifts in the U.S.
China and India continue to show strong growth rates—5.8% and 6.5% respectively. Europe, by contrast, is lagging behind due to slow recovery and persistent inflation. The U.S. maintains a steady course driven by consumer spending and innovation, reporting 2.1% GDP growth.
Macromics Group continues to deliver in-depth analytics and strategies for clients seeking to understand and capitalize on these changes. We analyze trends across more than 120 industries, helping companies adapt and thrive.
Macroeconomics and Monetary Policy: A Shift Toward Stabilization
Financial regulators have begun cautiously lowering interest rates after the peaks of 2024. The U.S. Federal Reserve has dropped its rate to 4.5%, while the ECB has reduced its rate to 3.75%. This is made possible by a decline in inflation: 2.7% in the U.S. and 3.1% in the EU.
Meanwhile, developing nations like Turkey and Argentina are still grappling with high inflation. These countries risk falling behind the global recovery unless decisive steps are taken.
Overall, the global course is toward soft stabilization: interest rates remain high but steady. This creates favorable conditions for investment and long-term planning.
Financial Markets: From Caution to Moderate Optimism
Stock markets in June 2025 show mixed performance. U.S. indexes such as the S&P 500 and Nasdaq hit new highs, thanks to the booming tech sector. Stocks of companies involved in AI, quantum computing, and cybersecurity are particularly strong.
European markets are less active but relatively stable. Growth is limited by high costs, demographic issues, and the transition to ESG standards. In Russia and CIS countries, markets are under pressure due to sanctions, currency restrictions, and reduced investment.
On the currency front, the U.S. dollar and Chinese yuan dominate. The ruble is volatile, the euro is stable, and the yen is strengthening as a safe haven asset.
Technology: The Engine of New Markets
The main trend in 2025 is AI and automation. Companies are deploying neural networks in logistics, marketing, finance, and HR to cut costs and boost efficiency. Demand for AI professionals and developers is surging.
5G infrastructure has matured in most developed countries, unlocking new potential in IoT, telemedicine, and remote work. At the same time, quantum computing is advancing rapidly, with commercial solutions expected by 2026.
Macromics Group invests in next-generation analytical platforms, enabling clients to access real-time insights and forecast trends before they go mainstream.
Energy and Sustainability: ESG and the “Green” Shift
Energy markets have stabilized after the turbulence of 2024. Oil prices remain between $70–$85 per barrel—comfortable for both producers and consumers. Meanwhile, renewable energy—solar, wind, and hydrogen—is seeing record investment.
Corporations are increasingly reporting according to ESG standards. It’s not just a trend, but a new business reality. Investors demand transparency, consumers prefer socially responsible brands, and regulators impose mandatory reporting.
Macromics Group supports clients in transitioning to sustainable models by developing ESG strategies, assessing risks, and offering financial solutions.
Conclusion: Outlook for the Second Half of 2025
The first half of 2025 showed that markets are learning to operate in a new reality. The global economy is no longer chasing rapid growth, but adapting to volatility. Key focus areas are technology, sustainability, and smart resource management.
For businesses, this means quick adaptation, innovative thinking, and reliance on data-driven decisions. In this context, Macromics Group serves not just as an analyst but as a strategic partner.
Our recommendation: act proactively. In times of uncertainty, those who plan years ahead and use quality data will win.

Nifty Analysis EOD – June 16, 2025 – Monday🟢 Nifty Analysis EOD – June 16, 2025 – Monday 🔴
📈 Expected Follow-Through Plays Out – Bulls Eye 25K Hurdle Next
Nifty opened flat-to-positive at 24,737, briefly dipped to the day’s low of 24,703.60, and then reversed smartly to touch an intraday high of 24,967.10 by 13:40. After that, the index spent the rest of the day consolidating in a narrow 40-point band and closed at 24,940.95 intraday (adjusted close: 24,946.50), delivering a solid +227.90 point gain.
As anticipated, the 24,768–24,800 support zone provided the launchpad for further upside, confirming the bullish follow-up from Friday's recovery. The rally tested 24,967, just shy of the crucial resistance at 24,972, which remains a key watch for the next session.
🔍 However, going forward, the bulls face major challenges around 25,000–25,080. This zone has acted as a hurdle in the past and could either stall the rally or serve as a breakout trigger. Watch price behavior carefully around these levels to assess conviction.
🛡 5 Min Chart with Levels
🕯 Daily Time Frame Chart
🕯 Daily Candle Breakdown
Open: 24,732.35
High: 24,967.10
Low: 24,703.60
Close: 24,946.50
Change: +227.90 (+0.92%)
📊 Candle Structure Breakdown
Real Body: 214.15 pts → 🟢 Strong Green Candle
Upper Wick: 20.60 pts
Lower Wick: 28.75 pts
🔍 Interpretation
Opened near day’s low, closed near day’s high — classic bullish sentiment.
Small wicks show controlled buying with minimal resistance and shakeouts.
Reinforces the bulls’ momentum after Friday’s OL recovery candle.
🔦 Candle Type
💚 Bullish Marubozu–type / Bullish Continuation Candle– Often found during the middle leg of a bullish swing, signaling strong trend momentum.
📌 Key Insight
Today's price action confirmed continuation of the recovery.
Close above 24,950–25,000 in the next session could ignite fresh upside.
Rejection around 25,060–25,080 would indicate caution — stay nimble.
🛡 5 Min Intraday Chart
⚔️ Gladiator Strategy Update
ATR: 268.49
IB Range: 114.05 → Medium IB
Market Structure: ⚖️ Unbalanced
Trades:
✅ 10:20 AM – Long Triggered → Target Achieved, Trailing SL Hit (RR: 1:3.28)
📌 Support & Resistance Zones
Resistance Levels
24,972 ~ 25,000
25,060 ~ 25,080
25,102 ~ 25,125
Support Levels
24,894 ~ 24,882
24,825 ~ 24,847
24,725 ~ 24,735
24,660
💭 Final Thoughts
The market played exactly as mapped — now it’s about decision time near 25K. Will the bulls charge ahead or pause? Either way, the structure favors short-term bullishness — but profit booking pressure near resistance must be expected.
🧠 “Momentum is a gift – but without volume and conviction, it fades at resistance.”
✏️ Disclaimer
This is just my personal viewpoint. Always consult your financial advisor before taking any action.

ETHUSDT Daily: Navigating the "Deciding Area" Chart Overview:
The ETHUSDT Daily chart presents a compelling narrative of a significant uptrend, followed by a sharp correction, and now shows price approaching a critical inflection point. Key support and resistance zones, along with a crucial trendline, define the current market structure. The chart is labeled "Bullish," suggesting the analyst's long-term bias or expectation of a continuation of the prior uptrend.
1. The Prior Bullish Trend (Late 2023 - Early 2025):
Long-Term Uptrend Line (Green): From around September 2023 into early 2025, ETHUSDT exhibited a strong bullish trend, respecting a clear upward-sloping trendline (highlighted in green). Price consistently found support on this trendline, indicating robust buying pressure and a controlled ascent.
Key Resistance ($3900 to $4000): During this period, ETH encountered significant resistance around the $3900 to $4000 zone. This area represents a supply zone where sellers stepped in, preventing further upward movement on multiple attempts.
2. The Major Correction & Trendline Breakdown (Early 2025):
Sharp Downturn: In early 2025, ETHUSDT experienced a steep and aggressive correction. This bearish impulse led to a decisive breakdown below the long-term green uptrend line.
Shift in Momentum: The breach of this established trendline was a critical event, signaling a significant shift in short-to-medium term momentum from bullish to bearish.
3. Finding Support & Bounce Back:
Weekly Support ($2000 to $2200): After the breakdown, price found initial strong support in the $2000 to $2200 zone. This area had acted as a crucial pivot in previous price history, demonstrating its significance as a demand zone.
Strong Support ($1400 to $1500): Below the weekly support, the $1400 to $1500 zone is identified as "Strong support." This would be the next major demand area if the 2000−2200 level were to fail. The chart shows price briefly dipping below the 2000−2200 zone before finding a base and initiating a strong rebound.
Recent Bounce: The current price action shows a strong bounce from the lows reached after the trendline breakdown, indicating renewed buying interest and an attempt to recover.
4. The "Deciding Area" ($2900 to $3000 & Red Trendline):
Confluence of Resistance: The most critical area on the chart is the "Deciding Area," which represents a confluence of significant resistance levels:
The Former Green Trendline (now acting as resistance): What was once a strong support trendline has now likely flipped to become a resistance trendline (implied by the red line, which is parallel or an extension of the green line). Price often retests broken trendlines before continuing in the new direction.
Horizontal Resistance Zone ($2900 to $3000): This grey box aligns with previous support/resistance levels and now acts as a key overhead supply zone.
Current Price Engagement: Price is currently approaching the lower boundary of this "Deciding Area." This zone will determine the immediate future direction of ETH.
Potential Scenarios:
Bullish Continuation (Breakout): If ETHUSDT can successfully break above the "Deciding Area" ($2900 to $3000 zone and the red trendline) with strong volume, it would signal a significant shift in buying conviction. The next logical target would be the "Key Resistance $3900 to $4000" area, and potentially a retest of its all-time highs. The current bullish arrow on the chart suggests this is the anticipated move if the "Deciding Area" is breached.
Bearish Rejection (Reversal): A strong rejection from the "Deciding Area" could see ETHUSDT consolidate or retrace back towards the "Weekly Support $2000 to $2200" zone. A failure to hold this support could then lead to a test of the "Strong Support $1400 to $1500."
Conclusion:
ETHUSDT is at a pivotal point, engaging with a highly significant "Deciding Area" that combines both horizontal and trendline resistance. The ability of the bulls to push through this zone will be crucial for determining whether the rally from the recent lows can continue towards prior highs or if ETH will face another period of consolidation or deeper correction. Traders should closely monitor price action and volume at these critical levels for confirmation of the next directional move.
Disclaimer:
The information provided in this chart is for educational and informational purposes only and should not be considered as investment advice. Trading and investing involve substantial risk and are not suitable for every investor. You should carefully consider your financial situation and consult with a financial advisor before making any investment decisions. The creator of this chart does not guarantee any specific outcome or profit and is not responsible for any losses incurred as a result of using this information. Past performance is not indicative of future results. Use this information at your own risk. This chart has been created for my own improvement in Trading and Investment Analysis. Please do your own analysis before any investments.

Breakout dayGood setup, good chart.
Surfing 10 and 20 ema`s (1D).
Seems like a breakout day.
Stop below 1D low.
Target ? Sky is a limit )
BTCUSDT Daily: Analyzing Key Support & ResistanceChart Overview:
BTCUSDT Chart indicates the price action from a bearish phase into a significant bullish reversal and subsequent consolidation. Key price levels, market structure shifts, and Fibonacci retracement zones are highlighted, offering potential areas of interest for traders.
1. The Bearish Phase & Breakdown (February - April):
• Initial Downtrend: The price initially depicts a downtrend characterized by a series of lower highs and lower lows, indicating strong bearish control.
• "Break Down": In late February/early March, price decisively broke below a significant support level (indicated by the "Break Down" label). This confirmed the continuation and strength of the bearish momentum, pushing BTCUSDT to lower lows around the $76,000 region.
2. The Market Structure Change (Late April - Early May):
• Trend Reversal: Following the lows in April, we observe a strong bullish impulse. This rally culminated in price breaking above a critical resistance zone (highlighted by the upper grey box labeled "Market Structure Change").
• Significance: This "Market Structure Change" is a pivotal event. It signifies a shift from bearish control (lower highs/lows) to bullish dominance (higher highs/lows), as previous resistance becomes potential support (a "flip" level). This is often the first major sign of a trend reversal.
3. The Bullish Impulse & All-Time High (May - Early June):
• Strong Uptrend: After the market structure change, BTCUSDT experienced a powerful bullish move, establishing new higher highs.
• "All Time High at $112,000": The price reached a new all-time high around $112,000 (specifically labeled as 111,999.0). This peak marks the top of the measured bullish impulse, which serves as the anchor point for the subsequent Fibonacci retracement.
4. Current Consolidation & Fibonacci Retracement (June - Present):
• Pullback from ATH: Following the new all-time high, BTCUSDT has pulled back and entered a period of consolidation, exhibiting a ranging behavior.
• Fibonacci Retracement: A Fibonacci retracement tool has been applied from the significant swing low (around $93,389.7, which is the 1.0 Fib level relative to the ATH) to the "All Time High." This tool helps identify potential support levels where price might find buyers during a pullback.
o "Daily Immediate Support": This area, approximately between $102,694.4 (0.5 Fib) and $100,498.5 (0.618 Fib), has acted as strong immediate support. Price has bounced from this zone multiple times, confirming its significance. The 0.618 Fibonacci level is often referred to as the "Golden Ratio" and is a highly watched retracement level for potential reversals or strong support.
o "Daily Key Support": This deeper support zone, around $93,389.7 (which aligns with the 1.0 Fib of the previous swing and the prior "Market Structure Change" area), represents a critical level. If the "Daily Immediate Support" fails, this zone would be the next major test for bullish continuation. Its alignment with the previous market structure change adds to its importance as a "flip" level (former resistance turned support).
• "Daily Target": The label "Daily Target" is positioned near the previous highs/resistance. In the current context of consolidation and pullback, this area now acts as a key resistance zone that bulls would need to overcome to resume the uptrend towards new all-time highs. It represents the immediate bullish objective.
Potential Scenarios:
• Bullish Continuation: If BTCUSDT continues to hold above the "Daily Immediate Support" (green zone) and then breaks above the "Daily Target" resistance with conviction, it would signal a likely continuation of the uptrend towards new all-time highs above $112,000.
• Deeper Retracement: A breakdown below the "Daily Immediate Support" would likely lead to a test of the "Daily Key Support" (lower grey zone). A strong bounce from this level would still keep the bullish structure intact for the larger timeframe.
• Trend Invalidaton/Reversal: A decisive break below the "Daily Key Support" (lower grey zone / 1.0 Fib of the prior swing) would be a significant bearish development, potentially invalidating the recent bullish market structure and indicating a deeper correction or even a reversal of the current uptrend.
Conclusion:
BTCUSDT is currently in a consolidation phase after a strong rally to new all-time highs. The immediate focus is on whether the "Daily Immediate Support" holds. Traders should closely monitor price action around both the immediate and key support zones, as well as the "Daily Target" resistance, for clues on the next directional move. Volume confirmation for any breakouts or breakdowns will be crucial.
Disclaimer:
The information provided in this chart is for educational and informational purposes only and should not be considered as investment advice. Trading and investing involve substantial risk and are not suitable for every investor. You should carefully consider your financial situation and consult with a financial advisor before making any investment decisions. The creator of this chart does not guarantee any specific outcome or profit and is not responsible for any losses incurred as a result of using this information. Past performance is not indicative of future results. Use this information at your own risk. This chart has been created for my own improvement in Trading and Investment Analysis. Please do your own analysis before any investments.

Bank Nifty Weekly Insights: Key Levels & TrendsBank Nifty ended the week at 55,527.35 with a loss of -1.86%
Key Levels for the Upcoming Week
🔹 Price Action Pivot Zone:
The critical range to monitor for potential trend reversals or continuation is 55,410 to 55,645
🔹 Support & Resistance Levels:
Support Levels:
S1: 55,058
S2: 54,588
S3: 54,119
Resistance Levels:
R1: 56,000
R2: 56,474
R3: 56,947
Market Outlook
✅ Bullish Scenario: A sustained move above 55,645 could trigger buying momentum, potentially driving Bank Nifty towards R1 (56,000) and beyond.
❌ Bearish Scenario: If the index falls below 55,410, selling pressure may increase, pulling it towards S1 (55,058) and lower levels.
Disclaimer: lnkd.in

Nifty 50 at a Turning Point? Key Levels & Market Outlook AheadThe Nifty 50 ended the week at 24,718.60 with a rejection of (-1.14%)
If Nifty sustains below 24,641, selling pressure may increase. However, a move above 24,798 could restore bullish momentum.
Key Levels for the Upcoming Week
🔹 Price Action Pivot Zone:
The crucial range to watch for potential trend reversals or continuation is 24,641 -24,798.
🔹 Support & Resistance Levels:
Support:
S1: 24,407
S2: 24,094
S3: 23,570
Resistance:
R1: 25,035
R2: 25,352
R3: 25,888
Market Outlook
✅ Bullish Scenario: A sustained breakout above 24,791 could attract buying momentum, driving Nifty towards R1 (25,035) and beyond.
❌ Bearish Scenario: A drop below 24,641 may trigger selling pressure, pushing Nifty towards S1 (24,407) or lower.
Disclaimer: lnkd.in

USOIL Remains Bullish Amid Geopolitical Tensions and Steady Fed USOIL – Bullish Outlook Amid Geopolitical and Policy Factors
The ongoing escalation in the Middle East, combined with Jerome Powell's stance on holding interest rates steady, continues to support bullish momentum across commodities, including oil.
Technical Outlook:
USOIL remains bullish as long as it trades above 72.72 and more firmly above 70.40, with upside potential toward 77.30 and 79.50. If bullish momentum persists, a further extension to 84.14 is possible, supported by geopolitical risks.
A bearish shift is only likely if significant de-escalation or negotiations between Israel and Iran take place.
Key Levels:
• Pivot Point: 72.90
• Resistance: 77.29, 79.50, 84.10
• Support: 66.87, 63.52, 59.00
Trend Outlook:
Bullish while price holds above 68.53

Gold weekly outlookFib zones for buys and sells as well as the regression trend channel.
I suspect Gold will reverse to the upside soon, possibly once the Gap is filled

Block Inc Stock Quote | Chart & Forecast SummaryKey Indicators On Trade Set Up In General
1. Push Set Up
2. Range Set Up
3. Break & Retest Set Up
Notes On Session
# Block Inc Stock Quote
- Double Formation
* (A+ Set Up)) At 85.00 USD | Completed Survey
* (2nd Entry Area)) + Anchored VWAP - *A+ | Subdivision 1
- Triple Formation
* (P1)) / (P2)) & (P3)) | Subdivision 2
* (TP1) = a / Long Consecutive
* (TP2) = b / Short Consecutive | Subdivision 3
* Daily Time Frame | Trend Settings Condition
- (Hypothesis On Entry Bias)) | Regular Settings
- Position On A 1.5RR
* Stop Loss At 67.00 USD
* Entry At 61.00 USD
* Take Profit At 52.00 USD
* (Downtrend Argument)) & No Pattern Confirmation
* Ongoing Entry & (Neutral Area))
Active Sessions On Relevant Range & Elemented Probabilities;
European-Session(Upwards) - East Coast-Session(Downwards) - Asian-Session(Ranging)
Conclusion | Trade Plan Execution & Risk Management On Demand;
Overall Consensus | Sell

TONUSDT On the @TONUSDT chart, price is currently making a corrective move after reacting to the key support at 2.800. It may rise toward the 3.230 resistance and potentially break higher with a pullback to continue upward. However, if the 2.800 support fails, a deeper drop could follow. ⚠️📉
Resistances:
• 3.230 💥
• 3.371 🔼
• 3.656 🔼
• 3.948 🚀
Supports:
• 2.910 🛡️
• 2.800 🔻
⚠️Contorl Risk management for trades.

CL ready for new move upBased on time fib and Feigenbaum constants, CL is closing in on the bottom for this swing, expected within marked timezone. The swing highs/lows follows the Feigenbaum projections for the last few swings. I expect a dip below $57 before a new run higher, at least to $72-73.

GOLD (XAUUSD): Support & Resistance Analysis For Next Week
Here is my latest structure analysis and
important supports & resistances for GOLD XAUUSD
for next week.
Consider these structures for pullback/breakout trading.
❤️Please, support my work with like, thank you!❤️
I am part of Trade Nation's Influencer program and receive a monthly fee for using their TradingView charts in my analysis.
Nifty Analysis EOD – June 13, 2025 – Friday 🟢 Nifty Analysis EOD – June 13, 2025 – Friday 🔴
🕊️ Gap-Down on Geopolitical Tension – Buyers Step In at Crucial Support
Nifty opened with a massive gap-down of 415 points at 24,473 triggered by overnight geopolitical tensions — testing a crucial swing low from May 22. Interestingly, the market formed an OL (Open = Low) pattern and staged a powerful 281-point intraday recovery, closing near the day’s high at 24,718.60.
While the adjusted close still reflects a −0.68% drop, the price action was dominantly bullish. The strong bounce from the 24,460–24,520 demand zone — a region that had acted as a reversal zone multiple times earlier — reaffirms its significance.
🧭 If global cues stabilize or turn positive, this could pave the way for a bounce back toward 25,000. But if Friday’s low is breached, sentiment damage may deepen further. For now, intraday opportunities are preferable over positional plays, as uncertainty persists.
📝 A reminder from the May 22 note:
“Is the retracement run finished? Technically, YES. A bold call, but unless global headwinds reappear, today’s low must sustain.”
Nifty has once again honored this level — but the coming sessions will determine whether this bounce was genuine or temporary.
🛡 5 Min Chart with Levels
🕯 Daily Time Frame Chart
🕯 Daily Candle Breakdown
Open: 24,473.00
High: 24,754.35
Low: 24,473.00
Close: 24,718.60
Net Change: −169.60 (−0.68%)
📊 Candle Structure Breakdown
Real Body: 245.60 pts → 🟢 Strong Green Candle
Upper Wick: 35.75 pts
Lower Wick: None (OL Formation)
🔍 Interpretation
Despite the gap-down, bulls took control right from the open.
The absence of a lower wick signals firm intraday confidence.
Closing near the high reinforces the buying strength, even on a net down day.
🔦 Candle Type
💚 Bullish Marubozu–like (OL) Candle– Represents a strong intra-session reversal, where buyers dominated from the very first tick.
📌 Key Insight
Price respected the 24,460–24,520 zone, once again validating it as key support.
If the next session crosses and sustains above 24,750–24,770, a short-term reversal confirmation could follow.
However, a breakdown below 24,473 may renew bearish pressure.
🛡 5 Min Intraday Chart
⚔️ Gladiator Strategy Update
ATR: 269.05
IB Range: 145.05 → Medium IB
Market Structure: Balanced
Trades:✅ 10:20 AM – Long Triggered → Target Achieved, Trailing SL Hit (RR: 1:1.7)
📌 Support & Resistance Zones
Resistance Levels
24,725 ~ 24,735
24,825 ~ 24,847 (Fibonacci 0.5 retracement level)
24,882 ~ 24,894
24,972 ~ 25,000
25,060 ~ 25,080
Support Levels
24,660
24,640 ~ 24,625
24,420
24,365 ~ 24,330
24,245 ~ 24,220
💭 Final Thoughts
Friday’s session was a battle between fear and resilience — and bulls showed up just in time. The key test ahead: can the index reclaim 25K or will the bounce fade away?
🧠 “Great rebounds are born from great fear — but follow-through is what separates noise from reversal.”
✏️ Disclaimer
This is just my personal viewpoint. Always consult your financial advisor before taking any action.

15.06.2025Gold has recently dazzled markets, surging past $3,400 per ounce, propelled by a potent mix of geopolitical tension and a softer U.S. dollar. Key levels to watch for the next week Support at 3380, Resistance at 3460. the Renewed Middle East tension could drive the price to the new highs at 3660 on the downside fail of 3380 will bring the price back to 3260 .

USDJPY| Bull vs Bear at Key ZoneUpdated the chart and noticed both bullish and bearish order blocks near current price — classic tug-of-war setup, and USDJPY does this often.
Structure is still developing, and the direction will be confirmed through how price reacts on the entry timeframes. Whichever side mitigates first with intent gives the trade.
Until then, it’s observation mode — watching closely and letting price reveal the path.
— Inducement King 👑
Bless Trading!

USDJPY| Bearish Structure in FocusUSDJPY broke a major lower high on the 4H, creating new external liquidity that has yet to be swept. This shift opened the door for potential bearish continuation.
On the 30-minute, I confirmed bearish intent with a major low taken. Structure aligns, but patience is key — I’m only interested in entries within premium pricing.
Now watching for buy-side liquidity to be swept into my marked order block. That reaction will be the signal for possible downside continuation.
Setup is clear. Execution comes with precision.
— Inducement King 👑
Bless Trading!

Let’s break down what's currently happening in the GBP/USD.GBP/USD Analysis in a Simple and Beginner
Let’s break down what's currently happening in the GBP/USD market, in a way that even someone without any trading experience can grasp easily.
At the moment, the market attempted to break out on the buy (upside), but it faced rejection, meaning it tried to go higher but couldn’t sustain that move and started falling down.
As the price dropped, it reached a point where a bullish engulfing pattern had previously formed this is a special pattern in trading which often signals a potential strong buying opportunity.
Now, here’s the key point:
📍 If the market comes back down to this engulfing buy zone, there's a high probability that it will bounce back up strongly from there think of it like a spring that’s been compressed and is ready to launch upward.
On the other hand:
📍 If the market doesn’t come down and instead continues moving upward, then we already have a bearish engulfing pattern waiting at a higher level. This is a zone where the market could face resistance and fall sharply again.
So what should you do?
✅ Be patient — let the market come to these important engulfing levels.
✅ Don’t rush into trades. Let the price touch these zones and then observe the reaction.
These engulfing zones are like magic they often predict powerful movements. Wait for the price to reach the level, and then watch the magic unfold.
Even if you're new to trading, this kind of analysis helps you understand when and where the market might turn without needing complicated indicators.
DYOR! Not Financial Advice.

NAS100\ Bullish Play DevelopingNasdaq holds a strong bullish structure on the 4H, so I moved down to the 15-minute for a cleaner bird’s-eye view of price action. Liquidity was swept directly into a refined order block — a precise tap that validated the zone.
Price is now hovering around a 5-minute OB. Just observing and letting the market unfold.
Discipline and patience — that’s where the edge is.
— Inducement King 👑
Bless Trading!

GBPUSD| Bullish Structure HoldingGBPUSD continues to map out a bullish structure. While higher timeframe liquidity remains untouched, I’m anticipating a potential continuation on the lower timeframes.
Refined the 30-minute structure and confirmed bullish intent is intact. Now focused on price taking short-term liquidity and mitigating into the marked order block before considering any execution.
The setup is developing — staying patient and letting price come to me.
— Inducement King 👑
Bless Trading!
