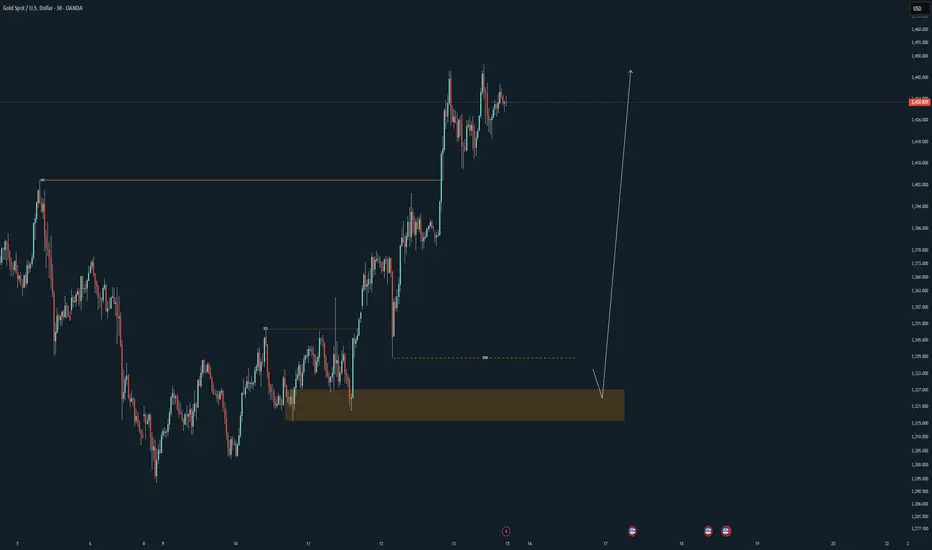
XAUUSD| Bullish Momentum Building with CLean StructureGold continues to show strong bullish momentum, with price steadily climbing and maintaining upward pressure.
I dropped to the 30-minute chart to refine structure, and the bullish narrative remains intact.
At this point, I’m allowing price to develop — waiting patiently for a potential liquidity sweep that aligns with my criteria.
No chasing, no guessing — just reading the market and executing when the story aligns.
Refined structure. Momentum confirmed.
Patiently waiting to act — as always, precision is key.
— Inducement King 👑
Bless Trading!
Pivot Points
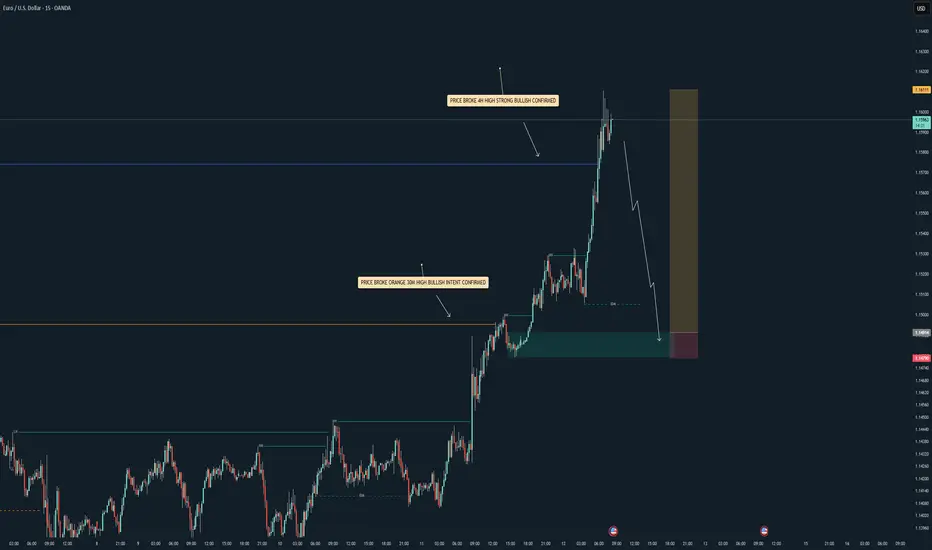
EU Loading the Next Leg Up| Bullish Bias in MotionEU gave that clean 4H high break — strong bullish intent locked in.
Zoomed into the 30M and spotted that refined structure doing what it does.
Now just sitting tight, waiting on market open to see if price wants to bless the kid with that next leg up.
High timeframe bias is bullish.
Mid-timeframe structure aligned.
It’s patience time — sniper mentality 🧠🎯
Bless Trading!

Federal Realty Trust Quote | Chart & Forecast SummaryKey Indicators On Trade Set Up In General
1. Push Set Up
2. Range Set Up
3. Break & Retest Set Up
Notes On Session
# Federal Realty Trust Quote
- Double Formation
* (Reversal Argument)) At 120.00 USD | Completed Survey
* (A+ SIgnal)) - *Swing Low | Subdivision 1
- Triple Formation
* (P1)) / (P2)) & (P3)) | Subdivision 2
* (TP1) = a / Long Consecutive
* (TP2) = b / Short Consecutive | Subdivision 3
* Daily Time Frame | Trend Settings Condition
- (Hypothesis On Entry Bias)) | Regular Settings
- Position On A 1.5RR
* Stop Loss At 87.00 USD
* Entry At 95.00 USD
* Take Profit At 105.00 USD
* (Neutral Argument)) & No Pattern Confirmation
* Ongoing Entry & (Neutral Area))
Active Sessions On Relevant Range & Elemented Probabilities;
European-Session(Upwards) - East Coast-Session(Downwards) - Asian-Session(Ranging)
Conclusion | Trade Plan Execution & Risk Management On Demand;
Overall Consensus | Neutral

AAVEUSDT 📊The current price BINANCE:AAVEUSDT is trading in a range between 275 and 240 dollars, and it’s likely we’ll see a fake breakout to 300 dollars. After this move, the price is expected to correct to 240 dollars and then head for a bigger move toward 320 dollars and higher.
📈If the 240-dollar level breaks, the next support levels at 210 and 175 dollars should be watched.
🔼Support Levels: 240, 210, 175 dollars
🔽Resistance Levels: 275, 300, 320 dollars

#XAUUSD[GOLD]:+2200 Pips Big Move! | Setupsfx_|Gold is currently accumulating in smaller timeframes, which suggests it’s in the early stages of a significant move. It’s possible that the price will reverse from either of the entry zones. There are three take-profit areas you can target, but only if they align with your view. This is an educational post, so please don’t blindly follow it – do your own analysis.
Like and comment for more!
Team Setupsfx_

Bull Trap or Just the Beginning? All Eyes on 103kOnce we cleared the 109k ATH, I began tracking this new structure (in blue). Considering the current macroeconomic backdrop, it’s starting to make a lot more sense.
There’s plenty of noise about this being the biggest bull run in recent times, but looking at the chart, FVGs left behind, lack of volume commitment, and inefficient price action… are we actually gearing up for one of the largest bear markets we’ve seen instead?
You really don’t want to see a weekly close below 103k.

XAUUSD BreakdownHere we are waiting for the price to take liquidity at 3447.5 then test to our supply zone to trade to the demand zone at 3370.7-3339.5 .
i will inform in the group before we enter the trade .
Please folow to support me !

Caught EU clean today. Waited patiently for that textbook 30M liquidity sweep, then stalked the LTF entry like a sniper. No rushing—just letting price do its thing until it stopped running. Then we pounced. 💥
Execution was sharp. Setup was smooth.
This is how we trade over here—precision, patience, and purpose.
📉 Stay tuned for the breakdown and upcoming analysis.
Would love to hear y’all thoughts on this one 👀👇
#SMC #Forex #InducementKing #EUTrade #SmartMoneyFlow
Bless Trading!

XAUUSD(GOLD): +1874 PIPS Target| Touching $3600? Gold experienced a significant price surge, driven by the ongoing conflict between Iran and Israel. This heightened uncertainty among global investors led to a price touch of $3445. The current price is accumulating, and we anticipate a strong bullish distribution in the near future. Please prioritise accurate risk management during trading.
Good luck,
Team Setupsfx_


Palo Alto Networks Inc Stock Quote | Chart & Forecast SummaryKey Indicators On Trade Set Up In General
1. Push Set Up
2. Range Set up
3. Break & Retest Set Up
Notes On Session
# Palo Alto Networks Inc Stock Quote
- Double Formation
* (A+ Set Up)) At 635.00 USD | Completed Survey
* (Diagonal) - *Long Entry
*Upper Band #3 | Subdivision 1
- Triple Formation
* (P1)) / (P2)) & (P3)) | Subdivision 2
* (TP1) | Subdivision 3
* Daily Time Frame | Trend Settings Condition
- (Hypothesis On Entry Bias)) | Regular Settings
- Position On A 1.5RR
* Stop Loss At 130.00 USD
* Entry At 200.00 USD
* Take Profit At 300.00 USD
* (Neutral Argument)) & No Pattern Confirmation
* Ongoing Entry & (Neutral Area))
Active Sessions On Relevant Range & Elemented Probabilities;
European-Session(Upwards) - East Coast-Session(Downwards) - Asian-Session(Ranging)
Conclusion | Trade Plan Execution & Risk Management On Demand;
Overall Consensus | Neutral

NESTLE INDIA SWING TRADE SETUP📊 Price Action & Trend Analysis
Analyzing market trends using price action, key support/resistance levels, and candlestick patterns to identify high-probability trade setups.
Always follow the trend and manage risk wisely!
Price Action Analysis Interprets Market Movements Using Patterns And Trends On Price Charts.
👉👉👉Follow us for Live Market Views/Trades/Analysis/News Updates.

GOLD|Bullish Momentum Builds in Gold Amid Geopolitical TensionsGold | Market Overview
The escalating conflict, particularly Israel’s attack on Iran, is significantly driving bullish momentum in the gold market. Should Iran respond, we may witness a continued rally toward new all-time highs.
As previously forecasted, gold successfully reached our target of 3431. A short-term correction toward this level is possible before the uptrend resumes. However, if the price manages to close a 1-hour candle above 3431, it will likely trigger a swift move toward 3500 and 3525.
• Pivot Level: 3431
• Resistance Levels: 3480, 3500, 3525
• Support Levels: 3404, 3376, 3366

SUI — Trading with Geometry: Why Harmonics Work So WellSUI has been respecting technical levels with remarkable consistency. After bouncing from the $2.8467 low, it surged sharply — completing a clean Cypher Harmonic Pattern. This led to a high-probability short setup at the 0.786 Fibonacci retracement (Point D) around $3.5573.
🎯 Trade Setup Breakdown
Pattern: Cypher Harmonic
Entry (Point D): $3.5573 (0.786 retracement of XC)
Target: $3.1191 (0.618 retracement of CD)
Stop-Loss: Above Point X
The 0.618 fib retracement of the CD leg coincides with a significant key low from May 6, 2025, adding structural confluence. This is an ideal level to monitor for absorption, reaction, or potential reversal behaviour.
🧠 Educational Insight: How to Trade Harmonic Patterns Like a Pro
Harmonic patterns aren't just visually appealing — they represent high-probability setups based on market structure, Fibonacci geometry, and behavioural cycles. The most critical part of every harmonic pattern?
You enter at Point D.
Whether the pattern is bullish or bearish, Point D is your trigger:
In bearish patterns (like this Cypher), you short from Point D.
In bullish patterns, you long from Point D.
This works because Point D marks the exhaustion of the corrective leg, where trapped traders and liquidity often sit. The structure often aligns with supply or demand zones, order blocks, or FVGs (Fair Value Gaps).
💡 Important: Harmonic patterns are most effective on higher timeframes — 4H and above. On lower timeframes, noise increases and reliability drops significantly. For clean execution and meaningful structure, stay with mid to high timeframes.
Here’s how to trade it effectively:
✅ Wait for the full pattern to form — don’t front-run
✅ Use fib levels and structure confluence to validate Point D
✅ Use order flow tools (like Exocharts) to confirm absorption or volume shift
✅ Enter on Point D with your stop-loss just beyond X
✅ Take profits at common retracement levels like the 0.382 or 0.618 of the CD leg
Patience is key. Harmonic traders wait for the market to complete the cycle — then strike with a plan.
📌 Final Thoughts
SUI is delivering clean harmonic respect, and this setup is no exception. Whether you're already short or waiting for further confirmation, keep an eye on volume, liquidity zones, and reaction levels around $3.1191. If this zone holds, it may serve as a pivot for the next move.
Pattern. Precision. Patience. That's how you catch high-probability trades like this.
_________________________________
💬 If you found this helpful, drop a like and comment!
Want breakdowns of other charts? Leave your requests below.

Gold Weekly Outlook: Bullish Breakout on DeckHello,
🪙 XAU/USD Weekly Outlook
📅 May 25 – 30, 2025
📍 Current Price: $3,355.35
📈 RSI (1D): 57.99 — Neutral to mild bullish momentum
🔮 Summary & Key Levels
Gold remains bullish, supported by USD weakness, geopolitical tension, and safe-haven demand. Without hawkish shocks, expect a test of $3,440+ this week.
Level Significance Likelihood
$3,300 – $3,355 Support zone, dip-buying likely 🔵 High
$3,355 – $3,390 Current range, mild upside grind 🟡 Moderate
$3,390 – $3,440 Key resistance test 🟢 Likely if USD weak
$3,440 – $3,500 Breakout extension zone 🟠 Conditional (Fed/dovish data needed)
< $3,280 Bearish invalidation 🔴 Unlikely barring major USD reversal
🧭 Directional Bias:
Bullish with breakout potential — driven by rising U.S. debt concerns, Fed rate cut talk, and risk aversion.
🔍 Supporting Factors
US Dollar Weakness:
USD dropped 1.4–2.3% vs majors; JPY & CHF gained as safe havens.
Moody’s downgrade of U.S. credit rating and weak Treasury auctions amplify fiscal stress.
Trump’s tariff threats revive trade war fears, pressuring USD further.
Fed & Inflation Watch:
Fed speakers mixed; Waller hinted at cuts if tariffs escalate.
May 31 Core PCE inflation data critical — softer print could ignite breakout.
Safe-Haven Rotation:
JPY & CHF strength signals risk hedging.
Global tensions, equity fragility, Middle East unrest support gold demand.
🌐 Global Macro Highlights & Gold Implications
Region Highlights Gold Impact
🇺🇸 US Fiscal strain, downgrade, mixed data 🟢 Bullish
🇪🇺 Eurozone Hawkish ECB, stable inflation 🟡 Mildly bullish
🇬🇧 UK Strong CPI, Brexit optimism ⚪ Neutral
🇯🇵 Japan Hawkish BoJ pivot, rising inflation 🟢 Safe-haven driver
🇨🇭 Switzerland CHF rally, deflation concerns 🟢 Risk-off tone
🇨🇦🇦🇺🇳🇿 Mixed data, dovish bias ⚪ Commodity FX support
📅 Key Events to Watch (May 25–30)
Date Event Impact on Gold
Daily Fed speakers (Waller, Bostic) 🟠 Dovish tone supports gold
Friday US Core PCE Inflation 🟥 Major catalyst — soft print = breakout risk
Anytime Trump tariff announcements 🟥 Volatility spike = bullish catalyst
Ongoing Risk sentiment & equity volatility 🟠 Supports safe-haven flows
✅ Bottom Line
Gold’s technical and macro setup is strong. A push above $3,390 could open a move toward $3,440–$3,470, especially if Friday’s PCE data disappoints or trade tensions escalate. Downside limited unless USD sentiment reverses sharply.
The Support and Resistance outlined in green and red are the respective support/resistance for this pair currently for 1M-1Y timeframes!
No Nonsense. Just Really Good Market Insights. Leave a Boost
TradeWithTheTrend3344

NEIRO – Re-Entering for Continuation Toward Yearly OpenGiving BINANCE:NEIROUSDT another shot at a long. (Last one was a great one)
Caught the first impulse move, and now looking for continuation into the Yearly Open.
Starting to bid here and will stay patient this week— Mostly dependent on CRYPTOCAP:ETH reclaiming the 2900–3000 zone.
That reclaim would shift my outlook entirely and increase the probability of new highs.
Longing here for now, with eyes on confirmation soon.

EURGBP: Overbought Market & Pullback🇪🇺🇬🇧
EURGBP nicely respected a key daily horizontal resistance.
After a liquidity grab above that, the price formed
a strong bearish imbalance candle on an hourly time frame.
I think that the pair will retrace to 0.85
❤️Please, support my work with like, thank you!❤️
I am part of Trade Nation's Influencer program and receive a monthly fee for using their TradingView charts in my analysis.

EU| Workflow - End of Week but Still in SyncPrice still pushing with strong bullish conviction, so I’m just flowing with it and waiting on that precision entry — nothing forced, just discipline and patience.
Even though we’re nearing the end of the week, the workflow and higher timeframe analysis still align, so I’m staying ready. I’ve got my zones mapped out and I’m watching for price to pull back into that green zone POI. Once that mitigation happens, I’ll drop to the 1M for the structure shift and look for that 5M LH break to confirm my entry.
Just letting the setup mature and keeping emotions out of the way. 📊
Always open to hearing how others are viewing EU right now — let’s elevate the convo while we wait on the market to give us the greenlight. 🎯
#SMC #EU #SmartMoney #TopDownPrecision #InducementKing #JuicemannnStyle #ForexFlow #EndOfWeekExecution
Bless Trading!
Nifty Analysis EOD – June 12, 2025 – Thursday🟢 Nifty Analysis EOD – June 12, 2025 – Thursday 🔴
📉 Range Breakout on Expiry – Bears Steal the Show
As highlighted in yesterday’s note — “Watch 25,222 on the upside and 25,080 on the downside for breakout” — Thursday’s expiry session decisively broke the range to the downside, unleashing a sharp bearish move.
Nifty opened strong at 25,164.45, briefly tested 25,196, but once again failed to challenge 25,200. The rejection triggered a slide to 25,083, and shortly after, the critical support of 25,080 gave way. This breakdown triggered long unwinding and fresh shorts, accelerating the fall all the way to 24,825.90 — a sharp 197-point drop.
Though there was a brief 90-point retracement, that too was sold into, and the index closed at 24,888.20 (adjusted), very close to the day’s low. This fall filled the Gaps created on June 6 and 9, and settled around the 0.5 Fibonacci retracement level (based on June 3 low to June 11 high).
With such a close, the market signals a strong shift in sentiment. Going ahead, 24800–24768 becomes a critical support zone. Bulls now need to reclaim and close above 25,020 to regain any strength. Until then, bias remains bearish.
🛡 5 Min Chart with Levels
🕯 Daily Time Frame Chart
🕯 Daily Candle Breakdown
Open: 25,164.45
High: 25,196.20
Low: 24,825.90
Close: 24,888.20
Net Change: −253.20 (−1.01%)
📊 Candle Structure Breakdown
Real Body: 276.25 pts → 🔴 Strong Red Candle
Upper Wick: 31.75 pts
Lower Wick: 62.30 pts
🔍 Interpretation
Bears dominated from start to finish, with hardly any resistance from the bulls.
The close near the day’s low reinforces strong bearish sentiment.
The lower wick is minimal — buying interest was absent post-selloff.
🔦 Candle Type
🔥 Bearish Marubozu–like Candle– Reflects powerful downside momentum and strong seller conviction.
📌 Key Insight
The candle wipes out 3 sessions of buildup — textbook bearish breakdown.
Support at 24,820–24,850 is critical. A breakdown from here could invite deeper correction.
Only a close above 25,020 can negate this bearish tone. Otherwise, weakness may persist.
🛡 5 Min Intraday Chart
⚔️ Gladiator Strategy Update
ATR: 252.81
IB Range: 131.4 → Medium IB
Market Structure: Balanced
Trades:✅ 11:10 AM – Short Triggered → Target Achieved, Trailing SL Hit (RR: 1:4.65)
📌 Support & Resistance Zones
Resistance Levels
24,920
24,972 ~ 25,000
25,060 ~ 25,080
25,102
25,125
25,180 ~ 25,212
Support Levels
24,820
24,800 ~ 24,768
24,735 ~ 24,725
24,660
24,640 ~ 24,625
💭 Final Thoughts
With a decisive range breakdown and expiry volatility behind us, the battle zone shifts to 24,800–25,000. Expect more pressure if bulls fail to reclaim 25,020.
🧠 “Markets don’t wait forever at the edge of range—they break, and break hard.”
✏️ Disclaimer
This is just my personal viewpoint. Always consult your financial advisor before taking any action.

USDT DOMINANCE NEW UPDATE (4H)The price is now approaching an important support zone and hasn’t yet pulled back to the broken trendline.
It’s expected that the price will soon recover from the green box, move toward the red box as a symbolic move, and then get rejected downward again from the red box.
For risk management, please don't forget stop loss and capital management
Comment if you have any questions
Thank You

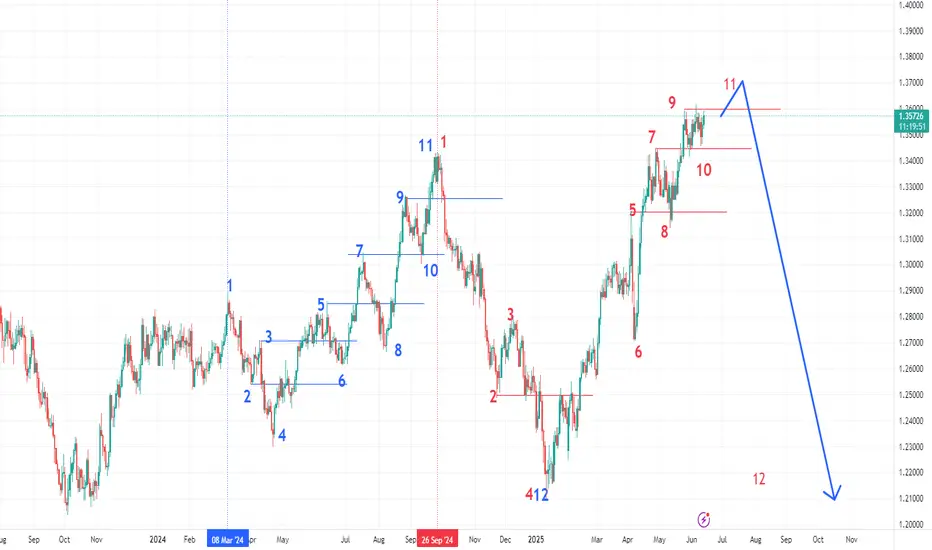
GBPUSD Daily Sequence Start march 2024 prince movement repeat in Sep 2024 on similar way
highs and lows are the same so we expect up to 11 point then drop to near point 4 (last TP) as what happened before.
IF crossed level of point 7 this conformation for dropdown start
what do you think ?
USNAS100 | Breakout or Breakdown?USNAS100 | OVERVIEW
The price is currently stabilizing below the pivot level at 21790, suggesting continued bearish momentum.
📉 As long as the index remains below 21790, we expect a decline toward 21635. A confirmed 1H candle close below this level could extend the bearish trend toward 21470.
📈 A shift to bullish momentum will require a 1H candle close above 21820, which could open the way to 22090 and potentially a new all-time high at 22200.
Support Lines: 21635, 21470
Resistance Lines: 21930, 22090, 22200

SPX500 | Bearish Below 6010 Ahead of PPI – Trade Talks in FocusSPX500 | OVERVIEW
US Futures Edge Lower Ahead of PPI Report
U.S. stock futures dipped on Thursday as investors await the latest PPI data, following a softer-than-expected CPI report that eased pressure on the Federal Reserve to hike rates.
On the geopolitical front, U.S. and Chinese negotiators have reached a preliminary trade agreement during talks in London. However, the deal still requires formal approval from Presidents Trump and Xi.
📉 Technical Outlook:
The index holds a bearish momentum as long as it trades below the pivot level at 6010. If price remains under this level, it may extend the decline toward 5966, and a firm close below this support could open the path to 5938 and 5902.
📈 A bullish reversal may occur if the price breaks above 6010, with confirmation on a 1H close above 6020, targeting higher resistances.
Support Levels: 5966, 5938, 5902
Resistance Levels: 6033, 6056, 6098
