CRUDE OIL (WTI): Detailed Support & Resistance Analysis
Here is my latest structure analysis for WTI Oil.
Resistance 1: 63.6 - 65.9 area
Resistance 2: 68.2 - 69.2 area
Resistance 3: 71.4 - 75.2 area
Support 1: 61.8 - 62.8 area
Support 2: 59.0 - 60.8 area
Support 3: 55.1 - 57.2 area
Consider these structures for pullback/breakout trading.
❤️Please, support my work with like, thank you!❤️
Pivot Points

SUI – Prepping for New Highs
CRYPTOCAP:SUI showing clear signs of strength after that reaction at $3.
Starting to build a position here and will add more on a potential Monthly retest—if it comes.
Expecting this to push above $6 and enter price discovery in the next two months.
Could follow a similar path to its October 2024 – January 2025 move. BINANCE:SUIUSDT

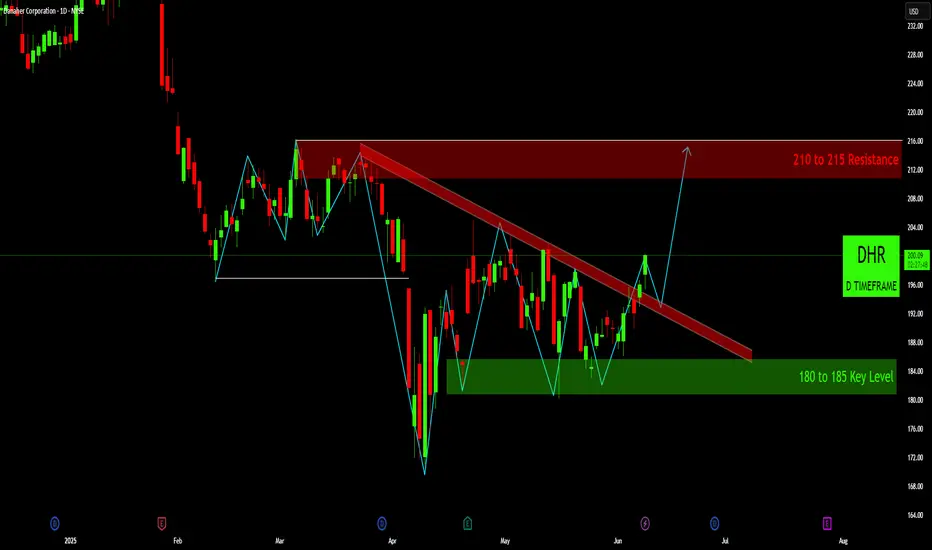
DHR: Bullish Breakout from Descending TrendlineOverview: Danaher Corporation (DHR) on the daily chart appears to have undergone a significant bearish pattern followed by a period of consolidation. The recent price action suggests a potential bullish reversal, as the stock has now broken above a key descending trendline, signaling a shift in momentum.
Context & Price History:
Prior Topping Pattern: From roughly February to April, DHR exhibited classic signs of a topping formation. The price repeatedly failed to break above the 210 to 215 Resistance zone (red shaded area), indicating strong supply in this region. The price action leading to the sharp April decline could be interpreted as a Head and Shoulders pattern or a triple top, with the white horizontal line around 196- 197 acting as a critical "neckline" or support level.
Sharp Decline & Key Support: Following the breakdown from the neckline in April, DHR experienced a significant sell-off, finding strong demand and bottoming out within the 180 to 185 Key Level support zone (green shaded area). This zone has proven to be a robust area of buyer interest.
Consolidation & Descending Trend: Since the April lows, DHR has been trading within a range, largely constrained by a descending trendline (thick red diagonal line) acting as dynamic resistance, while finding support at the 180-185 key level. This price action formed a descending triangle or wedge-like pattern.
Key Levels & Patterns:
Major Resistance (210 to 215): A strong supply zone where sellers have repeatedly stepped in. This will be the primary upside target if the current bullish momentum sustains.
Key Support (180 to 185): A critical demand zone that has held up well, providing a strong foundation for the recent recovery.
Descending Trendline (Red): This dynamic resistance has capped rallies since March/April. A decisive break above it is a bullish signal.
Pivotal Level (~196-197, White Line): This level acted as prior support (neckline) before the April drop. Now, it serves as a minor horizontal resistance that the price has recently overcome, potentially flipping to support on a retest.
Current Situation (As of Analysis):
DHR is currently trading around $200. Critically, the price has made a strong move above the long-standing descending trendline. This breakout suggests that bullish sentiment is gaining control after a prolonged period of consolidation.
Potential Scenarios:
Bullish Continuation (Primary Indication on Chart):
Confirmation: The chart's projection anticipates a retest of the broken descending trendline (which now acts as support) or the ~
196=197 pivotal level, followed by a bounce and continuation higher.
First Target: Upon a successful retest and bounce, the immediate target for buyers would be the 210 to 215 Resistance zone.
Why: A confirmed breakout from a multi-month descending trendline, especially after holding strong key support, is a strong bullish reversal signal.
Bearish Rejection / Fakeout:
Confirmation: If DHR fails to hold above the broken descending trendline and closes convincingly back below it (and potentially below the ~196-197 level), it would suggest that the breakout was a "fakeout."
Downside Potential: In such a scenario, the price could re-enter the consolidation range and potentially retest the 180 to 185 Key Level.
Confirmation & Invalidations:
Bullish Confirmation: A successful retest of the descending trendline (now support) with a clear bounce, or a sustained daily close above the ~196-197 level, preferably with increasing volume.
Invalidation of Bullish Setup: A decisive daily close back below the descending trendline and the ~ 196-197 pivotal level would suggest that the bullish momentum has faltered and the current breakout might be false.
Conclusion:
DHR has presented a compelling technical setup with a breakout from a significant descending trendline. This breakout, combined with the stock holding firm at the 180-185 key support, suggests a potential shift in trend from bearish consolidation to a renewed bullish advance. Traders should look for confirmation of the breakout (e.g., a successful retest and bounce) before targeting the 210-215 resistance zone.
Disclaimer:
The information provided in this chart is for educational and informational purposes only and should not be considered as investment advice. Trading and investing involve substantial risk and are not suitable for every investor. You should carefully consider your financial situation and consult with a financial advisor before making any investment decisions. The creator of this chart does not guarantee any specific outcome or profit and is not responsible for any losses incurred as a result of using this information. Past performance is not indicative of future results. Use this information at your own risk. This chart has been created for my own improvement in Trading and Investment Analysis. Please do your own analysis before any investments.
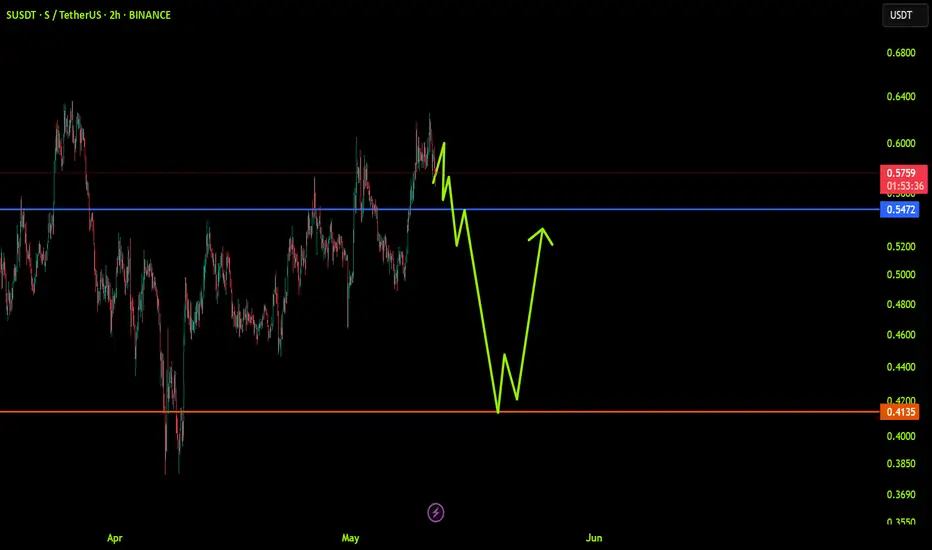
SUSDT: trend in 2H time framesThe color levels are very accurate levels of support and resistance in different time frames, and we have to wait for their reaction in these areas.
So, Please pay special attention to the very accurate trend, colored levels, and you must know that SETUP is very sensitive.
Be careful
BEST
MT

Nifty Analysis EOD – June 9, 2025 – Monday🟢 Nifty Analysis EOD – June 9, 2025 – Monday 🔴
🎯 Stuck at the Top – Expansion Coming Soon?
Nifty opened with a strong Gap-Up of 127 points at 25,127, landing right at the upper resistance cap. But from the very first candle, it was clear that the market was unsure—price action showed indecision, and the index could barely add another 16 points before hitting the day’s high of 25,143.45.
From there, the index retraced about 66 points, marking a low at 25,077.15, before attempting a gradual recovery toward the high. But that breakout attempt was unsuccessful, and Nifty drifted back to the mean and closed the day at 25,103.20—essentially wrapping the entire session within a tight 65-point range.
Buyers fought hard to defend 25,100, while sellers tried to fill the morning gap. The narrow range and mean reversion hint at consolidation, setting the stage for a possible expansion in the coming sessions. Stay patient—the coil is tightening.
🛡 5 Min Chart with Levels
🕯 Daily Time Frame Chart
🕯 Daily Candle Breakdown
Open: 25,160.10
High: 25,160.10
Low: 25,077.15
Close: 25,103.20
Net Change: +100.15 (+0.40%)
📊 Candle Structure Breakdown
Real Body: 56.90 pts → 🔴 Red candle (Close < Open)
Upper Wick: 0 pts (Open = High)
Lower Wick: 26.05 pts
🔍 Interpretation
Price opened at the high and failed to push any higher – showing no strength above the open.
Despite a positive close versus the previous session, the candle is bearish intraday.
The lower wick shows some support, but not enough to flip the bias.
🔦 Candle Type
🟥 Red Inverted Hammer / Bearish Pin Bar– Typically signals weakness or potential reversal, especially when forming near resistance zones.
📌 Key Insight
The structure shows exhaustion or profit booking.
A move below 25,077 could open the door to further downside.
However, holding above 25,100–25,130 will keep bullish hopes alive.
🛡 5 Min Intraday Chart
⚔️ Gladiator Strategy Update
ATR: 262.59
IB Range: 66.3 → Small IB
Market Structure: imBalanced
Trades:❌ No Trade Triggered by the system
📌 Support & Resistance Zones
Resistance Levels
25,116 ~ 25,128
25,180 ~ 25,212
25,285
Support Levels
25,062 ~ 25,070
24,972
24,920 ~ 24,894
24,800 ~ 24,768
💭 Final Thoughts
Today was a pause, not a pullback—yet.With price compressed in a tight band, volatility expansion is likely ahead.
🧠 “Markets don't stay quiet for long. Silence often precedes a scream—watch which direction the breakout takes.”
✏️ Disclaimer
This is just my personal viewpoint. Always consult your financial advisor before taking any action.

BTC NEW UPDATE (4H)This analysis is an update of the analysis you see in the "Related publications" section
These days, Bitcoin's movement is mostly driven by liquidity hunting and is caught in complex and risky corrections.
The resistance zone currently in front of Bitcoin is marked in red. If the price is going to get rejected, it should happen from this zone. However, if this zone is broken and price stabilizes above it, Bitcoin could turn bullish again.
Considering today is Monday, volumes are still low, and the price is near a strong order block | you should be careful with your positions.
For risk management, please don't forget stop loss and capital management
Comment if you have any questions
Thank You

Farcana double bottom
I’ve identified a potential double bottom forming after a significant downtrend. The second bottom aligns with a key demand zone, showing strong rejection wicks and increasing volume — a sign of buyers stepping in.

GBPNZD: Classic Pullback Trade 🇬🇧🇳🇿
GBPNZD may pull back from the underlined horizontal support.
As a confirmation, I see a rejection from that first,
and a formation of a bullish imbalance candle on 1H time frame then.
Goal - 2.244
❤️Please, support my work with like, thank you!❤️

US30 – Price at Key Decision Point 42,810US30 | Technical Analysis
🔺 Current Scenario:
The price is now testing the pivot line at 42,810.
A 4H candle close above this level may confirm a bullish continuation toward the resistance zone at 43,212–43,350, and possibly extend to 43,763.
🔻 Alternative Scenario:
If price fails to hold above 42,810 and drops back below, we could see a pullback toward 42,410, with further downside to 42,158 and 41,777 if that breaks.
Pivot Line: 42810
Resistance Zone: 43212, 43350, 43763
Support Levels: 42410, 42158, 41777

AVAX/USDTAVAX is currently in a consolidation phase.
The key area of interest is the liquidity zone around $20.14 combined with a daily FVG.
🎯 After a move into this zone, long setups can be considered — only if proper conditions are met.
Target to the upside: $21.49
📌 Waiting for confirmation before execution. No setup — no trade.

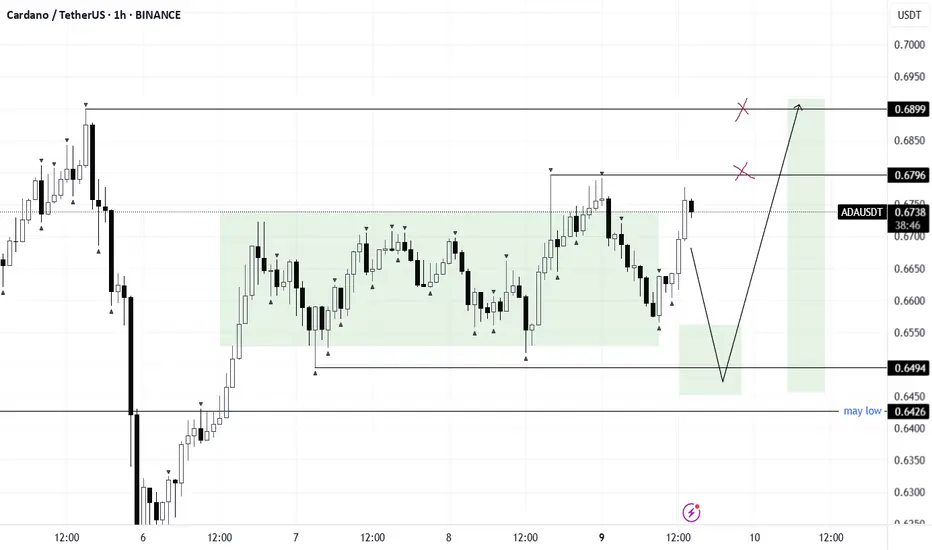
ADA/USDTADA is currently in a local consolidation phase.
After a liquidity grab/manipulation sweep, we can start watching for long opportunities.
🎯 Upside target: $0.68 – $0.69
📊 Waiting for confirmation post-manipulation to trigger entries. Patience is key — setup is forming.
USNAS100 – Bearish Bias Below 21780 Ahead of CPI and Trade TalksUSNAS100 – Bearish Pressure Below 21780, CPI & Trade Talks in Focus
Overview:
USNAS100 remains under downward pressure ahead of a key macro week, including US-China trade talks and the upcoming US CPI data.
Technically, price remains bearish while below the pivot level at 21780.
A break below 21635 may lead to further downside toward 21470 and potentially 21360.
On the upside, a 1H close above 21780 could invalidate the bearish view and open the path toward 21920 and the ATH at 22200.
Key Levels:
Pivot: 21780
Support: 21635, 21470, 21360
Resistance: 21920, 22200

Bitcoin — Breakout or Bull Trap? SFP Setup ExplainedAfter a clean drop that nearly tagged the psychological $100K level, Bitcoin printed a Swing Failure Pattern (SFP) — sweeping the lows and snapping back with strength. That bounce wasn’t just a reaction — it was a liquidity reclaim.
Now, price structure is shaping into a potential Inverted Head & Shoulders — a classic reversal pattern often forming before a bullish continuation.
🔍 Key Level to Watch:
$106,694.63 — This recent key high was just taken out. If we see rejection here (SFP), it could set up a high-probability low-risk short opportunity.
🎯 Short Trade Idea (Only on SFP confirmation):
Entry: After price sweeps $106,694.63 and shows rejection
Stop-Loss: Above wick high (e.g., ~$107.4K)
TP Zones: $103.5K and $101.7K
R:R: ~1:7
✅ Cleaner setup with confluence from structure and liquidity — high probability if confirmed.
📚 Educational Insight: Why SFPs Work So Well
SFPs (Swing Failure Patterns) are some of the most powerful setups in trading because they:
Trap breakout traders
Sweep liquidity and reverse quickly
Offer clear invalidation (wick high/low)
Allow for tight stop-loss and high R:R setups
Using SFPs in conjunction with key highs/lows, volume, and structure dramatically increases your edge.
📈 Why Order Flow Is Crucial for SFPs
1. See the Trap Form in Real Time
SFPs are essentially traps — price sweeps a key level, sucks in breakout traders, and then reverses. Order flow tools let you see this happen:
A spike in market buys above resistance
Followed by a lack of follow-through (no new buyers)
And then an aggressive absorption or reversal (selling pressure hits)
Without order flow, this is all hidden in the candles.
2. Confirm Liquidity Sweeps with Delta & CVD
Watch for a delta spike or Cumulative Volume Delta (CVD) divergence — a clear sign that aggressive buyers are getting absorbed.
This gives you confirmation that the sweep failed, not just a random wick.
3. Tight Entries with Confidence
When you see actual trapped volume or liquidation clusters at the SFP level, you can enter tighter with conviction — because you're not guessing, you’re reacting to actual intent and failure in the market.
4. Early Warning System for Reversal or Continuation
If the SFP fails to trigger a reversal (e.g. buyers step back in with strength), you’ll see it early in the flow — and can quickly reassess.
🧠 Bottom Line:
Order flow lets you stop guessing and start seeing the actual fight between buyers and sellers. Combine it with SFPs, and you're not just trading price — you're trading intent. That edge is huge.
_________________________________
💬 If you found this helpful, drop a like and comment!
Want breakdowns of other charts? Leave your requests below.

Bitcoin above the supportBitcoin back tested the important yellow resistance on weekly and closed a hammer candle above the pivot.
I wont be surprise to see $130k in couple of weeks.

NAS100 - Will the stock market reach its previous ATH!?The index is above the EMA200 and EMA50 on the 4-hour timeframe and is trading in the specified pattern. In case of a valid break of this range, I expect a new trend to form. It is better to wait for confirmation on the break in order to control further risk.
U.S. President Donald Trump announced that an American delegation will meet with Chinese representatives in London on June 9 to discuss a potential trade agreement. In a post on Truth Social, Trump stated, “I’m pleased to announce that Treasury Secretary Scott Bessent, Commerce Secretary Howard Lutnick, and U.S. Trade Representative Jamieson Greer will meet with Chinese officials on Monday, June 9, 2025, in London to discuss a trade deal.” He added that he expects the meeting to go “very well.” U.S. stock markets rose on Friday, and Chinese markets are now following suit. The Hang Seng Index has reached its highest level since March.
Meanwhile, Amazon has completely halted its hiring budget for office workers in its core retail business. This decision applies only to white-collar staff and excludes warehouse employees and those in its cloud computing division. According to Business Insider, which cited internal company emails, the hiring freeze affects Amazon’s online marketplace, logistics operations, and grocery business.
Having doubled its workforce between 2019 and 2021 to 1.6 million, Amazon reduced that number to 1.55 million last year. Since late 2022, the e-commerce giant has laid off at least 27,000 employees.
This move comes as the U.S. jobs report released Friday helped ease some concerns, though signs of broader economic challenges remain. Experts suggest that such a hiring freeze could reflect broader economic trends—where mass layoffs are avoided, but hiring slows down significantly.
In May, the U.S. economy added 139,000 jobs, down from 147,000 in April. The unemployment rate remained steady at 4.2%, staying within the narrow range it has held over the past year. The labor market has remained resilient, dismissing fears that tariffs would cause a significant slowdown. So far, tariff-related disruptions have not been severe enough to destabilize the job market—at least not in May.
Data indicates that employers continue to refrain from layoffs, even as hiring has slowed considerably compared to the post-pandemic surge. Labor market analysts expect signs of weakness to emerge in the coming months, as businesses become more cautious about hiring due to uncertainty surrounding tariffs—according to recent surveys. For now, however, the labor market remains strong.
The absence of red flags in employment may give the Federal Reserve more room to maintain its patient stance on interest rate cuts. This year, Fed officials have kept interest rates higher than average to curb inflation by increasing borrowing costs. The Fed’s dual mandate is to keep inflation low and employment high, and it may opt to cut rates to stimulate the economy if the labor market weakens.Fed Chair Jerome Powell and other FOMC members have said they are waiting to see whether President Trump’s trade wars will stoke inflation, trigger job losses, or both. So far, neither scenario has materialized. Strong labor market data may give them further justification to stay in wait-and-see mode. Rosner wrote, “Given the Fed’s sharp focus on inflation risk management, today’s stronger-than-expected jobs report is unlikely to alter its patient approach. We expect the Fed to remain on hold at this month’s meeting and believe further deterioration

ETH NEW UPDATE (4H)This analysis is an update of the analysis you see in the "Related publications" section
Inside the red zone from the previous analysis, there was also a SWAP zone that price reacted to. The pullback trendline has also been broken. After re-evaluating the chart, the best area for a potential re-entry is the $2,165 to $2,250 range.
Do not enter a position without a proper setup and risk management | you could easily become market maker bait.
A daily candle close above the invalidation level would invalidate this bearish scenario.
For risk management, please don't forget stop loss and capital management
Comment if you have any questions
Thank You

NOT / USD. Local trend. Reversal zones 08 06 2025Local work ("market noise") is not a breakout of the inverted head and shoulders resistance zone (yellow reversal level). A rollback back to the horizontal channel formation zone with a 100% step. Everything is as before, nothing new can happen, for clarity, I showed the % to the key local support/resistance levels.
NOT Main trend. Channel. 16 03 2025

BTC.D (Dominance at Critical Fibonacci Confluence) 2025 Weekly
**Summary:**
Bitcoin Dominance (BTC.D) is testing a major Fibonacci confluence near the 66% level. This zone historically acts as a major pivot and may signal either a continued dominance rally or a potential reversal setting the stage for altseason. We use three layered Fibonacci retracements to outline dominant trend zones, key resistances, and projected targets.
**Chart Context:**
This chart uses **three distinct Fibonacci retracements** to map the historical and projected behavior of BTC dominance:
1. **Primary Fib** (100% to 0%): Captures the macro move from BTC.D \~100% down to its 0% level at \~0%, which aligns with the first altseason (2018–2019).
2. **Secondary Fib** (100% to 38.88%): Maps the first bearish wave to identify potential recovery levels. BTC.D retraced up to the 61.8% (\~73.68%) but failed to break further.
3. **Third or the Current Fib** (73.68% to 38.88%): Maps the latest bearish fall in BTC.D. As of now, BTC.D is hovering at the 78.6% retracement level of this move, indicating heavy resistance.
**Key Technical Observations:**
* **1st TP (Resistance):** 66% — Strong Fibonacci confluence zone:
* Fib2 48.6% ≈ Fib3 78.6%
* Major reversal zone historically
* **2nd TP (Support):** 52.25% — Multi-Fib confluence:
* Fib1 48.6%, Fib2 61.8%, Fib3 38.2%
* **3rd TP (Ultimate Support):** 38.88% — Historical BTC.D bottom, aligned with the first altseason.
* Intermediate Fibonacci confluences between 48%–60% serve as layered support during decline phases.
**Indicators:**
* No external indicators used; pure multi-frame Fibonacci confluence.
* Price action structure and historical patterns highlight potential market rotation zones.
**Fundamental Context:**
The current phase of the market reflects increasing speculative activity in altcoins while Bitcoin consolidates. Historically, high BTC.D correlates with Bitcoin-led rallies, while a sharp drop often triggers altseason.
* Growing inflows into ETH, SOL, and possible now XRP, and mid-cap alts suggest capital rotation.
* If BTC.D faces rejection from 66%, the market could enter a new altseason phase.
* Macro tailwinds (e.g., easing monetary policy, risk-on sentiment) support altcoin performance in the medium term.
**Philosophical or Narrative View:**
BTC.D acts as a barometer of market risk preference. As confidence expands beyond Bitcoin, money flows into altcoins—like tributaries branching off the main river. The rejection from major confluences signals this psychological shift, marking phases of creative decentralization.
**Related Reference Charts:**
* TOTAL3 Fibonacci Setup (Altcoin market excluding BTC & ETH):
* TOTAL2 Correction Probabilities:
**Bias & Strategy Implication:**
* **Primary Bias:** Bearish rejection from 66% followed by correction to 52% and potentially 38.88%.
* **Alternative Scenario:** Brief breach above 66% before reversal.
* Traders may consider rotating into altcoin exposure if BTC.D confirms reversal at the confluence zone.
**Time Horizon:**
* Mid to Long Term (1–6 months outlook)
* Weekly timeframe tracking
**Notes & Disclaimers:**
* This analysis is for educational purposes. Market conditions may evolve rapidly.
* Use proper risk management when acting on dominance signals.

EURUSD: Support & Resistance Analysis For Next Week 🇪🇺🇺🇸
Here is my latest structure analysis
and important supports and resistances for EURUSD
for next week.
Consider these structures for pullback/breakout trading.
❤️Please, support my work with like, thank you!❤️
I am part of Trade Nation's Influencer program and receive a monthly fee for using their TradingView charts in my analysis.

UNI Sell/Short Setup (4H)The overall structure in UNI is bearish, considering the recent CH (Change of Character) observed in the swing.
The price is currently below the resistance line, and if it approaches the premium zone of the previous minor wave, we can look for sell/short positions based on UNI’s overall outlook. The zone where we are interested in entering a position is marked with a red circle.
The target can be the green box.
A daily candle close above the invalidation level would invalidate this analysis.
For risk management, please don't forget stop loss and capital management
When we reach the first target, save some profit and then change the stop to entry
Comment if you have any questions
Thank You

MORPHO Analysis (12H)After losing the trendline and forming a bearish CH (Change of Character), the price is now pulling back into the supply zones. A rejection from the red zone toward the green zone could lead to a drop.
A candle close above the invalidation level would invalidate this analysis.
For risk management, please don't forget stop loss and capital management
Comment if you have any questions
Thank You

FAR LOCAL ATH ——> LONGFarcana is showing early signs of a breakout from a prolonged accumulation phase, supported by rising volume and renewed interest in GameFi tokens. Price structure suggests growing bullish momentum, with strong buyer defense at recent lows.
