Gold liquidity run short setup Update 2This video is an update on the Gold setup that was posted on the 4/06/25
I cover the price action and discuss what I think will be occurring from this point onwards as
part of the original trading plan .
Pivot Points

BITCOIN REVERSAL INCOMING !!!! BUT WHEN????Currently we have seen a great move from 75k to new ATH 112k BUT now whole bullish momentum seems to be fading.
If we see charts, we clearly see ranges and recently Bitcoin has swept range high & reclaimed back into range, which indicates lose momentum. We may see BTC tapping 90K even 80'sK for next bullish move.
For all to maintain it's bullish momentum, Bitcoin have to stay above 74.5k and needs to break and hold above 109.5K.
Breaking below 74.5k would push BTC as low as 60-55k
STAY CAUTIOUS !!!!

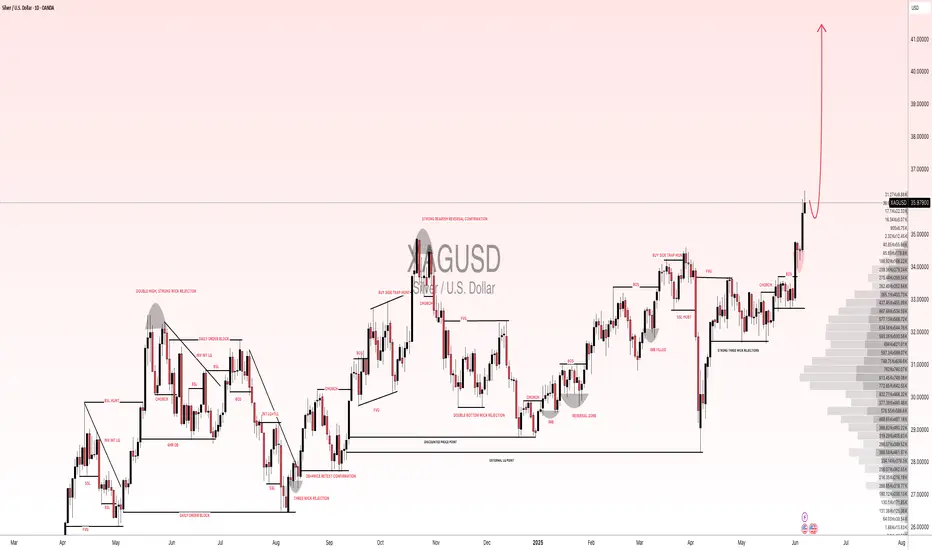
XAGUSD(SILVER):To $60 the silver is new gold, most undervaluedSilver has shown remarkable bullish behaviour and momentum, in contrast to gold’s recent decline. Despite recent news, silver remains bullish and unaffected by these developments. We anticipate that silver will reach a record high by the end of the year, potentially reaching $60.
There are compelling reasons why we believe silver will be more valuable in the coming years, if not months. Firstly, the current price of silver at 36.04 makes it the most cost-effective investment option compared to gold. This presents an attractive opportunity for retail traders, as gold may not be suitable for everyone due to its nature and price.
Silver’s price has increased from 28.47 to 36.25, indicating its potential to reach $60 in the near future. We strongly recommend conducting your own analysis before making any trading or investment decisions. Please note that this analysis is solely our opinion and does not guarantee the price or future prospects of silver.
We appreciate your positive feedback and comments, which encourage us to provide further analysis. Your continuous support over the years means a lot to us.
We wish you a pleasant weekend.
Best regards,
Team Setupsfx
BTC NEW UPDATE (4H)After dropping toward the 100K zone and sweeping the liquidity pool, Bitcoin has made a strong rebound to the upside, putting high-leverage short positions at risk. However, it is now approaching a supply zone that could potentially push the price back down toward the 98K area.
If the market maker intends to drive the price lower and trigger a bearish scenario, this is the zone to do it from. Let’s see what happens.
A daily candle close above the invalidation level ($107,000) would invalidate this analysis.
Let’s see how Bitcoin reacts to the red box.
For risk management, please don't forget stop loss and capital management
When we reach the first target, save some profit and then change the stop to entry
Comment if you have any questions
Thank You

Nifty Analysis EOD – June 6, 2025 – Friday🟢 Nifty Analysis EOD – June 6, 2025 – Friday 🔴
🎯 25K Now, What's Next?
Nifty opened on a neutral tone, cautiously awaiting the outcome of the RBI Monetary Policy. As the event unfolded and the repo rate cut of 0.5% was announced, the celebration began on Dalal Street—and the charts reflected it.
What followed was a clean, powerful rally, breaking through key levels and carrying the index all the way to the psychological milestone of 25,000, where it closed almost flat on the round number at 25,003.05.
Today’s close is just shy of the May 26th high, and a few hurdles still remain:👉 25,060–25,070👉 25,115–25,130👉 25,180–25,212
These levels will decide whether the breakout from the box range—which we’ve discussed in earlier reviews—truly sustains. As long as there’s no negative trigger over the weekend, bulls may carry the momentum into next week.
🛡 5 Min Chart with Levels
🕯 Daily Time Frame Chart
🕯 Daily Candle Breakdown
Open: 24,748.70
High: 25,029.50
Low: 24,671.45
Close: 25,003.05
Net Change: +252.15 (+1.02%)
📊 Candle Structure Breakdown
Real Body: 254.35 pts (Strong Green)
Upper Wick: 26.45 pts
Lower Wick: 77.25 pts
🔍 Interpretation
A session that began quietly turned into a bullish sprint.
The small upper wick shows there was minimal rejection at higher levels.
The lower wick reflects early dip buying.
The strong green body signals dominant intraday momentum, with bulls in charge from start to finish.
🔦 Candle Type
🟢 Bullish Marubozu–like candle– Almost a full body with small wicks, indicating powerful follow-through buying and confidence among bulls.
📌 Key Insight
25,000 breakout looks clean and technically sound.
Holding above 24,900–24,950 in the coming session could lead to further upside exploration.
All eyes on volume confirmation and whether we can conquer the next resistance band near 25,130+.
🛡 5 Min Intraday Chart
⚔️ Gladiator Strategy Update
ATR: 274.31
IB Range: 91.90 → Medium IB
Market Structure: Balanced
Trades:✅ 10:05 AM – Long Triggered → Target Achieved (1:1.4)✅ 10:40 AM – Long Triggered → Target Achieved (1:2)
📌 Support & Resistance Zones
Resistance Levels
25,062 ~ 25,070
25,116 ~ 25,128
25,180 ~ 25,212
Support Levels
24,972
24,920 ~ 24,894
24,800 ~ 24,768
24,727 ~ 24,737
24,660
💭 Final Thoughts
Momentum is back.Bulls not only broke free from consolidation—they made a statement. The RBI’s surprise move might just be the fuel Nifty needed to launch toward unexplored zones.
📌 “Big breakouts don’t ask for permission. They just happen—when doubt is highest.”
✏️ Disclaimer
This is just my personal viewpoint. Always consult your financial advisor before taking any action.

Imperial Brands Stock Quote | Chart & Forecast SummaryKey Indicators On Trade Set Up In General
1. Push Set Up
2. Range Set up
3. Break & Retest Set Up
Notes On Session
# Imperial Brands Stock Quote
- Double Formation
* (Box Thinking Bias)) - *A+ | Completed Survey
* (Uptrend Argument)) - *2nd Entry Area | Subdivision 1
- Triple Formation
* (P1)) / (P2)) & (P3)) | Subdivision 2
* (TP1) | Subdivision 3
* Daily Time Frame | Trend Settings Condition
- (Hypothesis On Entry Bias)) | Indexed To 100
- Position On A 1.5RR
* Stop Loss At 142.00 GBP
* Entry At 160.00 GBP
* Take Profit At 183.00 GBP
* (Uptrend Argument)) & No Pattern Confirmation
* Ongoing Entry & (Neutral Area))
Active Sessions On Relevant Range & Elemented Probabilities;
European-Session(Upwards) - East Coast-Session(Downwards) - Asian-Session(Ranging)
Conclusion | Trade Plan Execution & Risk Management On Demand;
Overall Consensus | Buy

SILVER (XAGUSD): Where is the Next Resistance?!
What a rally on Silver this week.
The market easily violated a resistance cluster
based on the last year high.
Analyzing a historic price action, the next strong resistance
that I found is around 37.4
It is based on an important high of 2012.
That can be the next mid-term goal for the buyers.
❤️Please, support my work with like, thank you!❤️

Bank Nifty Weekly Insights: Key Levels & TrendsBank Nifty ended the week at 56,578.40 with a gain of 1.49%
Key Levels for the Upcoming Week
🔹 Price Action Pivot Zone:
The critical range to monitor for potential trend reversals or continuation is 56,706 to 56,469
🔹 Support & Resistance Levels:
Support Levels:
S1: 56,113
S2: 55,639
S3: 55,053
Resistance Levels:
R1: 57,065
R2: 57,543
R3: 58,133
Market Outlook
✅ Bullish Scenario: A sustained move above 56,706 could trigger buying momentum, potentially driving Bank Nifty towards R1 (57,065) and beyond.
❌ Bearish Scenario: If the index falls below 56,469, selling pressure may increase, pulling it towards S1 (56,113) and lower levels.
Disclaimer: lnkd.in

Nifty 50 at a Turning Point? Key Levels & Market Outlook AheadThe Nifty 50 ended the week at 25,003.30 with a gain of (1.02%)
If Nifty sustains below 24,924, selling pressure may increase. However, a move above 25,283 could restore bullish momentum.
Key Levels for the Upcoming Week
🔹 Price Action Pivot Zone:
The crucial range to watch for potential trend reversals or continuation is 24,924 -25,083.
🔹 Support & Resistance Levels:
Support:
S1: 24,689
S2: 24,375
S3: 23,987
Resistance:
R1: 25,321
R2: 25,639
R3: 26,032
Market Outlook
✅ Bullish Scenario: A sustained breakout above 25,083 could attract buying momentum, driving Nifty towards R1 (25,321) and beyond.
❌ Bearish Scenario: A drop below 24,924 may trigger selling pressure, pushing Nifty towards S1 (24,686) or lower.
Disclaimer: lnkd.in

Tesla Update Longs and shorts At the start of the video I recap my previous video and then bring us up to date with the present price action .
In this video I cover Tesla from the higher time frame and breakdown both a long term bullish scenario as well as a local bearish scenario .
Both of these scenarios present longs and short entries for day trade opportunities and swing positions .
Tools used Fibs , TR pocket , Volume profile , Pivots , and vwap .
Any questions ask in the comments
Safe trading and Good luck

Ethereum & June's pivot supportEthereum price is now playing below the 200 daily MA, but the price about 2350 is the pivot and holding as a support, and I'm expecting to see upside movement in the coming days to about 3400 which is the resistance 2 for the pivot.

$UVXY target still +$100, different path to get thereWe've seen an incredibly large rally in stocks, which has taken UVXY lower than I expected, but as long as we bounce at support here, the idea is still valid.
The support on the chart is retesting the move that we broke out from end of March. There was a lack of balance on the chart as we saw a 130% move over a 5 day period. So we're going back to retest that region.
I think once we retest the region we broke out from, we'll base for a few days and then start the last leg higher. I think this is going to be the biggest move yet and this move will get us to break the lows in SPY. I'm looking for $437-441 to mark the low in the market with an extreme low at $400.
I think VIX will see new highs and UVXY will go to $100+ with the resistance targets on the chart.
Not sure what the catalyst will end up being for this one, but all of the positive news around tariffs seem to be priced in after today.
Most of my UVXY options are stacked from 6/6-6/20 as I think we'll see this move play out by then.
Let's see what happens.

$VIX target $88-103TVC:VIX looks to be bottoming here and I think the next move higher is going to be the big one I've been waiting for.
We did well last month catching that move into April 7th via UVXY calls. I started buying calls again April 24th for 5/30 - 6/20 and have continued buying as VIX has declined.
Now the chart is finally looking like it's bottoming and I'm getting short signals on a lot of the charts -- therefore my conviction is growing that we're close to a reversal here.
I think this move will be a move that happens once every 10+ years and the gains have the potential to be massive if it happens.
Let's see if it plays out.

$SPY bearish, to break April lows?Most people are thinking that we'll see a correction that goes back to the $560 area and then from there, we'll go to new highs. They also don't think it's likely that we'll retest the lows from April and think it's nearly impossible that we'll break the lows.
However, my base case is that we will break the lows. Yes, in the past, most dips like the one in April were good buying opportunities, but the chart looks different here.
You can see that ever since April, all we've done is consolidate up into a rising wedge.
We look set to break down from that in the coming days. If we do break down and are unable to reclaim the highs, then I think my base case will become the highest probability outcome.
I think it's likely that the move down will take us to the $424- 402 levels. Let's see what happens.

M6E1! Possible BuyThe Euro/USD future are currently in a bullish market structure and a possible buy opportunity in place after the pullback down .
Good LUck

Bretton Woods 2.0?Examining the long-term trend of TVC:DXY since the 1980s, we might be facing a staggering 40% reduction in valuation, potentially landing us around 60. If the US were to devalue the dollar this drastically, could it effectively erase the national debt? 🤔 Is Trump bold enough to consider such a move?
We know the FED is going to cut eventually, the question is when and by how much? Initial claims came in higher than estimated, with cracks beginning to show in the labor market, how much longer can JPow hold out?

US-China Talk Drops Gold Short; Short StrategyToday, Trump announced that China and the U.S. participated in a telephone exchange 🔊! After the market learned this, optimistic sentiment surged rapidly, causing U.S. stock futures to rise sharply in the short term 📈. As a result, spot gold turned lower in the short term ↓. The current situation favors short positions:
Short at current price 📉: Initiate a small short position near 3350 👌, set a unified stop loss above 3360 ⚠️, and target key support levels at 3325-3320 🎯.
Add to shorts on rebound ↕️: If the price rebounds to the 3350-3360 range, increase the short position 📊, maintaining the same target 🎯.
Chase shorts on breakdown 💥: If the price breaks below 3320 support, chase the short trend with a stop loss at 3330 ⚠️, targeting the psychological level of 3300 🧠.
Risk reminder ⚠️: Monitor U.S. stock futures and follow-up developments in U.S.-China relations closely 👀, and be wary of volatility caused by a reversal in market sentiment 🚦. Keep position sizes within 10% ⚖️ and strictly adhere to stop losses ⛔.
Gold Trading Strategies
sell@3350-3355
tp:3325-3320
sell@3315-3320
tp:3305-3300
Professional trading strategies are pushed daily 📊
Lock in precise signals amid market fluctuations 🚀
Confused about market trends? Stuck in strategy bottlenecks?
Real-time strategies serve as your "trading compass" 🌐
From trend analysis to entry/exit points, dissect market logic comprehensively
Refer now 📲
Help you move steadily forward in investments ✨
👇👇👇

Gold Liquidity run Short Setup Update This video is an update on the Gold setup that was posted on the 4/06/25
I cover the price action and discuss what I think will be occurring from this point onwards as
part of the original trading plan .

Nifty Analysis EOD – June 5, 2025 – Thursday🟢 Nifty Analysis EOD – June 5, 2025 – Thursday 🔴
🎭 Trap and Manipulation on Expiry Day
As discussed in yesterday’s note—a calm before the storm—today delivered the volatility, but not in the form anyone truly expected. Nifty opened with a 53-point gap-up, filled the gap in the first 5 minutes, and then marched upwards to hit a day high of 24,761.
But that wasn't the end…
Within just 20 minutes, Nifty spiked to 24,899—a sharp and unexpected move that defied recent technical context. Why?Because just two sessions ago (June 3), the 24,800 level was a clear rejection zone, yet today the price cut through that zone like butter, crossing the highs of the past 6 sessions—only to fall just as sharply.
📉 That’s not strength—it’s classic expiry day manipulation.
The past 16 sessions have shown candles with unusual shadows, and today added another one to the list. For swing traders, this market structure has been offering no clean entry triggers. The message is loud and clear: focus only on intraday setups and stay cautious.
🛡 5 Min Chart with Levels
🕯 Daily Time Frame Chart
🕯 Daily Candle Breakdown
Open: 24,691.20
High: 24,899.85
Low: 24,613.10
Close: 24,750.90
Net Change: +130.70 (+0.53%)
📊 Candle Structure Breakdown
Real Body: 59.70 pts (Green)
Upper Wick: 148.95 pts
Lower Wick: 78.10 pts
🔍 InterpretationThe candle paints a story of early optimism followed by profit booking or supply absorption near 24,900. Though the day closed green, the long upper shadow shows sellers dominating higher levels, leaving buyers with little to celebrate by the close.
🔦 Candle Type
🟢 Green Spinning Top with Long Upper Wick
Indicates indecision, with a bullish undertone that lacks conviction at higher levels.
📌 Key Insight
24,900 remains a psychological and technical barrier.
A bullish close above 24,900 might invite momentum traders, but until then—suspicion stays.
A breakdown below 24,600 may trigger downside interest again.
🛡 5 Min Intraday Chart
⚔️ Gladiator Strategy Update
ATR: 265.01
IB Range: 148.4 → Medium IB
Market Structure: imBalanced
Trades:✅ 11:00 AM – Long Triggered → Target Achieved (1:1.5)✅ 11:50 AM – Long Triggered → Trailing SL Hit, but Target Achieved (1:4.8)
📌 Support & Resistance Zones
Resistance Levels
24,768 ~ 24,800
24,820
24,882
24,894 (Strong Resistance)
Support Levels
24,727 ~ 24,737
24,660
24,625 ~ 24,640
24,600
24,530 ~ 24,480
24,460
💭 Final Thoughts
A day of deception more than direction.This expiry session was less about trend and more about clearing premiums, trapping both sides, and faking strength in the middle of a boxed consolidation.
📌 “Not every green candle is bullish. Some are just well-disguised traps.”
✏️ Disclaimer
This is just my personal viewpoint. Always consult your financial advisor before taking any action.

BTC Dominance New Update (12H)We are truly at a critical point for Bitcoin dominance.
It’s possible that the main drop in Bitcoin dominance has already begun. If the green zone is lost, dominance could experience a deep decline, especially since the final wave of this diametric pattern | wave G | has touched the 0.618 Fibonacci level.
That said, there’s still a chance that the green zone might once again push the price near the previous high before we witness the drop in dominance. However, there are also signs suggesting that the main drop may have already started. Follow the chart closely and monitor it with precision.
For risk management, please don't forget stop loss and capital management
Comment if you have any questions
Thank You

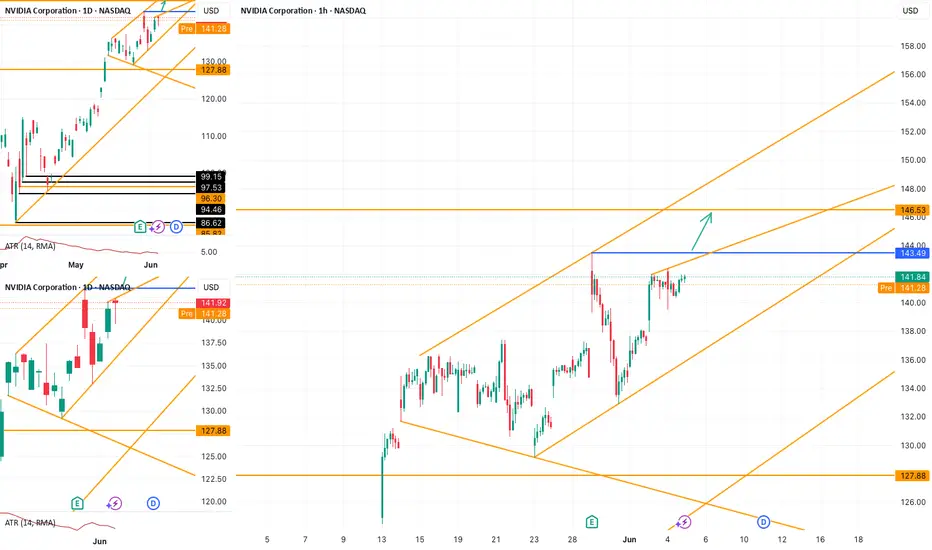
NVDA Setup: Clean Path to 146.53 If 143.49 Gives WayNASDAQ:NVDA continues to move within a rising channel. On the 1H chart, no major trendline currently limits further upside. If price breaks above the key swing high at 143.49 , the next potential target lies around 146.53 .
GOLD – Bullish Momentum Builds Above 3347, Watch 3366 Break#GOLD | Technical Analysis
The price is currently moving around the pivot level at 3347, which is the key to determining the next direction.
Bullish Scenario:
As long as it stabilizes above 3347, and especially breaks 3366, we expect the bullish momentum to continue toward the resistance at 3404, with potential to test 3431 and the key resistance at 3483.
Bearish Scenario:
If the price breaks below 3347, it may lead to a correction down to 3329, and if this level fails, the move could extend toward the support zone around 3265–3245.
Resistance: 3366, 3404, 3431
Support: 3329, 3265, 3245

GOLD Ready to Explode? Breaking ATH Resistance – 3800 Next?!Gold is heating up! 🔥 Price just broke the daily resistance trendline and is now testing the top of the range 👀
📈 A confirmed breakout could send us flying to 3523, 3628, and even 3800+ USD!
💡 Watch for strong bullish momentum above ATH resistance.
📊 Targets marked – Risk/Reward is 🔥
💬 What’s your bias – breakout or fakeout? Drop your thoughts below!
#Gold #XAUUSD #Breakout #TradingView #PriceAction #SmartMoney #TrendlineBreak
