XAU/USD ShortSimple setup.
Gold has performed exceptionally, but faces a likely correction due to an imminent flip from risk-off to risk-on.
Go risk-on while you're still relatively early!
Pivot Points

PEPE at Key Reversal Zone — Support Test Coming Soon?Today I want to look at the PEPE token ( BINANCE:PEPEUSDT ), which is part of the memecoin category, and provide you with a short-term analysis on the 1-hour timeframe .
PEPE token is trading in Potential Reversal Zone(PRZ) .
In terms of Elliott wave theory , the PEPE token appears to be completing the microwave 5 of the main wave C . The structure is a Zigzag Correction(ABC/5-3-5) .
Also, we can see the Regular Divergence(RD-) between Consecutive Peaks .
I expect the PEPE token to attack the Support zone($0.0000120-$0.0000108) after completing the main wave C .
Note: Stop Loss = $0.0000362
Please respect each other's ideas and express them politely if you agree or disagree.
Pepe Analyze (PEPEUSDT), 1-hour time frame.
Be sure to follow the updated ideas.
Do not forget to put a Stop loss for your positions (For every position you want to open).
Please follow your strategy and updates; this is just my Idea, and I will gladly see your ideas in this post.
Please do not forget the ✅' like '✅ button 🙏😊 & Share it with your friends; thanks, and Trade safe.

TRUMPUSDT – Daily Technical AnalysisTRUMPUSDT – Daily Technical Analysis
The price has reached a key daily support level at $10, showing potential signs of a bullish reversal.
If the support holds, we may see a move toward the resistance area around $14, offering a decent upside opportunity.
In a more bearish scenario, the price could extend its correction to the $9 support zone, which may serve as a stronger foundation for the next upward impulse.
🟢 Key Support Levels: $10 (daily), $9 (secondary support)
🔴 Resistance Zone: $14
Stay tuned for more technical insights and updates.

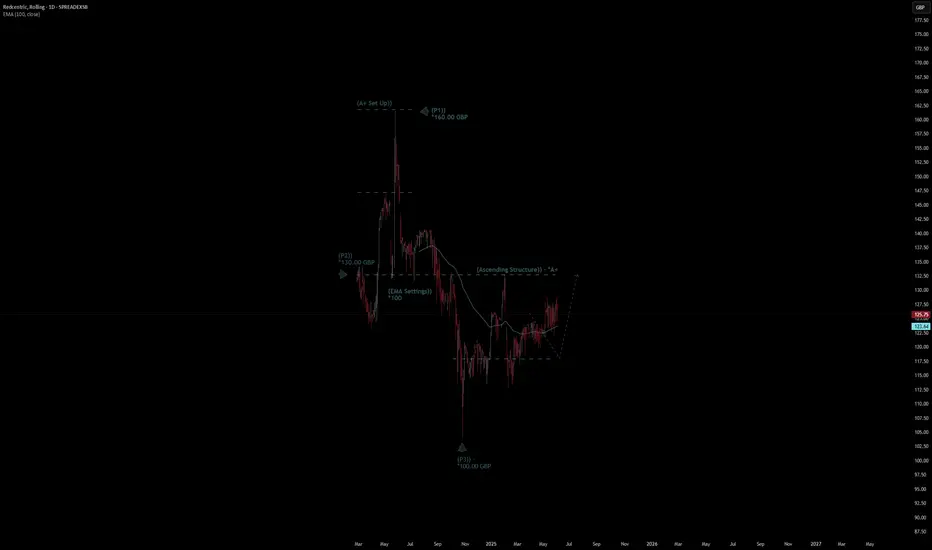
Redcentric Stock Quote | Chart & Forecast SummaryKey Indicators On Trade Set Up In General
1. Push Set Up
2. Range Set up
3. Break & Retest Set Up
Notes On Session
# Redcentric Stock Quote
- Double Formation
* (A+ Set Up)) - *Short Set Up & Entry | Completed Survey
* (Ascending Structure)) - *A+ | Subdivision 1
- Triple Formation
* (P1)) / (P2)) & (P3)) | Subdivision 2
* (TP1) | Subdivision 3
* Daily Time Frame | Trend Settings Condition
- (Hypothesis On Entry Bias)) | Regular Settings
- Position On A 1.5RR
* Stop Loss At 118.00 GBP
* Entry At 125.00 GBP
* Take Profit At 137.00 GBP
* (Uptrend Argument)) & No Pattern Confirmation
* Ongoing Entry & (Neutral Area))
Active Sessions On Relevant Range & Elemented Probabilities;
European-Session(Upwards) - East Coast-Session(Downwards) - Asian-Session(Ranging)
Conclusion | Trade Plan Execution & Risk Management On Demand;
Overall Consensus | Buy
Bitcoin at Decision Point: Next Move Will Shock You! (Must WatchBitcoin is trapped between two critical zones right now!
📈 If the upper zone breaks – the uptrend could restart!
📉 If we lose the lower support – the downtrend may continue!
This is a key moment for BTC – don’t miss what’s coming next!
🔥 Watch the full chart breakdown and see where Bitcoin is headed.
👉 Subscribe for real-time crypto updates!
🔔 Turn on notifications to never miss a move!
#Bitcoin #BTC #CryptoAnalysis #Altcoins #TradeWithMky

Fidelity China Stock Quote | Chart & Forecast SummaryKey Indicators On Trade Set Up In General
1. Push Set Up
2. Range Set up
3. Break & Retest Set Up
Notes On Session
# Fidelity China Stock Quote
- Double Formation
* (A+ Set Up)) - *Ranging Period | Completed Survey
* (Neutral Area)) - *A+ | Subdivision 1
- Triple Formation
* (P1)) / (P2)) & (P3)) | Subdivision 2
* (TP1) | Subdivision 3
* Daily Time Frame | Trend Settings Condition
- (Hypothesis On Entry Bias)) | Regular Settings
- Position On A 1.5RR
* Stop Loss At 237.00 GBP
* Entry At 255.00 GBP
* Take Profit At 278.00 GBP
* (Uptrend Argument)) & No Pattern Confirmation
* Ongoing Entry & (Neutral Area))
Active Sessions On Relevant Range & Elemented Probabilities;
European-Session(Upwards) - East Coast-Session(Downwards) - Asian-Session(Ranging)
Conclusion | Trade Plan Execution & Risk Management On Demand;
Overall Consensus | Buy

BTC FRACTAL : Has BTC been following THIS EXACT PATTERN?The only difference in terms of the first peak, is the duration. But even the pullback size has been similar:
Interestingly, in terms of the second peak, the increase from the corrective bottom to the new ATH is almost exact at 122%:
Here's why we MAY still have a small push upward:
- The previous time, the peak was at least 6% higher. Currently, that would put us around 116K.
- The current pennant pattern is different from the previous bearish flag.
2%:
Pattern:
Do you think the bearish cycle is starting, or is another push up likely?
___________________
BINANCE:BTCUSD

Hydrogenone Stock Quote | Chart & Forecast SummaryKey Indicators On Trade Set Up In General
1. Push Set Up
2. Range Set up
3. Break & Retest Set Up
Notes On Session
# Hydrogenone Stock Quote
- Double Formation
* (EMA Settings)) - *Upper Band Feature | Completed Survey
* (Downtrend Argument)) / 2nd Trade Set Up | Subdivision 1
- Triple Formation
* (P1)) / (P2)) & (P3)) | Subdivision 2
* (TP1) | Subdivision 3
* Daily Time Frame | Trend Settings Condition
- (Hypothesis On Entry Bias)) | Regular Settings
- Position On A 1.5RR
* Stop Loss At 37.00 GBP
* Entry At 26.00 GBP
* Take Profit At 11.00 GBP
* (Downtrend Argument)) & No Pattern Confirmation
* Ongoing Entry & (Neutral Area))
Active Sessions On Relevant Range & Elemented Probabilities;
European-Session(Upwards) - East Coast-Session(Downwards) - Asian-Session(Ranging)
Conclusion | Trade Plan Execution & Risk Management On Demand;
Overall Consensus | Sell

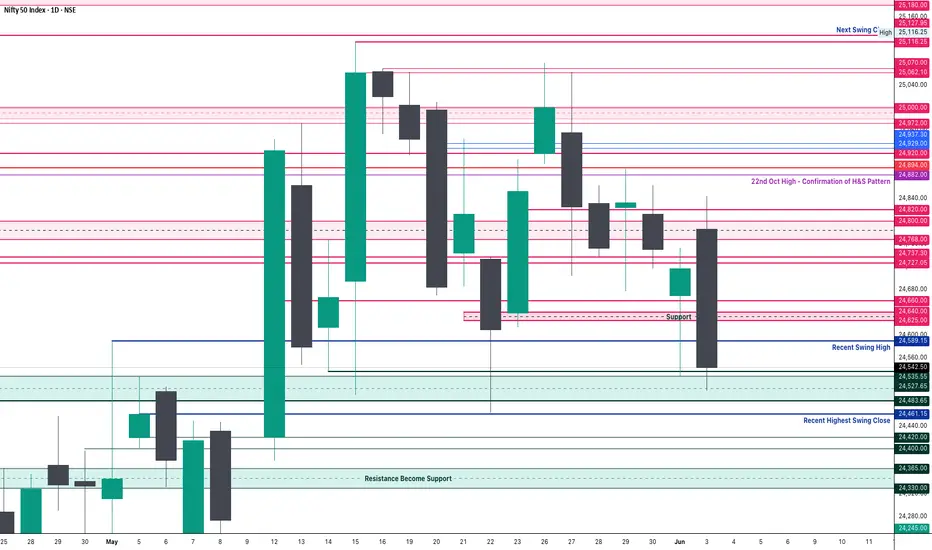
Nifty Analysis EOD – June 4, 2025 – Wednesday🟢 Nifty Analysis EOD – June 4, 2025 – Wednesday 🔴
A Pause with a Purpose: Calm Before the Storm?
Today’s Nifty price action was quiet and composed. The index opened with a mild 33-point gap-up, only to find resistance around the 24,600 mark—tested multiple times through the day. Eventually, it retraced to fill the gap, took support near the 24,500 zone, and spent most of the session within a tight initial balance of just 82 points.
A mid-session breakout attempt gave bulls a fleeting 30-point push, but the rally fizzled at the 24,625–24,640 resistance zone, and the index settled at 24,620.20, wrapping up the day in a 114-point range.
While the range was narrow, the price structure hints at a market in wait mode, possibly anticipating upcoming events or news flow. Patience is the key here.
🛡 5 Min Chart with Levels
📦 Bigger Picture: Still Trapped in the Box
This was the 14th session and 20th trading day stuck in a 653-point box range (24,462–25,116) formed since the 15th May breakout candle.
Nifty is now near the bottom of that range, and the 15th May Master Candle low of 24,494 is becoming crucial.
🔴 A close below that level could potentially unlock lower zones near 24,000 or even 23,800.
No need to pre-empt the move—let the market trigger, then respond.
🕯 Daily Time Frame Chart
🕯 Daily Candle Breakdown
Open: 24,560.45
High: 24,644.25
Low: 24,530.45
Close: 24,620.20
Net Change: +77.70 (+0.32%)
Candle Structure
Real Body: 59.75 pts (Green)
Upper Wick: 24.05 pts
Lower Wick: 30.00 pts
Interpretation
A quiet session with modest gains. The candle shows buyers stepping in after yesterday's sell-off, but the recovery lacked strength. The small body and limited wicks signal a day of balance—neither bulls nor bears fully in control.
Candle Type
🟩 Neutral Bullish Candle / Basic Continuation Bar
Indicates pause in selling pressure, but not yet a confirmation of bullish reversal.
Key Insight
A close above 24,645 is needed to validate any recovery attempt.
As long as 24,530–24,500 holds, short-term sentiment stays cautiously optimistic.
Tomorrow’s session will be crucial to set the tone.
🛡 5 Min Intraday Chart
⚔️ Gladiator Strategy Update
ATR: 262.59
IB Range: 82.3 → Small IB
Market Structure: Balanced
Trades:
❌ No trade triggered today
📌 Support & Resistance Zones
Resistance Levels
24,625 ~ 24,640
24,660
24,727 ~ 24,737
24,768 ~ 24,800
24,820
24,882
24,894 (Strong Resistance)
Support Levels
24,600
24,530 ~ 24,480
24,460
24,420 ~ 24,400
24,365 ~ 24,330
24,245 ~ 24,240
💭 Final Thoughts:
A day of controlled consolidation in a narrow range. While the broader market may look indecisive, this could be accumulation or energy build-up for the next big directional move. Stay observant—levels are speaking louder than volume right now.
📌 "When markets whisper, smart traders listen. The quiet days often precede the loudest moves."
✏️ Disclaimer
This is just my personal viewpoint. Always consult your financial advisor before taking any action.

US30 – Key Resistance at 42690 Ahead of ADP-Driven VolatilityUS30
The indices market is expected to be highly volatile today due to upcoming data releases, especially the ADP employment report.
Dow Jones (US30) appears to be continuing its bullish scenario toward 42690.
A break above 42690 may push the price further toward 42810, and if momentum holds, toward 43200.
However, stability below 42690 could trigger a strong correction toward 42460.
A sustained move below the pivot line at 42570 would shift the trend to bearish.
Resistance: 42690, 42810, 43200
Support: 42460, 42260, 42080

USNAS100 – Bullish Scenario Valid Above 21640, Targeting 21920USNAS100 | Technical Analysis
The price initiated a bullish trend after breaking above 21470, as previously mentioned. It is now continuing toward the target at 21770.
Currently, price is approaching the resistance at 21775.
If it fails to break above and stabilizes below 21775, we may see a consolidation within the range of 21775–21640.
🔺 A 1H close above 21775 may trigger a continued bullish move toward 21920 and 22100.
🔻 A 1H close below 21640 could lead to a correction down to 21475.
Resistance: 21775, 21920, 22100
Support: 21640, 21510, 21370
When and How to Use Weekly Time Frame in Gold Forex Trading
Ignoring weekly time frame chart analysis could cost you big losses in Forex, Gold trading!
Discover 3 specific cases when weekly time frame beats daily time frame analysis.
Learn the situations when weekly timeframe exposes what daily charts can’t, how to analyze it properly and when to check it.
1. Long-term historic levels
When the market trades in a strong bullish or bearish trend and goes beyond recent historic levels, quite often the daily time frame will not be sufficient for the identification of significant supports and resistances.
The proven way to identify the next meaningful levels will be to analyze a weekly time frame.
Examine a price action on EURAUD forex pair on a daily time frame chart. The market is trading in a strong bullish trend and just updated the high.
Checking the historic price action, we don't see any historic resistance on the left.
Switching to a weekly time frame chart, we can easily recognize a historic resistance that the price respected 5 years ago.
That's a perfect example when weekly t.f revealed a historic price action that a daily didn't.
2. Trend-lines
Weekly time frame analysis is important not only for a search of historic levels. It can help you find significant vertical structures - the trend lines.
We can easily find several meaningful historic resistances on EURUSD pair on a daily time frame.
Though, there are a lot of historic structures there, let's check if there are some hidden structures on a weekly.
Weekly time frame reveals 2 important trend lines, one being a vertical support and another being a vertical resistance.
With a daily time frame analysis, these trend lines would be missed .
3. More accurate breakout confirmations
Some false support and resistance breakouts that you see on a daily could be easily avoided with a weekly time frame analysis.
Quite regularly, a daily time frame support or resistance is in fact a weekly structure. And for its breakout, a weekly candle close will provide more accurate confirmation.
From a daily time frame perspective, we see a confirmed breakout - a daily candle close above a solid resistance zone.
It provides a strong bullish signal on AUDUSD forex pair.
However, the violation turned out to be false and dropped.
Such a false breakout , could be easily avoided, checking a weekly time frame chart.
The underlined resistance is in fact a weekly structure.
The price did not manage to close above, and perfectly respected that, starting to fall after its test.
Such a deeper analysis would completely change our bias from strong bullish (based solely on a daily) to strongly bearish (based on a daily AND weekly)
Remember This
Do not ignore and always check a weekly time frame.
It shows a unique perspective on the market and reveals a lot of hidden elements that you would not notice.
No matter whether you are a scalper, day trader or swing trader,
remember that weekly time frame structures are very impactful and accumulate large trading volumes.
❤️Please, support my work with like, thank you!❤️
I am part of Trade Nation's Influencer program and receive a monthly fee for using their TradingView charts in my analysis.

XAUUSD - Gold Awaits Employment Data!Gold is trading above the EMA200 and EMA50 on the 4-hour timeframe and is trading in its ascending channel. If gold corrects towards the demand range, it can be bought in the short term with appropriate risk-reward. A break of the resistance range will also pave the way for gold to rise to $3,400.
In April, the U.S. labor market demonstrated resilience and flexibility, with job openings climbing to 7.4 million—exceeding analysts’ expectations. Hiring reached its fastest pace since May 2024, as employers brought on 5.6 million new workers. While these upbeat figures surprised many, some economists remained cautious, warning that ongoing tariff policies could weigh on the labor market later this year.
Recent labor market data have featured unexpected results, mostly leaning positive. According to Tuesday’s report from the Bureau of Labor Statistics, job openings in April surpassed forecasts, rising from 7.2 million in March to 7.4 million.
Despite the encouraging nature of the data, the overall labor market picture has not shifted dramatically. Month-to-month fluctuations aside, the broader trend reflects a slowdown compared to the post-pandemic period when demand for workers was extremely high. Economists continue to expect that the uncertainty surrounding President Donald Trump’s tariff campaign will further hinder job creation in the months ahead.
Robert Frick, corporate economist at Navy Federal Credit Union, wrote in a commentary: “These figures still reflect a gradually slowing but stable job market. The jump in openings is more indicative of normal data volatility than a genuine surge in new positions. Likewise, the increase in hiring isn’t a strong recovery signal, as hiring remains within recent weak ranges.”
Alison Sriwastava, labor economist at the Indeed Hiring Lab, added: “The data show that U.S. employers had enough confidence to maintain more job openings in April than in March—whether through strong planning, resilient supply chains, or a bit of luck. But just because employers had a good month doesn’t mean they can sustain that success indefinitely, especially given the continued uncertainty and volatility.”
Meanwhile, the White House confirmed that it had sent letters to several countries asking them to submit their best trade offers by Wednesday. Progress on trade agreements since “Liberation Day” has been sluggish and challenging, and now all eyes are on what the Trump administration will do next.
Reuters obtained the letter, which asked countries to present their best proposals regarding tariffs, purchase quotas for U.S. goods, and plans to eliminate non-tariff barriers. However, according to the New York Post, immediate retaliation or action from the White House should not be assumed. Citing a source familiar with the matter, the letter’s purpose was described as an assessment of trade partners’ progress rather than a call for final offers.
In the diplomatic arena, newly appointed German Chancellor Friedrich Merz is set to meet with Donald Trump at the White House on Thursday following weeks of consultations. Key topics on the agenda include the war in Ukraine, Middle East crises, and trade policy. Merz, who recently took charge of Europe’s largest economy, has made rounds through major European capitals and now seeks to ease tensions with the Trump administration. The main areas of contention between Washington and Berlin involve trade imbalances, support for Ukraine, and domestic policy disputes.
This meeting presents a rare opportunity for Merz to voice his positions directly to Trump—unlike his predecessor, who never received a White House invitation.Nevertheless, Merz faces numerous challenges, ranging from far-right political pressures at home to clashes over tech companies on both sides of the Atlantic.
Meanwhile, President Donald Trump’s 50% tariffs on imported steel and aluminum officially took effect at 12:01 AM Eastern Time on Wednesday. These now-doubled tariffs apply to all trading partners except the United Kingdom. As the only country to have reached a preliminary trade deal with the U.S. so far, the U.K. will remain under a 25% tariff until at least July 9.
The executive order signed by Trump on Tuesday stated that the action is intended to “more effectively counter foreign nations that continue to sell excess and underpriced steel and aluminum in the U.S. market, undermining the competitiveness of America’s domestic steel and aluminum industries.”

FATCOIN – Eyeing Sub-$1 Accumulation
Liking what I’m seeing—early signs of weakness showing up at key levels across a number of alts.
This opens up the chance for a healthy market retrace before any continuation.
As for $FATCOINUSDT, I’m expecting sub-$1 levels over the next couple of weeks. That’s where I plan to accumulate a substantial position.
$FARTCOIN

SBM Offshore Stock Quote | Chart & Forecast SummaryKey Indicators On Trade Set Up In General
1. Push Set Up
2. Range Set up
3. Break & Retest Set Up
Notes On Session
# SBM Offshore Stock Quote
- Double Formation
* (A+ Set Up)) - *Entry & Long Support | Completed Survey
* 150 EMA - *Lower Band Feature | Subdivision 1
- Triple Formation
* (P1)) / (P2)) & (P3)) | Subdivision 2
* (TP1) | Subdivision 3
* Daily Time Frame | Trend Settings Condition
- (Hypothesis On Entry Bias)) | Indexed To 100
- Position On A 1.5RR
* Stop Loss At 157.00 EUR
* Entry At 170.00 EUR
* Take Profit At 186.00 EUR
* (Uptrend Argument)) & No Pattern Confirmation
* Ongoing Entry & (Neutral Area))
Active Sessions On Relevant Range & Elemented Probabilities;
European-Session(Upwards) - East Coast-Session(Downwards) - Asian-Session(Ranging)
Conclusion | Trade Plan Execution & Risk Management On Demand;
Overall Consensus | Buy

GBPNZD is in Selling DirectionHello Traders
In This Chart GBPNZD 4 HOURLY Forex Forecast By FOREX PLANET
today GBPNZD analysis 👆
🟢This Chart includes GBPNZD market update)
🟢What is The Next Opportunity on GBPNZD Market
🟢how to Enter to the Valid Entry With Assurance Profit
This CHART is For Trader's that Want to Improve Their Technical Analysis Skills and Their Trading By Understanding How To Analyze The Market Using Multiple Timeframes and Understanding The Bigger Picture on the Charts

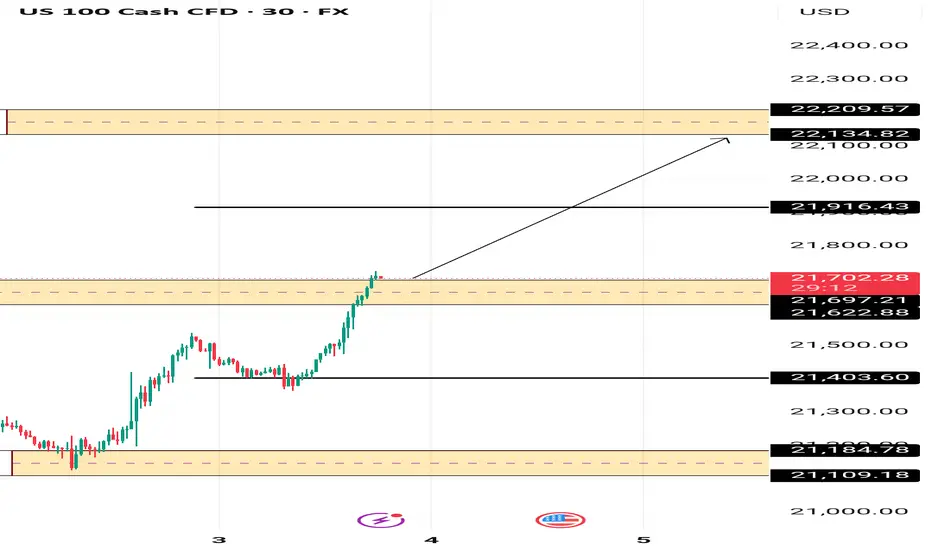
US100 BULLISH SCENARIOThe Nasdaq bullish sentimnent is gaining momentum with a good break our Pivot area between 21697 and 21622 .
A continuation of the current bull move expected if the pivot area holds with 21916 and 22134 targets .
"When Price Confirms The Vision" NAS100“Go peep my last NAS100 post 📌—I told y’all I wasn’t in the trade, but the lesson was clear. 💡
Price moved exactly how I expected, respecting my key levels and analysis to the pip.
This is why we trust the process, not just the profit. 🧠💰
Study the breakdown, learn the blueprint. The next one’s always around the corner.”
Currently Looking for 2nd Entry
#NAS100 #SmartMoney #InducementKing #MarketStructure #PriceAction #TradingView #JuicemannAnalysis**
Bless Trading!

Nifty Analysis EOD – June 3, 2025 – Tuesday🟢 Nifty Analysis EOD – June 3, 2025 – Tuesday 🔴
Opening Sentiment vs. Reality: A Day of Dual Personality
Nifty opened with a 70-point gap-up above the previous day’s high, carrying a positive vibe. In just one minute, it surged another 57 points, marking the day’s high at 24,845. However, that bullish momentum didn’t last. The index faced strong resistance, leading to a sharp 243-point drop within 15 minutes, breaching CPR and the previous swing low to hit the first Current Day Low (CDL) at 24,601.30.
Despite the jolt, Nifty showed resilience—bounced back from the 24,625–24,640 zone, recovered to VWAP, and even retested the PDH. Yet again, it failed to hold above 24,700, echoing the morning's rejection. A second wave of selling took Nifty to a fresh low of 24,502.15 mid-session.
The closing wasn’t any better. Nifty quietly slid again, retested the breakout zone, and closed at 24,542.50, nearly at the intraday low—a day that started with hope ended on a pessimistic note.
Interestingly, India VIX also dropped, despite the downward market move—signalling premium crush and a double whammy for option buyers who got the direction right but profits wrong.
🛡 5 Min Chart with Levels
📊 Daily Summary Highlights
✅ Gap-up Start but sharp reversal
📉 Both PDH and PDL tested intraday
📉 Marubozu Engulfing Candle
⚠️ Closed below Higher Swing Low – a potential trend-shift signal
🕯 Daily Time Frame Chart
🕯 Daily Time Frame Chart
🕯 Daily Candle Breakdown
Open: 24,786.30
High: 24,845.10
Low: 24,502.15
Close: 24,542.50
Net Change: −174.10 (−0.70%)
🕯 Candle Structure
Real Body: 243.80 pts (Big red candle)
Upper Wick: 58.80 pts
Lower Wick: 40.35 pts
Interpretation
A classic bearish reversal day. Price opened higher, reached a new high, but was aggressively sold off, closing near the day’s low. This large-bodied red candle with small wicks shows clear control by the bears.
Candle Type
🟥 Bearish Marubozu-like Candle
Strong rejection at highs
Bearish dominance confirmed
Lower close signals momentum continuation to the downside
Key Insight
24,845 now acts as a firm resistance.
Break below 24,500 could accelerate correction.
Bulls need to defend 24,500–24,520 zone decisively to avoid further weakness.
🛡 5 Min Intraday Chart
⚔️ Gladiator Strategy Update
ATR: 279.13
IB Range: 243.80 → Medium IB
Market Structure: Balanced
Trades:
🔻 12:50 PM – Short Triggered → 📍 1:1 Target Achieved, but timeout
📌 Support & Resistance Zones
Resistance Levels
24,600
24,625 ~ 24,640
24,660
24,727 ~ 24,737
24,768 ~ 24,800
24,820
24,882
24,894 (Strong Resistance)
Support Levels
24,530 ~ 24,480
24,460
24,420 ~ 24,400
24,365 ~ 24,330
24,245 ~ 24,240
💭 Final Thoughts
The market showcased a classic reversal and punished emotional entries. Despite the gap-up euphoria, technical levels reigned supreme. The break below swing low could signal caution for bulls in the coming sessions.
📌 "Respect the levels, not the emotions. Every bounce is not a bottom; every fall isn’t a crash."
✏️ Disclaimer
This is just my personal viewpoint. Always consult your financial advisor before taking any action.
Haleon, Rolling Stock Quote | Chart & Forecast SummaryKey Indicators On Trade Set Up In General
1. Push Set Up
2. Range Set up
3. Break & Retest Set Up
Notes On Session
# Haleon, Rolling Stock Quote
- Double Formation
* (Pennant Structure)) - *Entry & Long Support
# 150 EMA Settings Guide | Completed Survey
* (Neutral Area)) At 420.00 GBP | Subdivision 1
- Triple Formation
* (P1)) / (P2)) & (P3)) | Subdivision 2
* (TP1) | Subdivision 3
* Daily Time Frame | Trend Settings Condition
- (Hypothesis On Entry Bias)) | Regular Settings
- Position On A 1.5RR
* Stop Loss At 390.00 GBP
* Entry At 410.00 GBP
* Take Profit At 440.00 GBP
* (Uptrend Argument)) & Pattern Confirmation
- (Pennant Structure))
* Ongoing Entry & (Neutral Area))
Active Sessions On Relevant Range & Elemented Probabilities;
European-Session(Upwards) - East Coast-Session(Downwards) - Asian-Session(Ranging)
Conclusion | Trade Plan Execution & Risk Management On Demand;
Overall Consensus | Buy

EURUSD forming a LH swing turning pointThe EUR/USD is creating a lower high (LH) swing turning point before continuing it's upward move to 1.1600 where there is a strong order block.
What this means is that price might retrace down a little before going back up.
Note: Not a trading advice. Just my outlook.


ETH is still bearish (4H)This analysis is an update of the analysis you see in the "Related publications" section
Ethereum has now reached a support zone after sweeping the liquidity pool and the supply area at the top of the chart, as marked in the previous analysis. It has lost the trendline, and a slight upward recovery is expected before potentially being rejected again toward lower levels.
A daily candle closing above the invalidation level would invalidate this analysis.
For risk management, please don't forget stop loss and capital management
Comment if you have any questions
Thank You
