AUDCAD | HnS Pattern | 500pips DownPrice action has continued selling off after retesting the previous breakout below the neckline and will be looking to hit another 500pips+
When looking at local price action on lower timeframes the double top rejection at ~0.90 has entered a distribution phase which is signaling price to fall further with the first target at 0.88 and so on.
For price to hit the last target around 0.855 I would like to see a break first then a retest/distribution phase.
Pivot Points

Compass Group Stock Quote | Chart & Forecast SummaryKey Indicators On Trade Set Up In General
1. Push Set Up
2. Range Set up
3. Break & Retest Set Up
Notes On Session
# Compass Group Stock Quote
- Double Formation
* (A+ Set Up))
# Trend & Behaviour Mark - *Long Support | Completed Survey
* (Continuation Argument))
# Retracement Area - *0.5 Settings | Subdivision 1
- Triple Formation
* ((No Trade)) | Reversed Settings | Subdivision 2
* (TP1) | Subdivision 3
* Daily Time Frame | Trend Settings Condition
- (Hypothesis On Entry Bias)) | Indexed To 100
- Position On A 1.5RR
* Stop Loss At 114.00 GBP
* Entry At 120.00 GBP
* Take Profit At 130.00 GBP
* (Uptrend Argument)) & No Pattern Confirmation
* Ongoing Entry & (Neutral Area))
Active Sessions On Relevant Range & Elemented Probabilities;
European-Session(Upwards) - East Coast-Session(Downwards) - Asian-Session(Ranging)
Conclusion | Trade Plan Execution & Risk Management On Demand;
Overall Consensus | Buy

XAUUSD Possible Sell XAUUSD is heading to grab the upper internal liquidity before pulling back down again so a sell opportunity is in place and lower time confirmation is needed for entry . The current daily market structure is still bullish and this idea is counter trend .
Good LUck

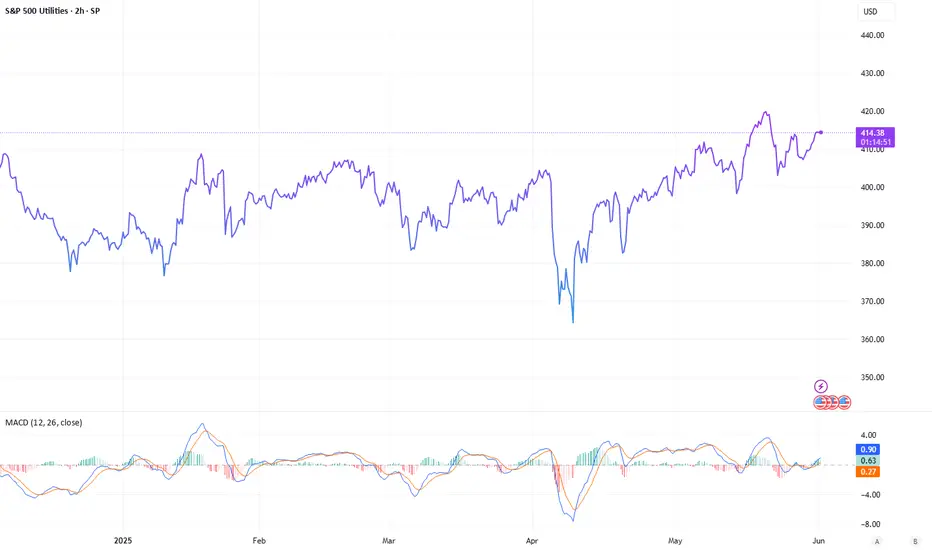
Utilities Shine in 2025: A Safe Haven with Growth PotentialIn a year marked by market turbulence, the utilities sector has emerged as a little beacon of stability. Outpacing a near-flat S&P 500 SP:SPX , the Morningstar US Utilities Index MSTAR:MUS has surged over 10% in 2025, all goes straight from its defensive allure and reliable dividends. As economic uncertainty-fueled by tariff concerns, inflation fears, and recession whispers-pushes capital away from riskier sectors, utilities are basking in newfound attention. But beyond their safe-haven status, structural shifts in energy demand and the global push for sustainability are positioning this sector for long-term growth. So, why exactly utilities are capturing focus and what lies ahead?
A Defensive Stronghold in Uncertain Times
Utilities have long been prized for their resilience, supplying essentials like electricity, water, and gas that remain in demand regardless of economic cycles. This stability, often backed by regulated revenue streams, makes them a go-to choice when markets waver. Today, as investors navigate geopolitical tensions and monetary policy shifts, utilities have become some kind of refuge. Morningstar notes a surge in capital inflows, though valuations are now 7% above median levels, hinting at near-term froth. Yet, the sector’s predictable cash flows and dividend yields-often ranging from 3% to 6%-continue to draw those seeking income and safety.
Powering the Future: Surging Electricity Demand
A key driver of the sector’s optimism is a renaissance in electricity demand, breaking years of stagnation. BloombergNEF projects U.S. data-center power needs will double to 78 gigawatts by 2035, fueled by the artificial intelligence boom. Meanwhile, the rise of electric vehicles and industrial electrification is amplifying consumption as economies transition from fossil fuels. This demand surge requires massive infrastructure investments, from transmission lines to new generation capacity. Utilities are ramping up capital expenditures, with 2024 seeing higher spending on data center support, electrification, and manufacturing onshoring, per Morningstar. These projects promise long-term profits through regulated rate hikes.
The Clean Energy Revolution
The global shift to clean energy NASDAQ:ICLN is reshaping utilities’ role too. Renewable sources like wind, solar, and hydroelectric power are gaining ground, with U.S. renewables outpacing coal generation for ten consecutive months through February 2025. Nuclear energy is also experiencing a revival, valued for its zero-emission baseload power, while natural gas serves as a bridge fuel. Water utilities, critical amid urbanization and climate-driven supply risks, are another growth frontier. Companies investing in green hydrogen, battery storage, and sustainable infrastructure are well-positioned to benefit from government incentives and consumer demand for eco-friendly solutions.
Navigating Challenges
Despite the rosy outlook, utilities face hurdles. Rising construction costs for new infrastructure-driven by supply, equipment, and labor constraints-could squeeze margins. Regulatory risks loom large, as utilities depend on approvals to recover capital investments through rate increases. If regulators deny or limit these requests, profitability could suffer. Additionally, higher interest rates on government debt might make utility dividends less attractive compared to bonds, though an anticipated rate-cutting cycle in 2025 could ease this pressure. These risks, while notable, are largely priced into current valuations, offering a balanced entry point for investors.
A Sector Poised for Stability and Growth
Nowadays, utilities are more than a defensive play-they’re a gateway to the energy transformation. With steady dividends, growing demand, and a pivotal role in the clean energy shift, the sector offers a compelling blend of safety and opportunity. We can clearly say, that AI, electrification, and sustainability reshape global energy needs, utilities stand ready to power up the future.
EURUSD: Trend in 4H time frameIt is currently in a very sensitive area,
Please pay special attention to the very accurate trend, channel, and colored levels.
Its a very sensitive setup, please be careful.
BEST,
MT

Nifty Analysis EOD – June 2, 2025 – Monday🟢 Nifty Analysis EOD – June 2, 2025 – Monday 🔴
“Relaxed day... if you forget the first and last 20 minutes!”
Nifty opened flat with a slightly negative tone and, within the first 20 minutes, collapsed over 200 points, hitting an intraday low of 24,526. However, the day had other plans. A slow and steady recovery followed, with Nifty reclaiming almost all its losses by mid-session. But just when things looked stable, the index shed 88 points in the final 20 minutes, eventually closing at 24,716.60, just 34 points lower than the previous close.
If you ignore the volatility of the first and last few minutes, the day felt calm—almost deceptive. Small and mid-cap stocks, along with Bank Nifty, saw a positive day, showcasing broad market strength despite Nifty’s indecisiveness.
🛡 5 Min Chart with Levels
📌 Diamond Pattern BreakoutAs discussed in yesterday’s note, the diamond pattern on the daily and 5-min chart finally saw a breakout today—and yes, the target was achieved. But let’s be real: with all the action packed into the opening move, most traders (including me) missed the train. A frustratingly textbook pattern—but a tricky execution.
🕯 Daily Time Frame Chart
📊 Daily Candle Breakdown
Open: 24,669.70
High: 24,754.40
Low: 24,526.15
Close: 24,716.60
Change: −34.10 (−0.14%)
Candle Structure:
🟩 Green Candle: Close > Open (46.90 pts body)
🔻 Lower Wick: 143.55 pts – Strong buying at the dip
🔺 Upper Wick: 37.80 pts – Limited rejection from top
Interpretation:Despite closing slightly lower, the candle reflects strong intraday buying after a deep dip. The long lower shadow shows support around 24,520–24,550 is active. Close near the top half signals buyers held their ground after early weakness.
Candle Type:🔨 Hammer-like: Bullish sentiment hidden in the chaos.
Key Insight:
Holding above 24,755 can trigger a fresh bullish leg.
Breach of 24,520 may invite more selling pressure.
🛡 5 Min Intraday Chart
⚔️ Gladiator Strategy Update
ATR: 272.03
IB Range: 191.40 → 🔴 Wide IB
Market Structure: ImBalanced
Total Trades: 0
12:35 – Long signal came, but entry didn’t trigger. No trades taken.
🧭 Support & Resistance Levels
📈 Resistance Zones:
24,727 ~ 24,737
24,768 ~ 24,800
24,820
24,882
24,894
24,920
24,972 ~ 25,000
25,062 ~ 25,070 (5th rejection!)
25,116 ~ 25,128
25,180 ~ 25,212
25,285 ~ 25,399
📉 Support Zones:
24,700
24,660
24,640 ~ 24,625
24,590
24,530 ~ 24,480
24,460
🧠 Final Thoughts
"Structure se hi samjho... market bhale chhup jaye, lekin footprint chhod deta hai."Diamond breakout ho gaya, lekin execution ne dhoka diya. Lesson? Stay ready—patterns repeat, but you only profit if you’re prepared.
✏️ DisclaimerThis is just my personal viewpoint. Always consult your financial advisor before taking any action.

Thor Exploration Stock Quote | Chart & Forecast SummaryKey Indicators On Trade Set Up In General
1. Push Set Up
2. Range Set up
3. Break & Retest Set Up
Notes On Session
# Thor Exploration Stock Quote
- Double Formation
* (P1)) - Long Support & Inverted Structure | Completed Survey
* (Box Thinking Bias)) On 0.5 Retracement Area
# Support & Resistance + Break Out | Subdivision 1
- Triple Formation
* (P1)) / (P2)) & (P3)) | Subdivision 2
* (TP1) | Subdivision 3
* Daily Time Frame | Trend Settings Condition
- (Hypothesis On Entry Bias)) | Regular Settings
- Position On A 1.5RR
* Stop Loss At 34.00 GBP
* Entry At 37.00 GBP
* Take Profit At 43.00 GBP
* (Uptrend Argument)) & No Pattern Confirmation
* Ongoing Entry & (Neutral Area))
Active Sessions On Relevant Range & Elemented Probabilities;
European-Session(Upwards) - East Coast-Session(Downwards) - Asian-Session(Ranging)
Conclusion | Trade Plan Execution & Risk Management On Demand;
Overall Consensus | Buy

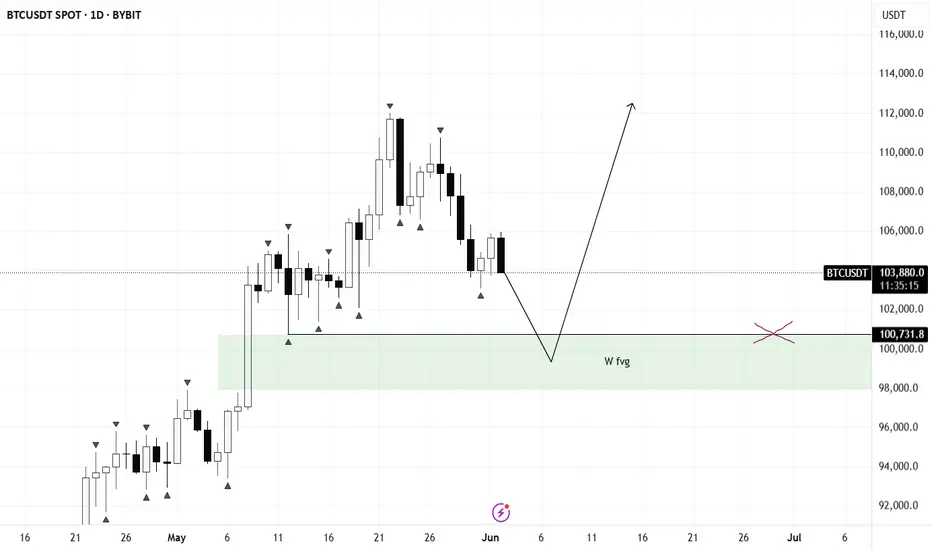
BTC/USDT🔔 New Month Kicks Off — Caution with Futures
I wouldn’t rush into aggressive futures trading right now.
Key long zones to watch:
• Liquidity sweep near 100,700
• Entry into the weekly FVG zone
That’s where I’ll be monitoring closely for potential position building.
🧠 The logic is simple:
For a solid entry point, the market needs to define the monthly and weekly lows.
This reduces the risk of getting chopped in volatility and offers a cleaner market structure.
☀️ Seasonal Context:
Summer is here — market dynamics shift.
Don’t expect explosive volatility; a prolonged sideways phase is on the table.
📉 If BTC sweeps the lows from current levels — we can consider a continuation of the long setup.
Otherwise, it’s best to wait for confirmation before entering.
Bitcoin on JUNE's Pivot, $103kI believe $103,300 ( June's Pivot ) will hold bitcoin, and in few days we see a rally to the upside, and by the end of June, Bitcoin will reach to $121,700 which is the 2nd resistance for the pivot.

GBPUSD SHORTCurrently in a supply zone whihc has remained unmitigated since Aug 22.
Waiting on 1h break of structure to the downside from current position. We have had a double top on the 4H chart as shown on image.
Once price action has broken structure to the downside on the 1H chart, I will look to take a short.
Depending on length of hold I will look first to target the demand marked around the 1.33 zone but there is potential to ride this all the way down to 1.28607 depending on the market.
Will be trailing my stop so that we can take as much of this as is possible within risk parameters.
TRADE - SHORT :
Entry TBC
SL : 1.35936
TP : 1.28607 (managed)

SMCI Trade Recap📈Getting ready to start a new swing trade on SMCI, and I’ve mapped out my game plan with a tiered entry strategy and clear profit targets.
Here’s how I’m setting it up:
Entry Levels (Scaling In):
$40.50 – First buy if it pulls back to this area. Looks like solid support, and I’ll test the waters here.
$35.80 – Adding more if it dips further. This level has acted as a strong bounce zone in the past.
$30.60 – Final entry if it gets down here. Oversold territory + psychological level = great risk/reward.
Profit Targets (Scaling Out):
$47.00 – First target to take some profits off the table.
$51.60 – Second target — likely to see some resistance here.
$60+ – Stretch target. If the momentum is strong, I’ll hold a portion with a trailing stop and let it ride.
Game Plan: I’m staying patient with entries, letting price come to me. The idea is to build the position gradually and reduce risk by scaling in. I’ll also be keeping an eye on volume and broader market sentiment — if the setup changes, I’ll adapt.
Let’s see how it plays out — risk-managed, calm mindset, and ready to pivot if needed. 🚀

Everybody loves Gold Part 2A good start to Gold Journey
In Part 2, we highlight a cluster of levels around close of Week 21. Price could however gap up or down and that will determine next moves.
At the moment though, we expected price to follow the arrow path for a down week.

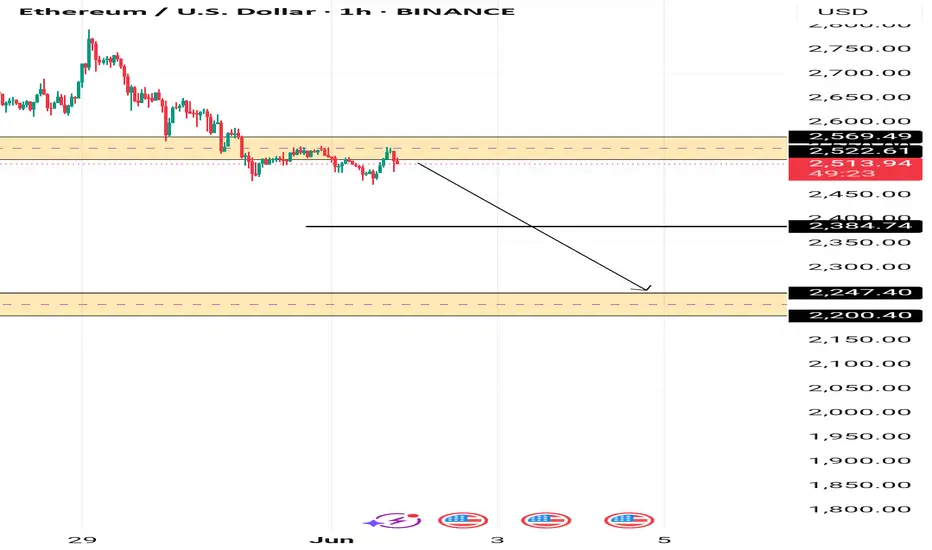
ETHERUEM PIVOT AREAETHEREUM is currently under our pivot area between 2522.21 and 2569.69. with bears in control for the moment.
If the price fails to break above this area we could see 2384 and 2247 as next targets
XUSDT Reversal Point - Buying OpportunityIn the upcoming week, starting from June 2nd, I anticipate a price drop to 0.00006388. This level could serve as a potential reversal point, but only if the price reaches it within the current week. Please note that this price level is valid only for one week; after that, the chart conditions and traders' behavior must be re-evaluated

British American Tobacco Stock Quote | Chart & Forecast SummaryKey Indicators On Trade Set Up In General
1. Push Set Up
2. Range Set up
3. Break & Retest Set Up
Notes On Session
# British American Tobacco Stock Quote
- Double Formation
* (Diagonal) - (P1)) - *90.00 GBP Long Support | Completed Survey
* (P2)) - *106.00 GBP | Subdivision 1
- Triple Formation
* 12345 Wave Feature & Lower Band Set Up | Subdivision 2
* (TP1) | Subdivision 3
* Daily Time Frame | Trend Settings Condition
- (Hypothesis On Entry Bias)) | Indexed To 100
- Position On A 1.5RR
* Stop Loss At 135.00 GBP
* Entry At 140.00 GBP
* Take Profit At 148.00 GBP
* (Uptrend Argument)) & No Pattern Confirmation
* Ongoing Entry & (Neutral Area))
Active Sessions On Relevant Range & Elemented Probabilities;
European-Session(Upwards) - East Coast-Session(Downwards) - Asian-Session(Ranging)
Conclusion | Trade Plan Execution & Risk Management On Demand;
Overall Consensus | Buy

De la Rue Stock Quote | Chart & Forecast SummaryKey Indicators On Trade Set Up In General
1. Push Set Up
2. Range Set up
3. Break & Retest Set Up
Notes On Session
# De la Rue Stock Quote
- Double Formation
* (Diagonal) - *77.00 GBP - Uptrend Bias On Entry Support | Completed Survey
* (P1)) - *100.00 GBP - *Retest Area | Subdivision 1
- Triple Formation
* 50 EMA - *Upper & Lower Band | Subdivision 2
* (TP1) | Subdivision 3
* Daily Time Frame | Trend Settings Condition
- (Hypothesis On Entry Bias)) | Regular Settings
- Position On A 1.5RR
* Stop Loss At 123.00 GBP
* Entry At 128.00 GBP
* Take Profit At 137.00 GBP
* (Uptrend Argument)) & No Pattern Confirmation
* Ongoing Entry & (Neutral Area))
Active Sessions On Relevant Range & Elemented Probabilities;
European-Session(Upwards) - East Coast-Session(Downwards) - Asian-Session(Ranging)
Conclusion | Trade Plan Execution & Risk Management On Demand;
Overall Consensus | Buy

TSLA (Daily) Elliot Wave 3 UnderwayTSLA appears to still be printing a motif wave 3 after finding a bottom at the $208 high volume support node. Fib extension targets suggest we have much higher to go including a new all time high.
Upside resistance target sits just below $413 in the HVN.
Downside targets may test the previous swing high $284
Safe trading

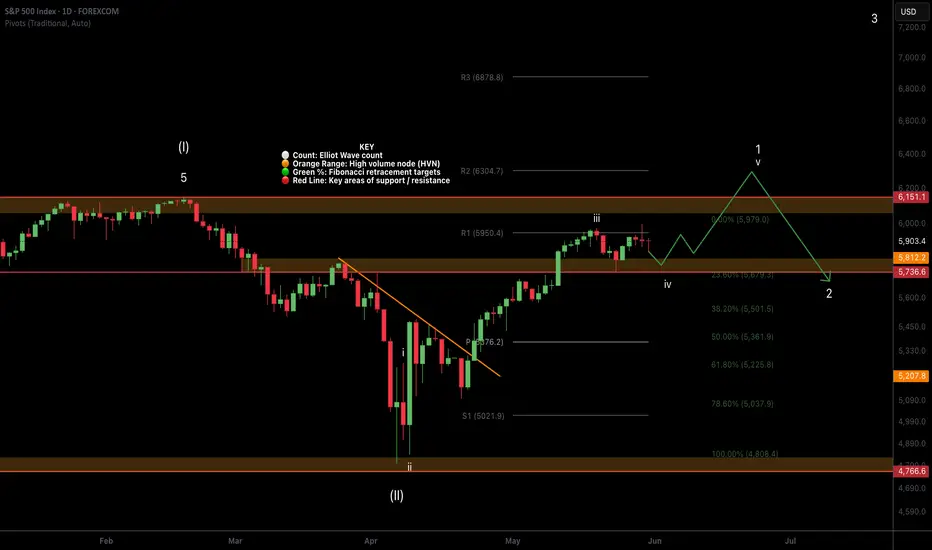
SPX500 (Daily) Elliot wave 4 underwaySPX appears to be printing a wave 4, potentially a triangle giving the proximity to the all the time high. Triangles are a motif wave ending pattern with a thrust up afterwards, typically a poke above the previous all time high before retracing trapping retail with FOMO.
Wave 2 is expected to retrace to the bottom of the triangle / wave 4 currently the high volume node support and .236 Fibonacci retracement at $5680
Safe trading
ETH (Daily) Holding up significantly wellETH is holding up its motif wave 1 rally significantly appearing to have completed an ending diagonal for wave 5 after finding a bottom at the major support high volume node (HVN).
Wave 2 is expected to retrace to the S1 pivot, 61.8 Fibonacci retracement and HVN at $1930 but may be front run at the daily pivot and wave 4 bottom $2300.
Safe trading

BTC (Daily) Elliot Wave 2 UnderwayBTC appears to have completed a motif wave (1) poking above all time high after printing a triangle for wave 4. Triangles are an ending pattern with a final thrust up afterwards typically breaking all time highs before reversing in wave 2, selling into retail FOMO.
Wave 2 has a $92k target at 0.5 Fibonacci retracement and high volume support node.
Wave 3 should be a powerful move up taking price way into all time high.
Safe trading

XRP (Daily) Complex Correction WXYXZXRP appears to have a complex correction underway with a series of ABCs in a descending channel after reaching all time high.
Price is just above the 61.8 Fibonacci retracement and high volume support node which is likely to test at $1.95.
Analysis is invalidated if price breaks above wave X swing high.
Ultimately it is trapped in a large range.
Safe trading

SUI (Daily) Elliot wave ii underwaySUI appears to have completed a motif wave (1) with an ending diagonal after finding a bottom at the major support high volume node (HVN) macro wave 4.
Wave 2 has not retraced as deep as other alt coins showing strength in the move up. The downside target is the HVN it has just tested at the 0.382 Fibonacci Retracement $2.95.
Wave 3 should be a powerful move up taking price into all time high.
Failure to hold this support could see price heading back to fresh lows and testing the $1.6 HVN once more.
Safe trading

Fet (Daily) Elliot Wave ii underway after ending diagonalFetch appears to have completed a motif wave (1) with an ending diagonal after finding a bottom at the major support high volume node (HVN) macro wave 4.
Wave 2 has not retraced as deep as other alt coins showing strength in the move up. The downside target is just above the wave (1) swing high, the 0.618 Fibonacci Retracement.
Wave 3 should be a powerful move up taking price into all time high.
Failure to hold this support could see price heading back to fresh lows and testing the $0.35 HVN once more.
Safe trading
