Gold (XAUUSD) Analysis – 4-Hour TimeframeGold (XAUUSD) Analysis – 4-Hour Timeframe
Currently, the price is moving in an upward trend and approaching a key resistance area. Recent volatility suggests that buyers have shown enough strength to break through previous resistance zones and are now attempting to overcome the next significant barrier ahead.
🔴 Bullish Scenario:
If the price manages to break above the current resistance and hold above it, we can expect a continuation of the upward move toward higher zones. In this case, the bullish wave could extend toward the next resistance levels (marked in blue).
🔴 Bearish Scenario:
If the price reacts negatively to the current resistance area and fails to break above it, a corrective decline may follow. The nearest support zone below could play a crucial role in maintaining the bullish structure. However, if this support is also broken, the path could open for a deeper pullback toward lower support levels.
Pivot Points

#ETHUSDT: Currently On The Way Towards Filling The FVG?ETCUSDT is currently experiencing a significant correction as the price approaches a pivotal juncture where a substantial bullish price reversal is anticipated, potentially propelling it to new all-time highs or even surpassing them. It is imperative to exercise meticulous risk management and conduct your own thorough analysis before engaging in any cryptocurrency trading or investment activities.
Should the price indeed undergo a major correction, it is likely to decline to our second designated area, where it is anticipated to fill the liquidity gap and subsequently reverse course, continuing its trajectory towards our established targets.
Please consider this analysis as a secondary influence only, or even solely for educational purposes. It is crucial to conduct your own independent analysis and risk management prior to engaging in any cryptocurrency trading or investment endeavours, as they inherently carry substantial financial risks.
We extend our best wishes and encourage you to trade safely and responsibly.
Should you wish to demonstrate your support, you are welcome to express your appreciation through likes, comments, or sharing this information.
Thank you for your consideration.
Have a pleasant weekend.
Team Setupsfx_

GBPUSD Week 29 Swing Zone/LevelsAfter 7 straight weeks of profitable gold trading, we’re shifting gears to GBPUSD.
Why this pair? It’s offering a classic low-risk, high-reward setup that many traders appreciate:
🔒 Stop Loss: 10–15 pips
🎯 Take Profit: 50–100 pips
We’re analyzing price action using a simple but powerful concept:
Each zone is drawn based on how the high and low of one day compares with the next. For example:
Monday’s high/low vs Tuesday’s range
Tuesday’s vs Wednesday’s, and so on
This method helps spot potential continuation zones as market structure unfolds across the week.
👉 The key? Patience, and letting the levels tell the story.
As always price action determines trades

CHILLGUY – Ideal Entry After Retrace - 2x incoming!Best time to enter on $CHILLGUY—been waiting for a retrace, and we finally got it.
Anything near $0.055 is a solid buy if you missed the green zone entries.
The 3D chart is already signaling strong demand, and both downtrend signals from the local top have expired.
Expecting this one to trend faster than $BERT.
Targeting the Yearly Open for now—about a 2x from current levels. Will reassess after that.

BERT – Positioning Early for Post-July Breakout - 10centsMEXC:BERTUSDT may take a few more weeks before it starts to surge.
Slowly building a position in this area—there’s a weaker downtrend signal off the local top that expires around July 21.
After that, I see a solid chance for trend continuation and potential new highs into late July or early August.
Yearly Open is the near-term target, but expecting a move toward 10c by year-end.

ETHUSDTThis movement downtrend. If breake 2.790 movr to 3.500$ but breke 2.200 move trend to 1.500$.

SIGN buy/long setup (4H)A tight consolidation range has been broken to the upside, and price has not yet pulled back to it.
On the chart, we have a trigger line breakout and the formation of a bullish change of character (CH).
When the price reaches the green zone, we can look for buy/long positions.
Targets are marked on the chart.
For risk management, please don't forget stop loss and capital management
Comment if you have any questions
Thank You

US30 – Bearish Outlook Below 44,500 as CPI Looms US30 – Bearish Outlook Below 44,500 as CPI Looms
US30 rallied and successfully reached our resistance target, as expected in the previous analysis.
However, with today’s CPI release, the market is likely to see increased volatility. As long as the index trades below 44,500–44,570, the bias remains bearish, with downside targets at 44,210 and 43,960.
• If CPI prints below 2.6%, we may see a bullish breakout toward 45,100
• Above or equal to 2.6% supports continuation of the bearish move
However, we expect a 2.7% reading, driven by tariff-related price increases, which would support the bearish scenario.

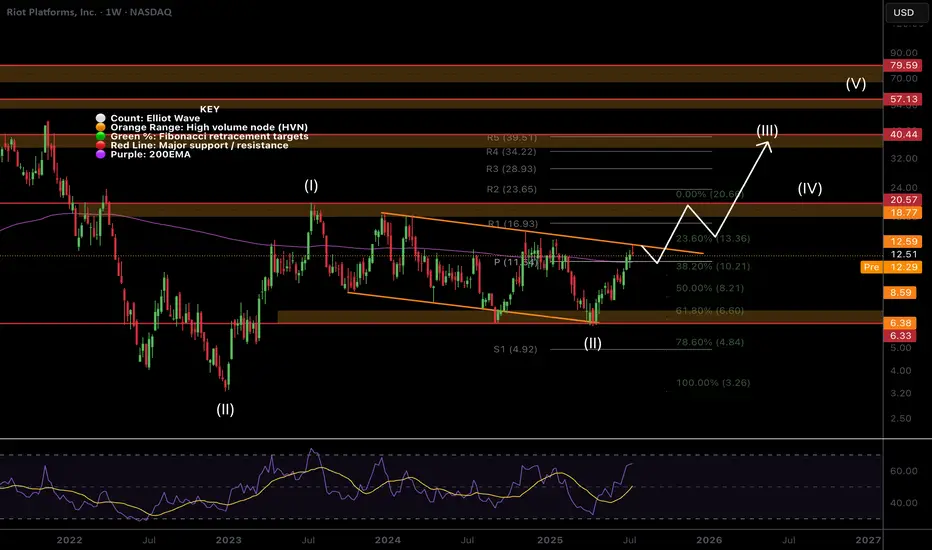
$RIOT Hit The Target Whats Next?NASDAQ:RIOT hit the descending orange resistance were I took partial take profits on my trade this week and it was immediately rejected as expected.
Price is now above the weekly pivot so that is the next support. This level also matches the weekly 200EMA.
Wave (II) hit the 'alt-coin' golden pocket of 0.618-0.786 Fibonacci retracement at the High Volume Node (HVN) support and descending support line which kicked off wave (III).
A breakout above the descending resistance line bring up the the next target of the HVN and previous swing high at $18-20 and $40 following a breakout above that.
Safe trading
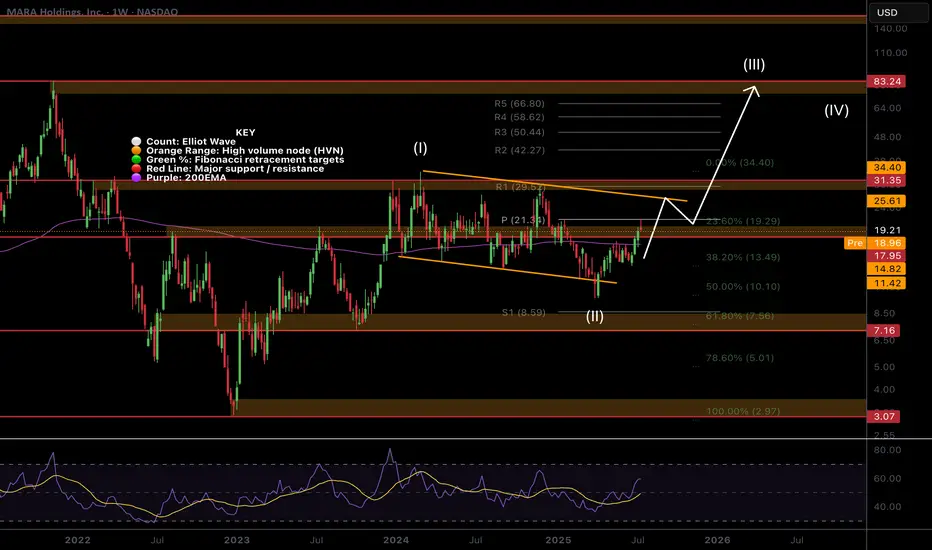
$MARA Hits the Weekly PivotNASDAQ:MARA path has been grinding higher clearing the High Volume Node (HVN) resistance where it is sat as support.
The weekly pivot rejected price perfectly so far but if the count is correct and Bitcoin doesn't dump I expect this continue strongly towards the descending orange line resistance as my partial take profit target.
Once that line is broken i am looking at terminal bull market targets of $80 but will of course take profit at key areas along the way.
Wave 2 swung below the descending support and recovered at 0.5 Fibonacci retracement potentially kicking off wave 3.
Safe trading
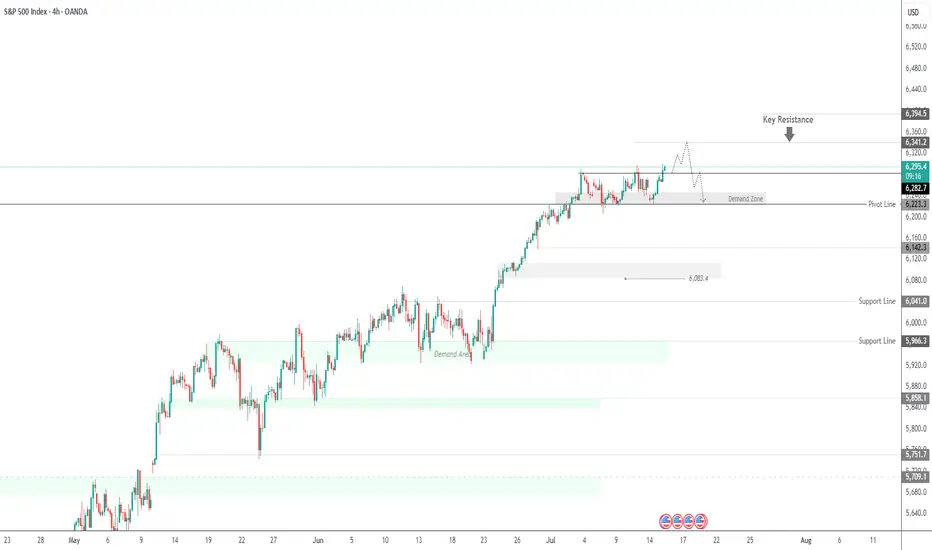
SPX500 Outlook – CPI Data in Focus, Key Pivot at 6282SPX500 – Market Outlook
U.S. futures are climbing as Nvidia plans to resume chip sales to China, fueling positive momentum across tech and growth sectors.
However, investor caution remains ahead of key events:
Major banks ( NYSE:JPM , NYSE:WFC Wells Fargo, NYSE:C Citigroup) will report earnings, offering insights into the financial sector.
All eyes are on the June CPI report, expected at 2.6%. A higher reading could reinforce bearish pressure, while a softer print would support continued bullish momentum.
Technical Outlook:
SPX500 has bounced from the demand zone and is now trading above the pivot at 6282, which keeps the bullish trend in play.
As long as the price holds above this level, we expect continuation toward 6341, and if broken, extended upside toward 6394.
To shift bearish, price must break and close below 6223, which would open the path toward 6142.
Pivot: 6282
Resistance: 6341 – 6394
Support: 6225 – 6191 – 6142
Event Watch : CPI data release today – anything above 2.6% may trigger downside; below 2.6% could support further upside.
Previous idea:
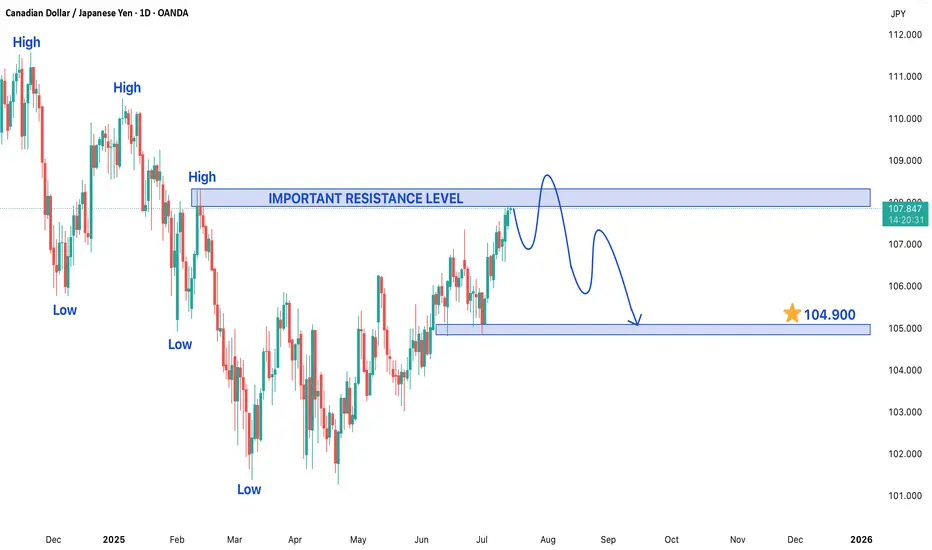
CADJPY TRADING IN A BEARISH TREND STRUCTUREThe CAD/JPY currency pair is currently exhibiting a bearish trend structure, indicating a prevailing downward momentum in its price action. At present, the pair is trading within a secondary trend near a significant resistance level, which is a critical point that could determine its next directional move. Traders and investors are closely monitoring this level as a breakout or rejection here could set the tone for future price movements.
On the lower side, if the bearish momentum continues, the price may decline toward the target of 104.900. This level could act as a key support zone, where buyers might step in to halt further losses. A break below this support could intensify selling pressure, potentially pushing the pair toward lower levels. Conversely, if the price finds stability near this support, a short-term rebound could occur, providing traders with potential buying opportunities in a corrective phase.
On the higher side, if the pair manages to overcome the current resistance, it may attempt to test the next key resistance level at 108.300. A successful breakout above this level could signal a shift in market sentiment, possibly leading to a trend reversal or a stronger corrective rally. However, given the prevailing bearish structure, any upward movement may face strong selling pressure near resistance zones, limiting upside potential.
Traders should remain cautious and watch for confirmation signals before entering positions. Key indicators such as moving averages, RSI, and MACD can provide additional insights into momentum and potential reversals. Risk management strategies, including stop-loss orders, should be employed to mitigate downside risks in case the market moves against expectations. Overall, the CAD/JPY pair remains in a bearish phase, and its next major move will depend on how it reacts to the critical resistance and support levels mentioned.
Nifty Analysis EOD – July 14, 2025 – Monday🟢 Nifty Analysis EOD – July 14, 2025 – Monday 🔴
"Broken Support, Fought Resistance – Tug of War in Play"
Nifty began the day with a classic Open = High (OH) setup, instantly rejecting any bullish intent. The crucial support zone of 25,080–25,060 was taken out early, and the market went on to mark the day's low at 25,001.95, a level that quickly turned into a decisive battleground.
After a bounce from the low, 25,125 emerged as a stiff resistance that pushed the index back below the broken support zone. For most of the session, the same support zone turned into resistance — a textbook polarity flip. However, in the final hour, Nifty showed resilience and finally closed back above 25,080, ending the session at 25,082.30.
🔄 The structure was full of failed intraday breakouts, signaling confusion and conflict — likely fueled by a wider CPR, imbalanced market structure, and medium IB of 109 pts. It was a low-volatility session, but packed with psychological tests.
🕯 5 Min Time Frame Chart with Intraday Levels
🕯 Daily Time Frame Chart with Intraday Levels
🕯 Daily Candle Breakdown
Open: 25,149.50
High: 25,151.10
Low: 25,001.95
Close: 25,082.30
Change: −67.55 (−0.27%)
📊 Candle Structure Breakdown
Real Body: 67.20 points – small to moderate bearish body
Upper Wick: 1.60 points – negligible upside attempt
Lower Wick: 80.35 points – strong defense from day’s low
🔍 Interpretation
Opened higher but got instantly rejected (OH formation).
Sellers took charge early but failed to hold momentum all the way.
The long lower wick reflects buyer presence at key 25,000 zone.
The close below open but above reclaimed support suggests tug of war — with bulls slightly redeeming themselves by EOD.
🕯 Candle Type
Hammer-like red candle — while bearish on close, the long lower shadow indicates potential exhaustion of selling and hints at reversal if follow-through buying emerges next session.
📌 Key Insight
25,000–25,020 has emerged as crucial near-term support.
A strong open or close above 25,150–25,180 may confirm a bullish reversal setup.
Breakdown below 25,000 opens the door for a fall toward 24,950 or lower.
🛡 5 Min Intraday Chart
⚔️ Gladiator Strategy Update
ATR: 188.77
IB Range: 109.20 → Medium IB
Market Structure: 🔴 Imbalanced
Trades Triggered
09:50 AM – Long Trade → ❌ SL Hit
01:05 PM – Short Trade → ❌ SL Hit
📉 Tough day for directional trades — false breakouts dominated.
📌 Support & Resistance Zones
Resistance Levels
25,125
25,168
25,180 ~ 25,212
25,260
25,295 ~ 25,315
Support Levels
25,080 ~ 25,060
25,000 ~ 24,980
24,965
💭 Final Thoughts
“Reclaimed ground doesn’t mean victory – yet. Watch the next move. Rejection below 25,000 ends the bulls' narrative; a strong move above 25,180 rewrites it.”
✏️ Disclaimer
This is just my personal viewpoint. Always consult your financial advisor before taking any action.

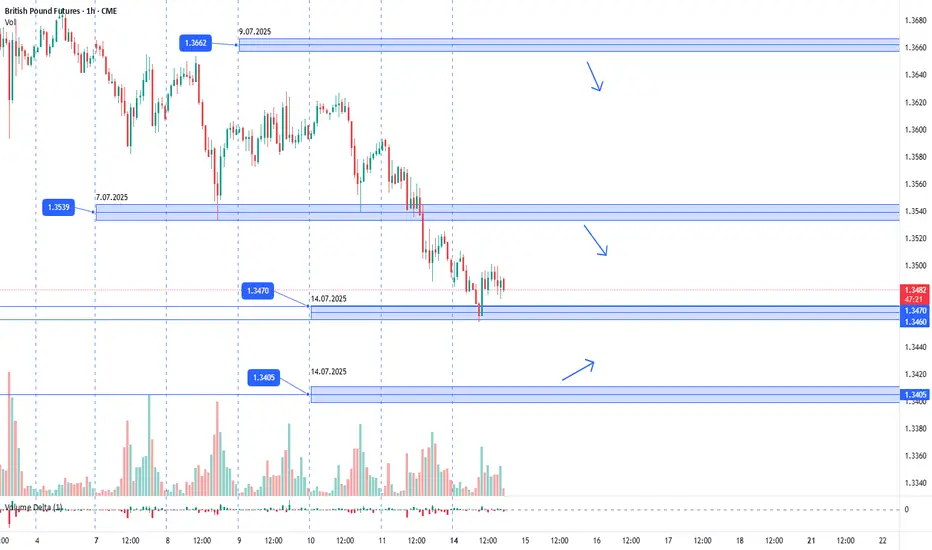
GBPUSD. 14.07.2025. The plan for the next few days.The nearest interesting resistance zone was already worked out in the morning and gave a good reaction. Let's mark the others where we can expect a reaction. It's not certain that there will be a major reversal, but I think we'll see a correction that can be monetized. We're waiting for a reaction and looking for an entry point.
The post will be adjusted based on any changes.
Don't forget to click on the Rocket! =)
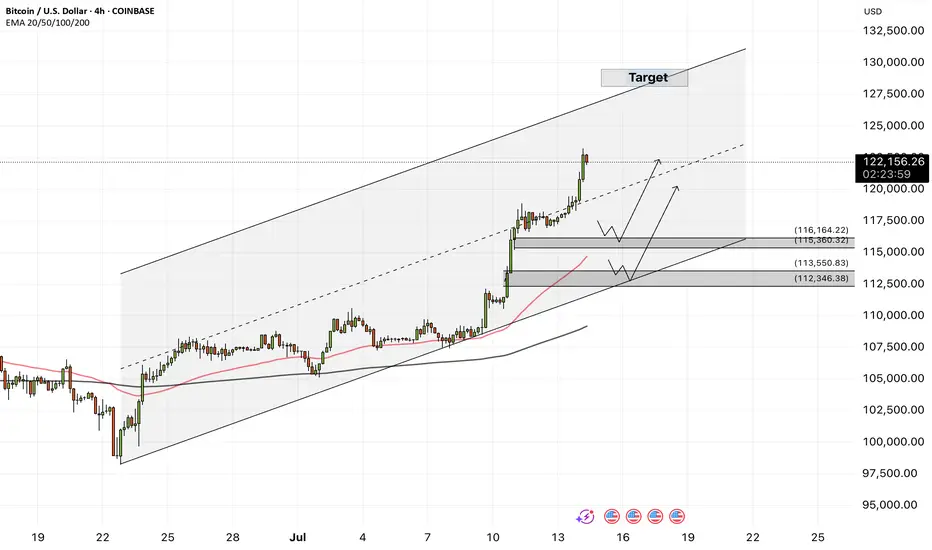
Bitcoin - Bitcoin, Unrivaled in the Market!Bitcoin is above the EMA50 and EMA200 on the four-hour timeframe and is in its ascending channel. Bitcoin’s current upward momentum has the potential to reach the target of $130,000. If it corrects, Bitcoin buying opportunities can be sought from the specified demand zones.
It should be noted that there is a possibility of heavy fluctuations and shadows due to the movement of whales in the market and compliance with capital management in the cryptocurrency market will be more important. If the downward trend continues, we can buy within the demand area.
In recent days, Bitcoin has managed to set a new historical high by crossing the $118,000 level; a jump that followed the strong accumulation of institutional capital, the upward trend of spot ETFs and the remarkable consolidation of such indices. This growth is not only the result of technical conditions or short-term market excitement, but is a clear reflection of the structural maturity of the Bitcoin ecosystem in the second half of 2025. A careful and comprehensive examination of the fundamental parameters shows that Bitcoin is moving differently than in the past: slower, but with much stronger support. On the other hand, more than $205 million in Bitcoin short selling positions have been liquidated following the jump in the price of Bitcoin and its crossing the $122,000 level.
First, the flow of investment from Bitcoin spot ETFs has broken records over the past week. In one day, more than $1.18 billion entered these funds, and the total annual inflow of these financial instruments has reached more than $51 billion. This is while ETFs such as IBIT (managed by BlackRock) and FBTC (managed by Fidelity) are attracting hundreds of Bitcoins daily, without causing any negative divergence in price indices. This phenomenon clearly shows that the participation of institutional investors through regulated channels is not only stable, but also accelerating. Along with this flow of capital, the parameters of the chain also paint a picture of a market with a balance of supply and demand. The MVRV ratio, an indicator for measuring market profitability, fluctuates between 2.2 and 2.34, meaning that the market is in a reasonably profitable state, but is still some way from the warning zone of profit saturation. Meanwhile, long-term holders (LTHs) are also continuing to accumulate. Long-term wallet holdings have reached a record high of 14.7 million BTC, representing nearly 70% of the total supply. In the last quarter alone, more than 13,000 BTC have been added to this group’s reserves.
On the other hand, the SOPR indicator, which measures realized profit ratio, shows that profit-taking is taking place at a gentle slope in the market, away from heavy selling pressure. This logical trend of profit-taking is a testament to mature investor behavior. Bitcoin flows to exchanges are also at very low levels; Bitcoin held on exchanges now account for just 1.25% of the total supply—the lowest level in over a decade. This significant reduction in potential selling pressure has kept Bitcoin’s price stable in the face of short-term volatility.
Behaviorally, the market is also showing signs of maturation. The number of daily active addresses has remained stable, but unlike during the buying frenzy, we are no longer seeing retail traders rushing into exchanges or mass wallet outflows. In other words, on-chain activity has stabilized, similar to the behavior of traditional mature markets—markets driven by data and structure, not emotion. From a macro perspective, the outlook for Bitcoin in the medium term is also positive. Many analysts and institutions, including Global X ETFs, see Bitcoin’s growth to $200,000 within the next 12 months as achievable. Technical analysis from some sources has also outlined the $140,000 range as the next price target in the next 100 days, provided that the VIX volatility index remains low and macroeconomic data maintains its current trajectory. However, a more conservative scenario sees a price consolidation in the $95,000-$100,000 range if geopolitical pressures increase or ETF inflows weaken.
Overall, Bitcoin is moving ahead in the summer of 2025 not only on the back of crypto market excitement, but also on the back of strong fundamentals and structured institutional capital inflows. Accumulation by long-term holders, a steady decline in supply on exchanges, a reasonable profit-taking balance, and a formal investment structure via ETFs have all combined to bring the market to a stable state and ready for further increases. If this trend holds, levels of $125,000-$140,000 in the short term, and a range of $180,000-$200,000 by the end of the year, are not far off!
On the other hand, BlackRock’s Bitcoin ETF (IBIT) managed to record the fastest growth in history among all ETFs, surpassing $80 billion in assets in just 374 days! For comparison, it should be noted that the S&P500 Index ETF needed about 5 times this time! BlackRock now holds about 706,000 Bitcoins (equivalent to 56% of the total ETF share).
GBPUSD| - Bullish BiasHTF Overview (4H): Strong bullish structure in play, with multiple highs being broken and momentum firmly to the upside. Price is clearly respecting bullish order flow, suggesting continuation.
MTF Refinement (30M): Identified a 30M OB aligned with the trend. Waiting for price to mitigate this zone, as it could serve as the springboard for the next impulsive leg up.
Execution Plan: Once the 30M OB is mitigated, I’ll drop to LTF (1M/5M) to watch for confirmation — CHoCH, BOS, or microstructure shift — before executing longs.
Mindset: Bull momentum is intact — patience and confirmation are key to riding it with precision.
Bless Trading!

XAUUSD (GOLD) - Bullish BiasHTF Overview (4H): Structure remains bullish after a recent break of highs. Liquidity above was taken, followed by a clean mitigation of a 4H OB — signaling strength and smart money continuation.
MTF Refinement (30M): Aligned with the bullish narrative, 30M shows price is likely reaching for nearby sell-side liquidity before resuming the upward move. Watching for price to sweep that liquidity zone next.
Execution Plan: Once the 30M OB is mitigated, I’ll drop to the 1M/5M for internal structure shifts — CHoCH or BOS — to confirm long entry.
Mindset: Not chasing — letting liquidity play its role and waiting for the OB + confirmation confluence before executing.
Bless Trading!

EUR/USD| - Bullish BiasHTF Context: Noted a clear break of structure to the upside, signaling strong bullish intent. Originally expected a deeper liquidity grab, but price shifted before reaching lower zones.
MTF Refinement: Dropped down to the 30M for better alignment — spotted a liquidity sweep confirming smart money interest.
LTF Execution Plan: Now watching for mitigation of the 30M OB. Once tapped, I’ll look for internal structure shift (1M/5M BOS or CHoCH) to confirm continuation.
Mindset: Staying patient — if price wants higher, it should respect this OB and show its hand first.
Bless Trading!

ETH – Watching the $2,900 Trigger for ATHsJust need BINANCE:ETHUSDT to break above $2,900 for the next trigger.
Feeling confident it will chew through the current supply zone.
Plenty of other coins are already showing clear direction, and Ethereum should follow.
Be patient—I doubt ETH will challenge the #1 spot, but a move above $2,900 opens the door to a potential new ATH.

BONK – Long Here, Patience RequiredTime to go long on $BONK.
Hard not to bid at this level—the risk/reward is solid.
Still expecting some range-bound price action before the real move kicks in, so patience is key here.
First target: the yearly open—nearly a 2x from current levels. BINANCE:BONKUSDT

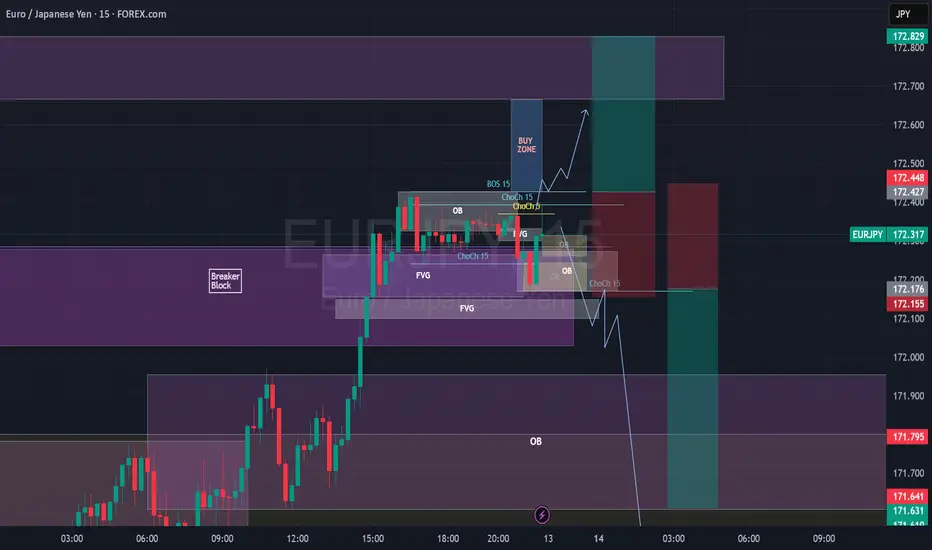
EURJPY Break of Structure, Retest and Fly5m - Monthly timeframes Bullish.
Price body candle closed and retested a 1H BB on 1H Timeframe.
Also retesting a 5M Bullish OB.
I want to wait for price to body candle close above the 15m BoS, create 3m/5m ChoCh, retest and look for Buys towards 172.665 (at the 1H OB or potentially 172.829, top of the 1H OB. SL under the 15m ChoCh.
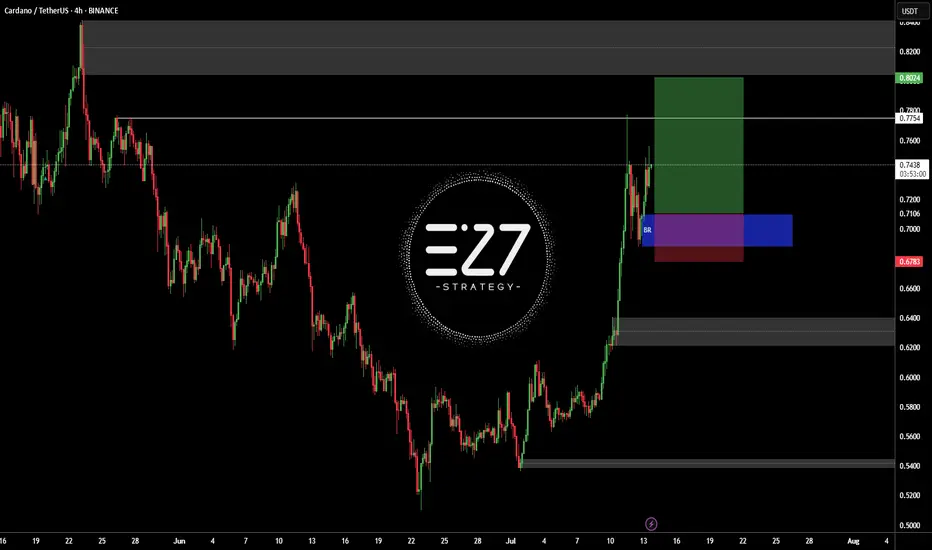
ADAUSDTBINANCE:ADAUSDT in up-trend and my open position buy in latest sowing low.
Best entry: 0.6952 - 0.7259
Target: 0.7754 - 0.8024
Stop loss: 0.678
Please control RISK management
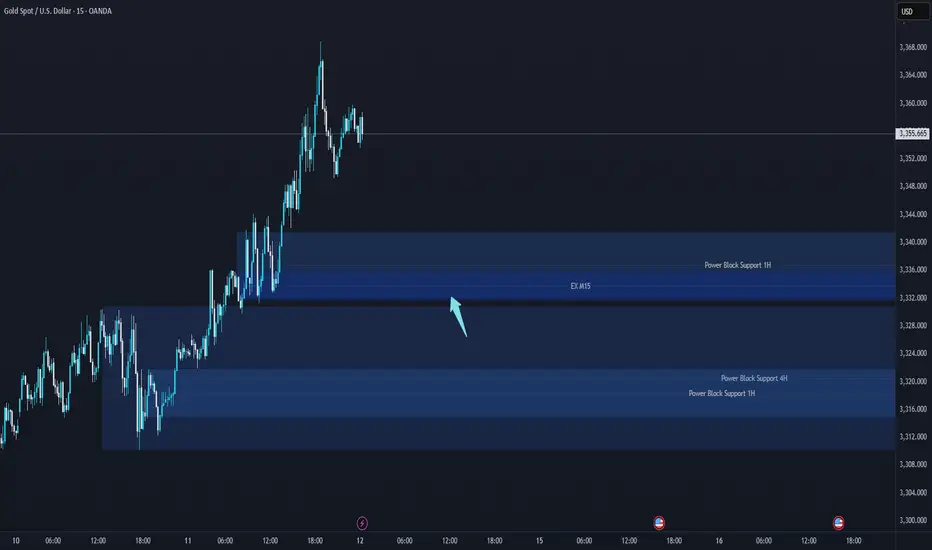
XAUUSD Support & Resistance Levels🚀 Here are some key zones I've identified on the 15m timeframe.
These zones are based on real-time data analysis performed by a custom software I personally developed.
The tool is designed to scan the market continuously and highlight potential areas of interest based on price action behavior and volume dynamics.
Your feedback is welcome!