NZDCAD Selling Trading IdeaHello Traders
In This Chart nzdcad HOURLY Forex Forecast By FOREX PLANET
today NZDCAD analysis 👆
🟢This Chart includes_ (NZDCAD market update)
🟢What is The Next Opportunity on NZDCAD Market
🟢how to Enter to the Valid Entry With Assurance Profit
This CHART is For Trader's that Want to Improve Their Technical Analysis Skills and Their Trading By Understanding How To Analyze The Market Using Multiple Timeframes and Understanding The Bigger Picture on the Charts
Pivot Points

GBPAUD buy Trade IdeaHello Traders
In This Chart GBP/AUD 4 HOURLY Forex Forecast By FOREX PLANET
today GBP/AUD analysis 👆
🟢This Chart includes_ (GBP/AUD market update)
🟢What is The Next Opportunity on GBP/AUD Market
🟢how to Enter to the Valid Entry With Assurance Profit
This CHART is For Trader's that Want to Improve Their Technical Analysis Skills and Their Trading By Understanding How To Analyze The Market Using Multiple Timeframes and Understanding The Bigger Picture on the Charts

Will EURCAD rise from a strong Support LevelHello Traders
In This Chart EURCAD HOURLY Forex Forecast By FOREX PLANET
today Gold analysis 👆
🟢This Chart includes_ (EURCAD market update)
🟢What is The Next Opportunity on EURCAD Market
🟢how to Enter to the Valid Entry With Assurance Profit
This CHART is For Trader's that Want to Improve Their Technical Analysis Skills and Their Trading By Understanding How To Analyze The Market Using Multiple Timeframes and Understanding The Bigger Picture on the Charts

MercadoLibre Inc Stock Quote | Chart & Forecast SummaryKey Indicators On Trade Set Up In General
1. Push Set Up
2. Range Set up
3. Break & Retest Set Up
Notes On Session
# MercadoLibre Inc Stock Quote
- Double Formation
* (Upper Band)) #1 - *4% Settings Condition | Completed Survey
* Entry & Retest At 0.5 Retracement Area | Subdivision 1
- Triple Formation
* (EMA Settings))
* 100 EMA - *Support & Resistance | Subdivision 2
* (TP1) | Subdivision 3
* Daily Time Frame | Trend Settings Condition
- (Hypothesis On Entry Bias)) | Indexed To 100
- Position On A 1.5RR
* Stop Loss At 156.00 USD
* Entry At 165.00 USD
* Take Profit At 180.00 USD
* (Ranging Argument)) & No Pattern Confirmation
* Ongoing Entry & (Neutral Area))
Active Sessions On Relevant Range & Elemented Probabilities;
European-Session(Upwards) - East Coast-Session(Downwards) - Asian-Session(Ranging)
Conclusion | Trade Plan Execution & Risk Management On Demand;
Overall Consensus | Buy

Nifty Analysis EOD – May 28, 2025 – Wednesday🟢 Nifty Analysis EOD – May 28, 2025 – Wednesday 🔴
Consolidation at the bottom—ready to blast? Or more of the same tomorrow?
📊 Nifty Summary:
Nifty opened mildly higher at 24,832.50, only to spend the entire session grinding within a narrow 127-point range. Most of the action stayed trapped in a 60-point box, giving day traders a frustratingly sideways experience. Attempts to break the range failed, and the index closed at the day's lower edge, continuing the consolidation near key support zones.
🔍 Intraday Walk:
Nifty opened with a small positive bias but failed to find follow-through.
For the major part of the day, price action remained boxed in a tight range—ideal only for scalpers and option writers.
An attempted breakout was seen, but the index quickly fell back into the consolidation zone.
Triangle breakout on 5-min chart came late (3:00 PM), with no time for validation.
Closed near day’s low at 24,752.45, just above crucial support.
🛡 5 Min Chart with Patterns
🛡 5 Min Chart with Patterns and Levels
🔎 Chart Observations:
🔸 Mini M-Pattern formed twice on 5-min chart at key level—adds to bearish caution.
🔸 Box consolidation zone repeated from yesterday’s range.
🔸 Symmetrical Triangle seen on 5-min chart broke on the downside at 15:00—too late to act but worth noting.
🔸 Yesterday’s low stayed protected, though price closed weak.
🔸 Volatility dried up ahead of monthly expiry—expect positioning tomorrow.
🕯 Daily Time Frame Chart
📉 Daily Candle Breakdown:
Open: 24,832.50
High: 24,864.25
Low: 24,737.05
Close: 24,752.45
Change: −73.75 (−0.30%)
Candle Structure:
Real Body: 80.05 pts (Red candle)
Upper Wick: 31.75 pts
Lower Wick: 15.40 pts
Interpretation:
Small-bodied candle with short wicks on both ends—a Bearish Spinning Top, hinting at indecision but with a slight bearish bias.
Inside Bar formation – breakout watch on either side.
🧠 Key Insight:
The market is digesting the recent downside with sideways consolidation. If bulls fail to protect 24,700, deeper cuts could follow. On the flip side, a break above 24,882 could trigger short-covering ahead of expiry.
🛡 5 Min Intraday Chart
⚔️ Gladiator Strategy Update:
ATR: 299.84
IB Range: 121.2 → Medium
Market Structure: Balanced
Total Trades: 0
❌ No valid triggers today – system stayed out due to tight range and lack of momentum.
📌 Support & Resistance Levels:
🔺 Resistance Zones:
24,768 ~ 24,820
24,882
24,894
24,920
24,972 ~ 25,000
25,062 ~ 25,070 (Rejected for 5th time!)
25,116 ~ 25,128
25,180 ~ 25,212
25,285 ~ 25,399
🔻 Support Zones:
24,737 ~ 24,727
24,700
24,660
24,640 ~ 24,625
24,590
24,530 ~ 24,480
24,460
🔮 What’s Next?
Scenario 1 – Breakdown:If 24,700 breaks and sustains, Nifty may head towards 24,589 → 24,500 → 24,461.
Scenario 2 – Breakout:If 24,882 breaks and sustains, Nifty can test 24,920 → 24,972 → 25,000 → 25,065 → 25,116 → 25,180.
📍 Most probable scenario:Expecting a range-bound day between 24,660 and 24,882, typical of Monthly expiry sessions. However, if short covering triggers, the day could flip into a trend day.
⛔ Caution: Tomorrow is a tricky expiry day—stay nimble, follow strategy, and respect levels!
🧘 Final Thoughts:
"The calm before the storm often wears the mask of boredom. When the market sleeps, prepare for the wake-up call."
✏️ Disclaimer:This is just my personal viewpoint. Always consult your financial advisor before taking any action.


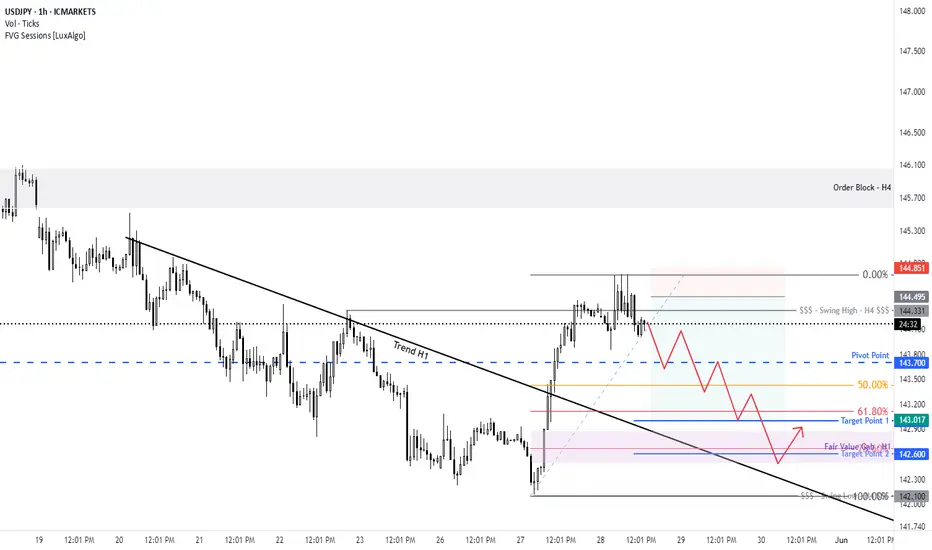
CAD/JPY For Bearish as pull-backyou can go short now
general trend is up trend
current phase is pull-back
have fun :)

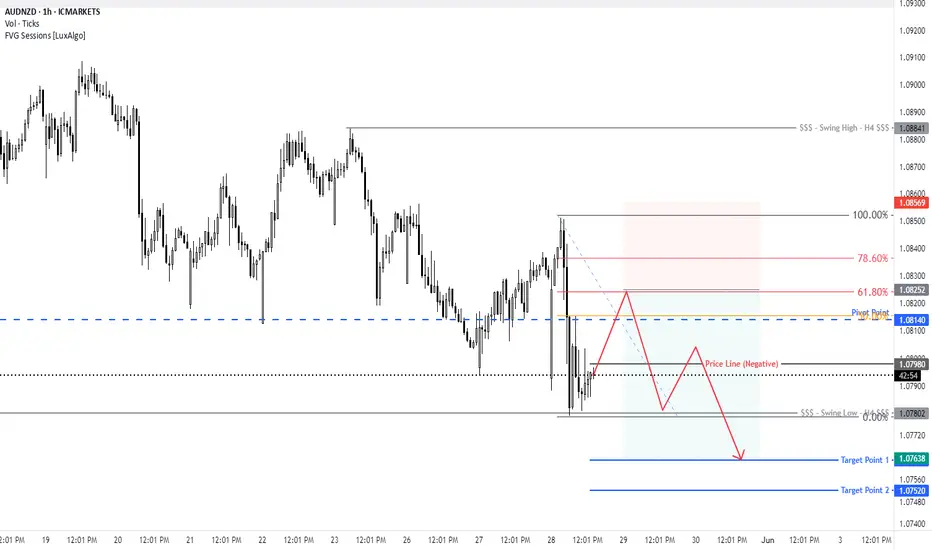
AUD/NZD For Bearishwait for pull-back near by entry point and then go short
general trend is down trend
have fun :)
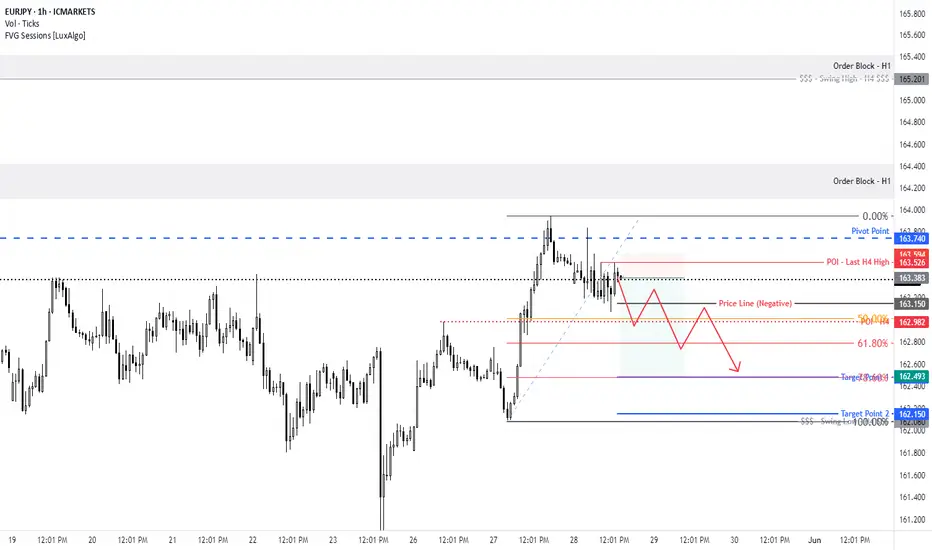
EUR/JPY For Bearish as pull-backyou can go short now
general trend is up trend
current phase is pull-back
have fun :)

Nifty Analysis & Trade Plan for Thursday, 29th MayHere in this video we have discussed and analyze Nifty current trend, and made a trade plan for Thursday, 29th May

GBP/CAD For Bullishwait for break the current resistance and go bullish with retest that area
general trend is up trend
have fun :)

NZD/USD For Bullishyou can go long now
or
wait for pull-back near by entry point and then go long
general trend is up trend
have fun :)

Woolworths Group Ltd Stock Quote | Chart & Forecast SummaryKey Indicators On Trade Set Up In General
1. Push Set Up
2. Range Set up
3. Break & Retest Set Up
Notes On Session
# Woolworths Group Ltd Stock Quote
- Double Formation
* (A+ Set Up)) - *14% Settings Condition | Completed Survey
* Wave Feature - *ABC Entry & Retest | Subdivision 1
- Triple Formation
* (Anchored VWAP)) - *Upper Band #1 | Subdivision 2
* (TP1) | Subdivision 3
* Daily Time Frame | Trend Settings Condition
- (Hypothesis On Entry Bias)) | Indexed To 100
- Position On A 1.5RR
* Stop Loss At 102.00 AUD
* Entry At 99.00 AUD
* Take Profit At 94.00 AUD
* (Ranging Argument)) & No Pattern Confirmation
* Ongoing Entry & (Neutral Area))
Active Sessions On Relevant Range & Elemented Probabilities;
European-Session(Upwards) - East Coast-Session(Downwards) - Asian-Session(Ranging)
Conclusion | Trade Plan Execution & Risk Management On Demand;
Overall Consensus | Neutral

BTC/USDT Technical Analysis, 2025-05-27 20:15 UTCBTC/USDT Technical Analysis, 2025-05-27 20:15 UTC
24h Change: +0.40% | Key Trend: Neutral to Weak Downtrend
MACD: Bearish crossover but histogram shows minor bullish divergence (recent upticks).
Trend Strength Index: Fluctuating between weak downtrend and recovery attempts.
Momentum:
RSI: 38.9 (approaching oversold, but no strong reversal signal).
Volume: Declining vs. 20-period avg (~0.2x), suggesting low conviction in moves.
Volatility:
ATR: 134.36 moderate volatility; range-bound action likely.
Price Action:
Candlestick Patterns: Recent Inside Bar and Bearish Engulfing, indicating indecision.
Support/Resistance:
Support: $109,500–109,600 (Bollinger Lower Band).
Resistance: $110,200–110,400 (previous highs, 20-period SMA).
Order Book:
Thin liquidity near current price (bid/ask spread: 0.01 USDT).
Large sell orders stacked at $109,881.76+, suggesting overhead supply.
Short-term (1–4h): Neutral/Slightly Bearish
Price may retest $109,500 support. A break below could target $109,000.
Reversal potential if RSI dips below 30 (oversold) and volume picks up.
Scalpers: Watch for rejection at $110,000 or bounce off $109,500.
Swing Traders: Wait for confirmation (close above $110,200 or below $109,300).
Risk Note: Low volume + Doji/Inside Bars = False breakout risk.

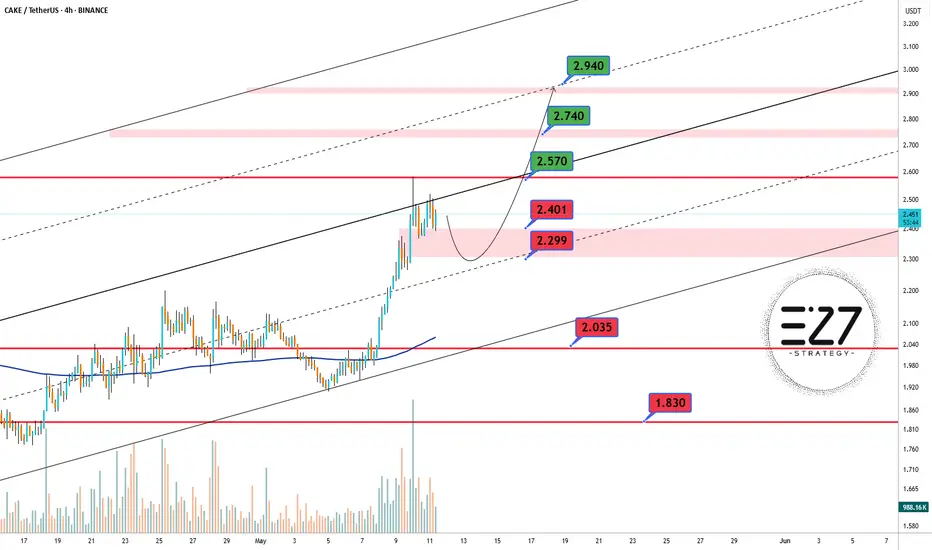
CAKEUSDT Pump📊 On the 4H BINANCE:CAKEUSDT chart, price has broken above the mid-term channel resistance and is currently pulling back. If the support zone holds, there’s potential for continuation toward higher resistance levels. A bullish reaction from the 2.299 USDT area could validate the next leg up.
🔄 If the correction deepens, the highlighted pink zone offers a strong re-entry opportunity. Key targets on the upside include 2.570, 2.740, and potentially 2.940 USDT if momentum continues.
✅ Key Support Levels:
🟥 2.401 USDT
🟥 2.299 USDT
🟥 2.035 USDT
🟥 1.830 USDT
🚫 Key Resistance Levels:
🟩 2.570 USDT
🟩 2.740 USDT
🟩 2.940 USDT
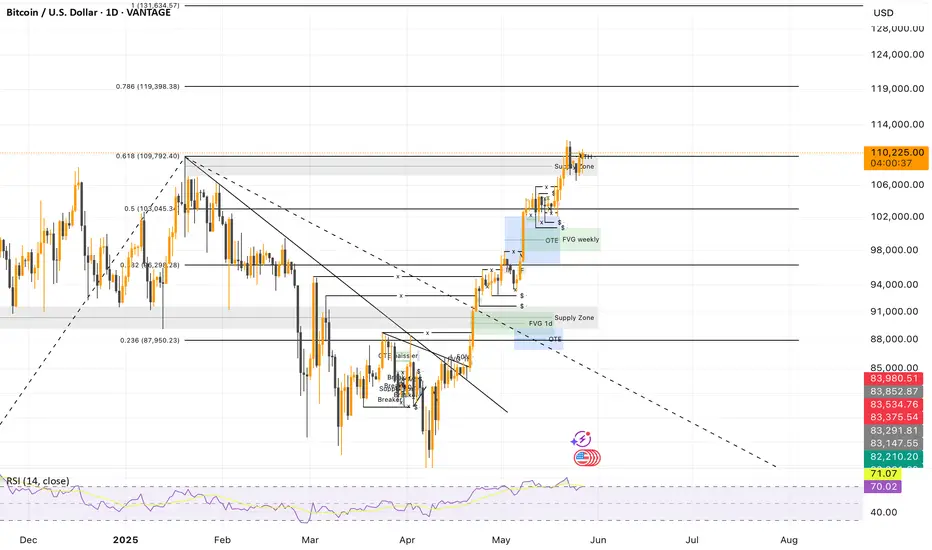
BTC/USD – 1D Analysis
1️⃣ Market Structure
BTC remains ultra bullish. A new high was hit last week at 112K.
Since then, price is consolidating slightly around 110K with no major weakness showing.
2️⃣ Key Levels
📍 Main support: 108K (previous ATH)
🎯 Current resistance: 112K
🧭 Fibo extensions: targets projected at 130K–135K
3️⃣ Context & Momentum
🏦 Institutional interest remains strong
💵 Weakening USD = bullish for BTC
⚖️ Overall sentiment still favors upside despite market caution
4️⃣ Scenarios to watch
📈 Bullish: Break above 112K could trigger a run to 130K+
📉 Bearish: Break below 108K may open room for a retest of 103–100K
✅ Conclusion
BTC is gearing up for the next leg. As long as 108K holds, the bias stays bullish.
📆 This week could be the one that triggers the breakout.
GBP/CHF For Bullishwait for pull-back near by entry point and then go long
general trend is up trend
have fun :)

EUR/CHF For Bullish as pull-backwait for pull-back near by entry point and then go long as pull-back
general trend is down trend
current phase is pull-back
have fun :)

Nifty Analysis EOD – May 27, 2025 – Tuesday🟢 Nifty Analysis EOD – May 27, 2025 – Tuesday 🔴
Another day, another 25K fight. Bulls tried hard, but bears had the final say — what about tomorrow?
📊 Nifty Summary:
The market opened with a slight gap-down of 38 points at 24,958. Within just 10 minutes, Nifty slid 207 points below the previous day’s low, diving into the 24,768–24,800 zone. It briefly halted around 24,737 — marking the first low of the day — and then suddenly reversed sentiment with a rapid 295-point rally within 45 minutes, breaking CPR, PDH, and even touching the previous week’s high. However, this strength didn’t last long. Gradually, Nifty fell back toward VWAP, broke below the current day low, and formed a new low at 24,704. It eventually closed at 24,826 — above the 24,768–24,800 support zone but below the PDL.
The rally between 24,768 and 25,062 was surprising in both speed and size. It didn't feel like short-covering or fresh buying, but it certainly caught many traders off-guard and likely led to position adjustments.
🛡 5 Min Chart with levels
📉 Intraday Walk:
🔻 Sharp fall within first 10 mins: 24,958 → 24,737
🔼 Sudden spike: 24,737 → 25,062 (rally of 295 points in 45 mins)
🔻 Gradual drop back to VWAP and beyond
🧭 Final dip: new low of 24,704 before recovery
✅ Closed at 24,826 — still above a key support zone
🧠 Key Observations:
Today's low (24,704) aligns near the 0.618 Fibonacci retracement from swing low to PDH — suggesting a potential end to the 3-day retracement phase if it holds.
Fair Value Gap (FVG) from May 22–26 is now filled, suggesting fresh buying interest may re-emerge.
But... closing below PDL (24,900) is a concern and hints at continued pressure.
It’s the fifth day of rejection from the 25,062–25,070 supply zone — a major wall to breach.
🕯 Daily Time Frame Chart
📉 Daily Candle Breakdown:
Open: 24,956.65
High: 25,062.90
Low: 24,704.10
Close: 24,826.20
Change: −174.95 (−0.70%)
🔍 Candle Structure
Real Body: Red (130.45 points) — signifies selling pressure
Upper Wick: 106.25 points — resistance near high
Lower Wick: 122.10 points — buyers tried to fight back➡️ Resembles an Inverted High-Wave Candle: signals indecision with bearish bias
Price volatility was intense. Bulls showed strength mid-day, but bears had better endurance. This candle may lead to further weakness unless buyers reclaim 25,063 quickly.
🛡 5 Min Intraday Chart
🥷 Gladiator Strategy Update
ATR: 314.6
IB Range: 178.7 (Medium)
Market Structure: Imbalanced
🎯 Trade Highlights:
🟥 9:20 Short Trigger → No trade (unfavourable R:R, System not Allow)
🟩 11:30 Long Trigger → SL Hit
🟥 14:20 Short Trigger → SL Hit
📉 Total Trades: 2 (Both hit SL)
Tough day for the system — range extremes and sudden reversals ruled the game.
📌 Support & Resistance Levels
📈 Resistance Zones:
• 24,882 ~ 24,895
• 24,920
• 24,980 ~ 25,000
• 25,062 ~ 25,070 (5th rejection!)
• 25,116 ~ 25,128
• 25,180 ~ 25,212
• 25,285 ~ 25,399
📉 Support Zones:
• 24,768 ~ 24,820
• 24,660
• 24,640 ~ 24,625
• 24,590
• 24,530 ~ 24,480
• 24,460
📌 What’s Next?
If 24,704 holds, bulls may attempt a bounce again.
A close above 25,063 would restore bullish sentiment.
But if 24,700 breaks, we may see deeper correction into lower support zones.
💬 Final Thoughts:
"Market will teach you humility every time you think you've figured it out."Today’s sudden rally followed by a deeper fall reminds us how quickly sentiment can shift. Trade with levels, respect zones, and keep adapting — that’s the only constant.
✏️ Disclaimer:
This is just my personal viewpoint. Always consult your financial advisor before taking any action.

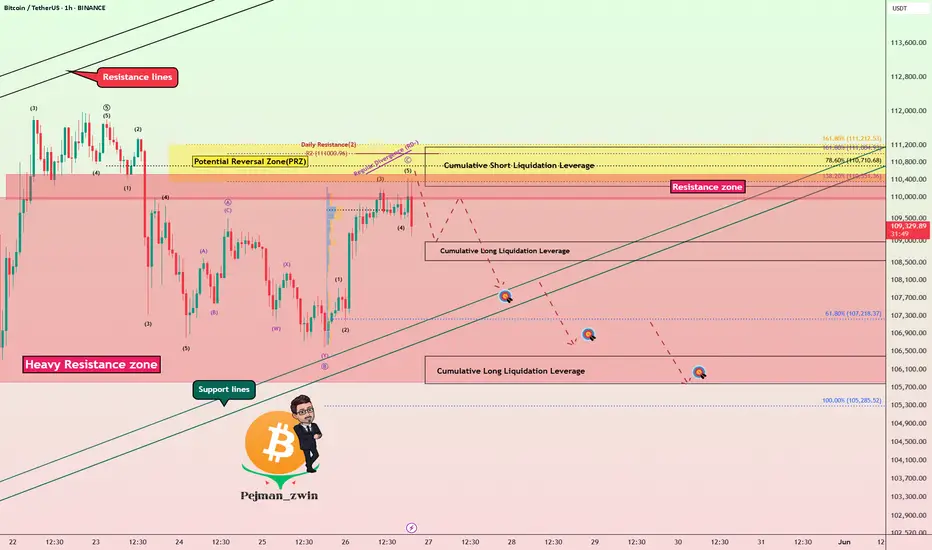
Bitcoin Bounce on Trump Tariff Delay – Short Setup Still Valid!Bitcoin ( BINANCE:BTCUSDT ) started to fall as I expected in the previous idea , and declined near the Support lines .
Bitcoin started pumping after the news that " US President Trump agreed to postpone 50% EU tariffs until July 9th ." Do you think this pumping of Bitcoin will continue?
Bitcoin is trading in a Heavy Resistance zone($110,000-$105,800) near the Potential Reversal Zone(PRZ) .
From the Elliott Wave theory perspective , Bitcoin appears to be in corrective waves , which is why I am labeling this idea as a ''Short''. The corrective waves structure is of the Expanding Flat(ABC/3-3-5) type.
I expect Bitcoin to attack the Support lines once again, and if these lines are broken, it will decline to the Targets I have indicated on the chart.
Notes :
MicroStrategy bought another 4,020 Bitcoins, but it didn't have much of an impact on the market.
If the Bitcoin price falls back below $109,000, about $185 million in long Bitcoin positions will be liquidated . = Attractive for exchanges
Bitcoin 2025 Conference to be Held in Las Vegas, Tuesday-Thursday = Could Cause Market Excitement .
Note: If Bitcoin touches $112,080, we should expect more pumping.
Please respect each other's ideas and express them politely if you agree or disagree.
Bitcoin Analyze (BTCUSDT), 1-hour time frame.
Be sure to follow the updated ideas.
Do not forget to put a Stop loss for your positions (For every position you want to open).
Please follow your strategy and updates; this is just my Idea, and I will gladly see your ideas in this post.
Please do not forget the ✅' like '✅ button 🙏😊 & Share it with your friends; thanks, and Trade safe.
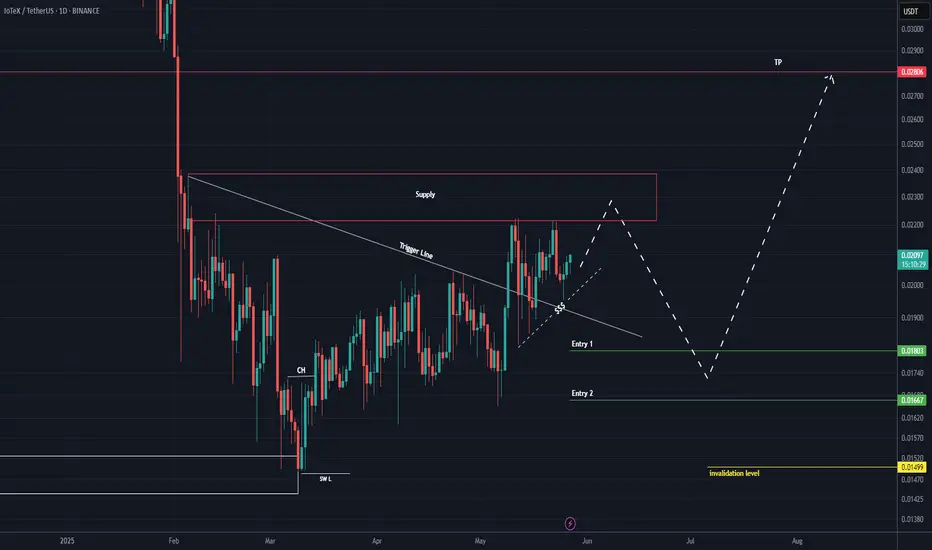
IOTX buy/long setup (1D)An important trigger line has been broken, and the price has been moving sideways for a while.
There is also a bullish CH on the chart.
It is expected that the price will make a pullback to the support zone and then move toward the supply zones higher on the chart. We are looking for buy positions at the entry points.
A daily candle closing below the invalidation level will invalidate this analysis.
For risk management, please don't forget stop loss and capital management
When we reach the first target, save some profit and then change the stop to entry
Comment if you have any questions
Thank You