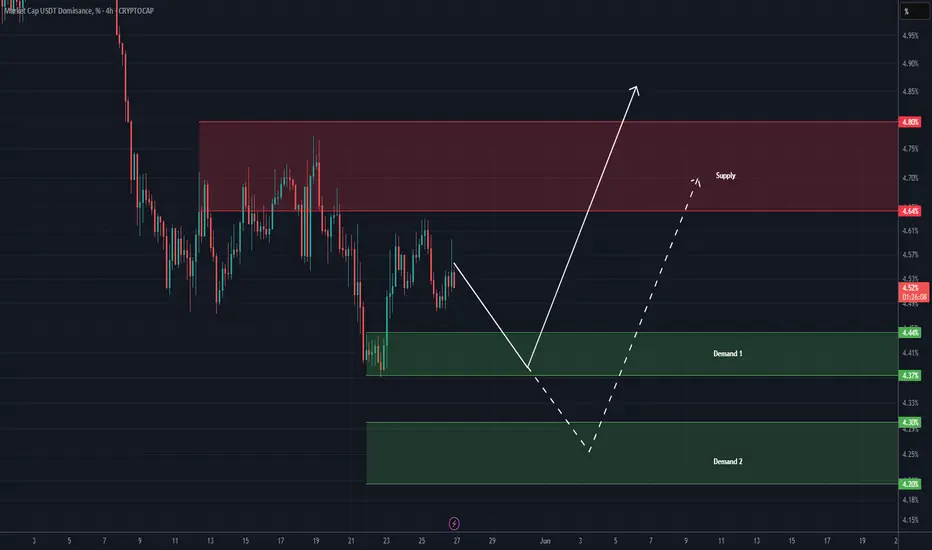
USDT DOMINANCE Update (4H) First of all you should know that "USDT Dominance" is always moving inverse of BTCUSDT .
This index is ready to retrace and bounce upward from either Demand 1 or Demand 2. Be cautious with this index and monitor it closely.
If the price gets rejected toward Demand 2, altcoins may experience some growth before undergoing another correction.
Let’s wait and see what happens.
For risk management, please don't forget stop loss and capital management
Comment if you have any questions
Thank You
Pivot Points
NVDA - 140 Quasimodo?Well NVDA has exceeded the 120 PoC from the last year, and other than the head and shoulders developing it looks rather bullish above that 120. But I would sell 140, or at least not buy.
And if I'm buying I'd probably wait for 112. Think I will wait forever? 😂
Will update after we get some more data.

ETH weekly consolidationETH currently trading in a weekly balance range. Looking like some bullish consolidation for a major move up back to 4k. Idea may take some more time to play out, but the longer it takes, the better the move. ETH to $4000

BTC/USDT – Magical Mid-Channel Momentum Incoming!by @TradeWithMky 🐸💫
After an explosive breakout, Bitcoin is now gracefully gliding within the enchanted parallel channel of opportunity. As the price pulls back towards the 50% midline, we prepare to summon the next leg up with full momentum! 💥
The secret spell?
☄️ Wait for the price to tap the 50% line
🪄 Channel confluence + bullish structure intact
🚀 Triple-arrow formation signals high probability continuation
Let the candles dance within the rhythm of the trend – where structure meets strategy and magic meets market.
This isn’t just a chart. It’s a whisper from the market gods telling us: “Stay ready, the move is coming.”
🧙♂️ Remember:
TradeWithMky – where altcoins speak louder than Bitcoin!
#TradeWithMky #BTCUSDT #CryptoMagic #ChannelBreakout #AltcoinSeason #Bitcoin #PriceAction #TechnicalAnalysis #TrendRiding

Gold Trading Strategy for the 27thOn the 4-hour chart today, the bullish trend of gold remains intact ⭐️✨📈 ⚠️📉
The current price is facing resistance at 3365 near the previous high. Due to the excessive release of early bullish momentum, a period of adjustment is usually required 📉
However, with further news-driven stimuli this week, gold may still surge sharply 🚀
The key lies in the morning session's trend, so timing is crucial when judging the strength of bulls and bears ⏰
It is expected that gold will continue the pattern of oscillating upward movement, and pullback opportunities can be captured 📈
Resistance is at 3365, and support is at the 3320 level 🔍
Long Position Strategy:
If the gold price retracts to the 3320-3325 range, consider opening a long position 📊 Set the stop-loss at 3317, with targets at 3340-3350 🎯
If the price holds above 3320, try opening a long position 🌟 The initial target is 3345, and if 3345 is successfully broken through, further targets will be 3350-3360 ⚡️
Short Position Strategy:
When the price rises to the 3360-3365 range, try opening a short position ⚠️ Set the stop-loss at 3370, with targets at 3340-3330 📉
Gold Trading Strategies
sell@3360-3365
tp:3330-3340
buy@3320-3325
tp:3350-3360
Professional trading strategies are pushed daily 📊
Lock in precise signals amid market fluctuations 🚀
Confused about market trends? Stuck in strategy bottlenecks?
Real-time strategies serve as your "trading compass" 🌐
From trend analysis to entry/exit points, dissect market logic comprehensively
Refer now 📲
Help you move steadily forward in investments ✨
👇👇👇

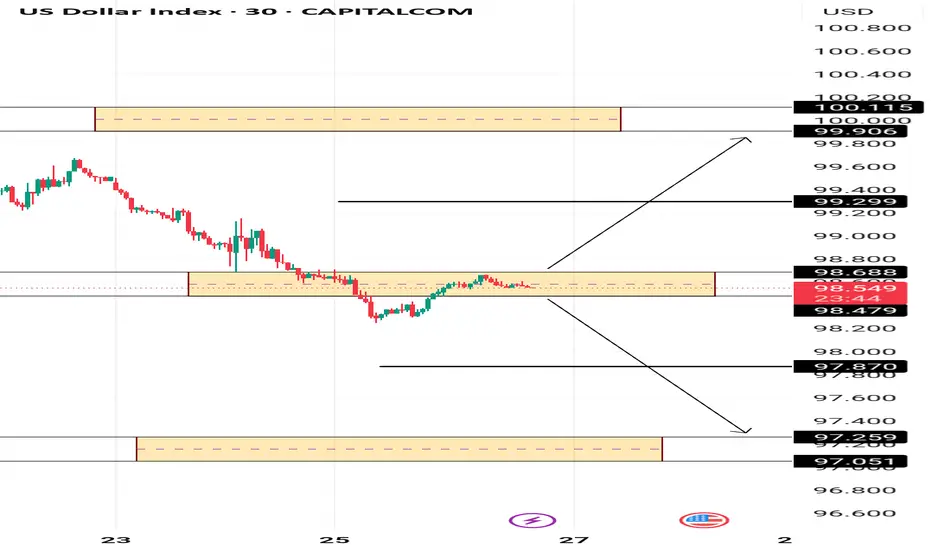
USD INDEX PIVOT AREAThe USD INDEX is currently prefering the bears as long as the pivot area holds .However abreak above could bring some strength to the index with 99.29 and 99.90 as targets.
Nifty Analysis EOD – May 26, 2025 – Monday 🟢 Nifty Analysis EOD – May 26, 2025 – Monday 🔴
Tug of War for 25K between the Bulls and Bears
📈 Nifty Summary:
The week kicked off with a 66-point gap-up, opening at 24,919, and bulls wasted no time pushing toward the much-awaited 25,000 mark, hitting an intraday high of 25,079.20. But the celebration didn’t last long—the move lacked conviction, and what followed was a sharp fall back to the day's low at 24,900.50.
From there, Nifty bounced off 24,910, climbed back to the VWAP zone, and then spent the rest of the session range-bound between 24,950 ~ 25,000, reflecting indecision and consolidation. The index closed the day just above the psychological milestone at 25,001.15, wrapping up a volatile yet directionless session.
🛡 5 Min Chart with levels
🔍 Technical Snapshot:Nifty broke above a trendline but faced resistance near 25,062 ~ 25,070—an important supply zone—and eventually slid back into the previous resistance band of 24,972 ~ 25,000, now acting as a struggle zone.
🕯 Daily Time Frame Chart
🕯 Daily Candle Breakdown
Open: 24,919.35
High: 25,079.20
Low: 24,900.50
Close: 25,001.15
Change: +81.80 (+0.33%)
Candle Structure:
✅ Real Body (Green): 81.80 pts → Mild bullish close
🔼 Upper Wick: 78.05 pts → Buying faded near highs
🔽 Lower Wick: 18.85 pts → Support around 24,900
This candle shows moderate bullish momentum, but the long upper wick tells us the bulls faced strong selling near the top. The structure suggests a "weary bull" candle—a sign of hesitation, not a reversal. Price is trying to move higher, but profit-booking near resistance is slowing the pace.
📌 Key Insight:
The trend remains upward, but momentum is weakening near key resistance.
Above 25,080 = Breakout confirmation
Below 24,900 = Possible consolidation or pause
🛡 5 Min Intraday Chart
🥷 Gladiator Strategy Update
Strategy Parameters
ATR: 314.6
IB Range: 178.7 → Medium IB
Market Structure: Imbalanced
Trade Highlights⚠️
No trades were triggered by the system today
💼 Total Trades: 0
📊 Support & Resistance Levels
🔺 Resistance Zones:•
25,062 ~ 25,070
25,116 ~ 25,128
25,180 ~ 25,212
25,285
25,399
🔻 Support Zones:
24,980 ~ 25,000
24,920
24,882 ~ 24,895
24,768 ~ 24,820
24,660
24,640 ~ 24,625
24,590
24,530 ~ 24,480
24,460
🧠 Final Thoughts:
"Markets don't lie, they whisper truth—if you're quiet enough to listen."The market is clearly respecting resistance zones, and until bulls can decisively close above 25,080, expect more choppy action near highs. Stay patient. Let structure lead your decisions.
✏️ Disclaimer ✏️
This is just my personal viewpoint. Always consult your financial advisor before taking any action.

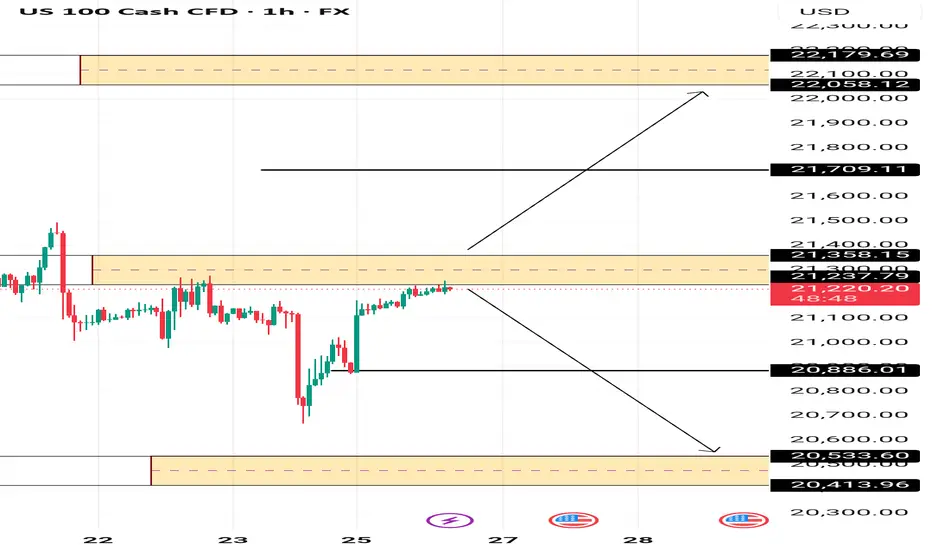
US100 PIVOT AREA The Nasdaq is currently at the pivot area between 21237 and 21385 , if the price remains below this area then 20886 and 20533 could be the next possible targets.
However a break above could trigger bullish momentum targeting 21709 and 22058
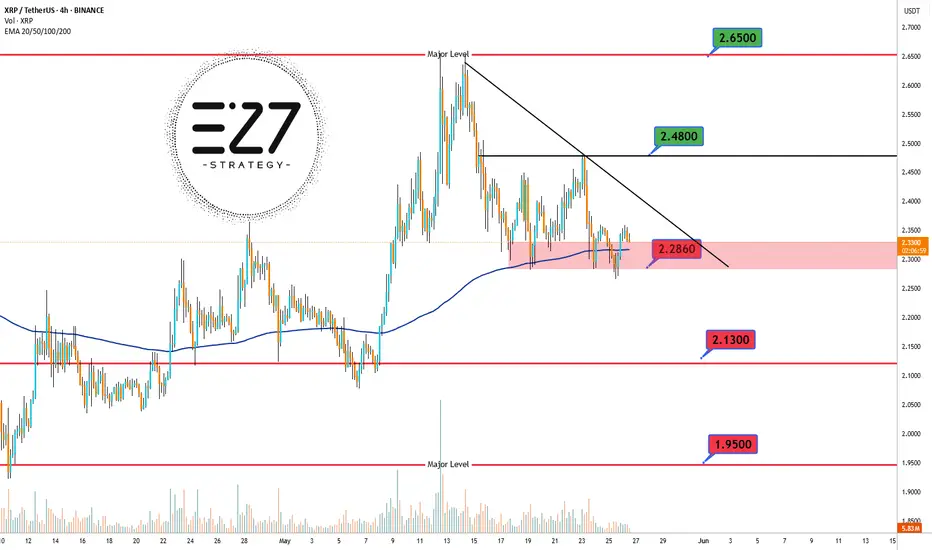
XRPUSDT The 4-hour chart of BINANCE:XRPUSDT shows that the overall trend remains bullish, but the price is currently in a corrective downward phase. 📉 At the moment, XRP is trading in a highly critical zone, right at the 2.2860 USDT support level, which aligns with the 200 EMA — often considered a dynamic support area. 🛡️ Despite this confluence, the price still sits below the descending trendline, indicating continued bearish pressure. ⚠️ If the price manages to hold this key zone and break above the trendline, a move toward the next resistance at 2.4800 USDT and potentially 2.6500 USDT could follow. 🚀 However, losing the 2.2860 support could trigger a deeper drop toward 2.1300 USDT and even 1.9500 USDT. ❗ This current level, where static support intersects with the 200 EMA, is a make-or-break zone that will likely define the short-term direction of XRP.
Support & Resistance Levels:
🔼 Major Resistance: 2.6500 USDT
🔼 Secondary Resistance: 2.4800 USDT
⚡ Dynamic Resistance (trendline): ~2.3500 USDT
🔽 Key Support (current price level): 2.2860 USDT
🔽 Secondary Support: 2.1300 USDT
🔽 Major Support: 1.9500 USDT
BITCOIN BREAKING POINT – Are You Ready for the Next Leg? 🔥 Bitcoin just tagged the previous ATH resistance and is eyeing that juicy 0.618 Fib Extension at $112,180.
But hold on—this isn’t just another breakout… this is structure-breaking territory.
📌 Key Levels to Watch:
💣 ATH Resistance: Retest in progress. A clean breakout here could shift the macro sentiment for good.
🎯 Fib Extension 0.618: $112,180 – first major target.
🚀 Fib Level 1: $135,441 – when disbelief turns to euphoria.
🧠 Fib Level 1.618: $172,928 – max hype zone. Can it happen this cycle?
🧠 Fundamental Nuggets You Need to Know:
✅ Spot ETFs are not just hype – real inflows are coming in daily.
🇺🇸 US Elections = Uncertainty, and Bitcoin LOVES uncertainty.
💰 Global liquidity is quietly increasing – central banks are softening. You feel it?
⚠️ RSI Watch:
Currently hovering around 67.93 – bullish but not overheated yet. Momentum still has fuel.
🧠 Closing Thoughts:
Everyone’s watching this level. Retail is cautious. Smart money is adding.
History tells us: when BTC breaks ATH, altcoins follow like wildfire.
If you're not preparing, you're reacting.
And in this market... reacting = losing.
🚨 Don’t just follow the price – follow the smart money.
🐸 Brought to you by Miracle, of the meme coin dynasty 🧙♂️
🐒 TradeWithMky – where altcoins speak louder than Bitcoin!

Global Payments Inc. Stock Quote | Chart & Forecast SummaryKey Indicators On Trade Set Up In General
1. Push Set Up
2. Range Set up
3. Break & Retest Set Up
Notes On Session
# Global Payments Inc. Stock Quote
- Double Formation
* (Upper Band)) #1 - *Midrange Entry & Retest | Completed Survey
* (Lower Band)) #2 - *Peak Velocity | Subdivision 1
- Triple Formation
* 110.00 USD - *Area Of Value | Subdivision 2
* (TP1) | Subdivision 3
* Daily Time Frame | Trend Settings Condition
- (Hypothesis On Entry Bias)) | Regular Settings
- Position On A 1.5RR
* Stop Loss At 86.00 USD
* Entry At 75.00 USD
* Take Profit At 58.00 USD
* (Downtrend Argument)) & No Pattern Confirmation
* Ongoing Entry & (Neutral Area))
Active Sessions On Relevant Range & Elemented Probabilities;
European-Session(Upwards) - East Coast-Session(Downwards) - Asian-Session(Ranging)
Conclusion | Trade Plan Execution & Risk Management On Demand;
Overall Consensus | Sell

A strategic, short-term bullish trade driven by the USDT.D!This DIA/USDT long position is a strategic, short-term bullish trade driven by the USDT.D distribution pattern on the 45-minute timeframe, signaling a potential altcoin rally. DIA’s strong fundamentals, including its transparent data sourcing, DeFi adoption, and cross-chain compatibility, make it a compelling choice for this trade. While we remain long-term bearish on the crypto market due to macroeconomic and cycle risks, this trade serves as a hedge to capture short-term upside while aligning with our broader strategy.

EURUSD: Support & Resistance Analysis For Next Week 🇪🇺🇺🇸
Here is my latest structure analysis
and important supports & resistances for EURUSD for next week.
Consider these structures for pullback/breakout trading.
❤️Please, support my work with like, thank you!❤️
I am part of Trade Nation's Influencer program and receive a monthly fee for using their TradingView charts in my analysis.

Gold is in the bullish directionHello Traders
In This Chart GOLD HOURLY Forex Forecast By FOREX PLANET
today Gold analysis 👆
🟢This Chart includes_ (GOLD market update)
🟢What is The Next Opportunity on GOLD Market
🟢how to Enter to the Valid Entry With Assurance Profit
This CHART is For Trader's that Want to Improve Their Technical Analysis Skills and Their Trading By Understanding How To Analyze The Market Using Multiple Timeframes and Understanding The Bigger Picture on the Charts

C98 Buy Setup (1D)Based on the 3D pattern formed at the bottom and the breakout of the trigger line, it seems that the origin zones of the move may contain enough orders to trigger a trend reversal for C98.
A double bottom is expected to form, and the price may attempt to attack the marked supply zone.
The support zone and supply area are marked on the chart.
A daily candle closing below the invalidation level will invalidate this analysis.
For risk management, please don't forget stop loss and capital management
When we reach the first target, save some profit and then change the stop to entry
Comment if you have any questions
Thank You

CATI Memcoin. Main (essentially secondary) trend. Channel. 25 05Logarithm. Time frame 3 days (less is not necessary). Decline from the maximum -94%. As a rule, altcoins (ticker name, legend, imitation of usefulness does not matter) of such liquidity decline in their secondary trend until its reversal by -95-98%.
But, at the moment, there is a significant increase in volume, this is a good sign, if the price goes beyond the resistance of the descending channel, then a trend expanding triangle will form, or as it is also called the Livermore cylinder (dynamic zones of support / resistance of the "participation" phase).
In order not to miss the reversal, if you are afraid to gain a position now, then work with orders for a breakthrough, that is, a trend break.
🟣For 2 months now, a sideways trend with a 100% step, the price is being pulled to the resistance of the descending channel.
Breakthrough of it — trend reversal.
Not a breakthrough , decline to the next "shelf".
Everything is quite simple and logical. All levels and zones of potential minimums and maximums are shown. Remember, the average price of the set and reset is important. The key resistance zone after the reversal, where you will need to dump most of the position, or everything, is highlighted in gray.

Key Levels for the Week 26-30/05/2025 ∷Gold∷🐍 Key Levels Overview for the Week🐍
__________________________
Trend Base Lines
3351🐂3362🐂3368🐂3374🐂3380🐂3387🐂3388
3331🏛3336🏛3342🏛3348🏛3354🏛3358
3298🐻3309🐻3321🐻3330
__________________________
Resistances🔀
3447
3517
3534
3559
3585
3599
3631
3645
3671
Mids∷∷∷
3348
3377
3391
3428
3440
3450
3462
3472
3488
3499
Supports🔀
3425
3413
3389
3362
3324
3284
3271
3258
3242
3229
3215
3199
3136

XAU/USD Trading Plan - LAST WEEK OF May 25, 2025 Current Market Status * price $3358
💡 LIKE AND FOLLOW FOR MORE 💡
📊 Key Events This Week:
May 28: FOMC Meeting
May 29: Unemployment Data
May 30: Core PCE Index
📈Long Position Setup (Buy Zone)
Entry: $3,350-$3,355
Targets:
------ $3,420 (2.1% gain)
------ $3,480 (3.9% gain)
------ $3,550 (5.7% gain)
Stop Loss: $3,300 (1.5% risk)
___ Rationale:
- Support at weekly zone ($3,330)
- Potential Fed dovish pivot
- Monthly light buyer interest
- Safe-haven demand potential
📉 Short Position Setup (Sell Zone)
Entry: $3,380-$3,390
Targets:
----- $3,330 (1.5% gain)
----- $3,280 (3.0% gain)
----- $3,220 (4.7% gain)
Stop Loss: $3,420 (1.2% risk)
___Rationale:
Resistance at weekly high ($3,586)
Potential strong USD if Fed remains hawkish
Overbought conditions possible
Profit-taking at key levels
⚠️ Critical Risk Factors
FOMC interest rate decision
US economic data surprises
Geopolitial developments
Physical gold demand changes
🔍 Key Technical Levels
Support: $3,330 (weekly), $3,280 (monthly)
Resistance: $3,420 (main zone), $3,550 (ATH)
Pivot Point: $3,360

OSCR to bounce Oscar had outstanding earnings and presented another opportunity for an entry. This company provides a new way to think about health insurance. Employers will save money by providing direct-to-employee insurance plans. This allows employees to avoid being lumped into an average basket of healthy, middle-of-the-road, and sicker colleagues. this phenomenon causes overpaying for many employees.
TA-wise: We see a break of the resistance, and a retest to come. On the break, I sold my 35$ LEAPS I bought a while back and locked in a 50% win. I still have 25$ LEAPS but am considering adding commons or some ITM LEAPS. My near-term target is around 18$ or about a 33% upside.

AVAXUSDT 📊 BINANCE:AVAXUSDT Chart Analysis
AVAX price, after breaking the key resistance at 22.20, is showing a strong upward move 📈 toward the next resistance at the end of the second leg at 30.00 USD. The 22.00 level could act as a pullback and provide strong support 🔄. If it consolidates above 30.00, the uptrend may continue to 37.00 🚀.
Support and Resistance Levels:
Supports:
• 22.20 🛡️
• 20.00 🛡️
• 17.50 🛡️
Resistances :
• 30.00 🚧
• 37.00 🚧

Sea Limited Stock Quote | Chart & Forecast SummaryKey Indicators On Trade Set Up In General
1. Push Set Up
2. Range Set up
3. Break & Retest Set Up
Notes On Session
# Sea Limited Stock Quote
- Double Formation
* (Diagonal) & (A+ Set Up)) | Completed Survey
* (Continuation Argument)) / Entry & Retest | Subdivision 1
- Triple Formation
* (Lower Band)) #2 - *Support Area | Subdivision 2
* (TP1) | Subdivision 3
* Daily Time Frame | Trend Settings Condition
- (Hypothesis On Entry Bias)) | Regular Settings
- Position On A 1.5RR
* Stop Loss At 150.00 USD
* Entry At 165.00 USD
* Take Profit At 185.00 USD
* (Uptrend Argument)) & No Pattern Confirmation
* Ongoing Entry & (Neutral Area))
Active Sessions On Relevant Range & Elemented Probabilities;
European-Session(Upwards) - East Coast-Session(Downwards) - Asian-Session(Ranging)
Conclusion | Trade Plan Execution & Risk Management On Demand;
Overall Consensus | Buy

Two MAs, One Ribbon: A Smarter Way to Trade TrendsSome indicators aim to simplify. Others aim to clarify. The RedK Magic Ribbon does both, offering a clean, color-coded visualization of trend strength and agreement between two custom moving averages. Built by RedKTrader , this tool is ideal for traders who want to stay aligned with the trend and avoid the noise.
Let’s break down how it works, how we use it at Xuantify, and how it can enhance your trend-following setups.
🔍 What Is the RedK Magic Ribbon?
This indicator combines two custom moving averages:
CoRa Wave – A fast, Compound Ratio Weighted Average
RSS_WMA (LazyLine) – A slow, Smooth Weighted MA
When both lines agree on direction, the ribbon fills with:
Green – Bullish trend
Red – Bearish trend
Gray – No-trade zone (disagreement or consolidation)
Key Features:
Visual trend confirmation
No-trade zones clearly marked
Customizable smoothing and length
Works on any timeframe
🧠 How We Use It at Xuantify
We use the Magic Ribbon as a trend filter and visual guide .
1. Trend Confirmation
We only trade in the direction of the ribbon fill. Gray zones = no trades.
2. Entry Timing
We enter near the RSS_WMA (LazyLine) for optimal risk-reward. It also acts as a dynamic stop-loss guide.
🎨 Visual Cues That Matter
Green Fill – Trend is up, both MAs agree
Red Fill – Trend is down, both MAs agree
Gray Fill – No-trade zone, MAs disagree
This makes it easy to:
Avoid choppy markets
Stay aligned with the dominant trend
Spot early trend shifts
⚙️ Settings That Matter
Adjust CoRa Wave length and smoothness
Tune RSS_WMA to track price with minimal lag
Customize colors, line widths, and visibility
🧩 Best Combinations with This Indicator
We pair the Magic Ribbon with:
Structure Tools – BOS/CHOCH for context
MACD 4C – For momentum confirmation
Volume Profile – To validate breakout strength
Fair Value Gaps (FVGs) – For sniper entries
⚠️ What to Watch Out For
This is a confirmation tool , not a signal generator. Use it with structure and price action. Always backtest and adjust settings to your asset and timeframe.
🚀 Final Thoughts
If you want a clean, intuitive way to stay on the right side of the trend, the RedK Magic Ribbon is a powerful visual ally. It helps you avoid indecision and focus on high-probability setups.
What really sets the Magic Ribbon apart is the precision of its fast line—the CoRa Wave. It reacts swiftly to price action and often aligns almost perfectly with pivot reversals. This responsiveness allows traders to spot potential turning points early, giving them a valuable edge in timing entries or exits. Its accuracy in identifying momentum shifts makes it not just a trend filter, but a powerful tool for anticipating market moves with confidence.
Try it, tweak it, and let the ribbon guide your trades.

COOKIE Looks Bullish (1D)We have a good setup on the chart. A bullish CH has formed, the trigger line has been broken, and the price is currently sitting on a support level.
The green zone has been tested twice and rejected, which has strengthened the bullish outlook for this asset.
The main supply zone is marked in red. It is expected that, with price fluctuations, the asset will reach the red zone in the coming days or weeks.
A daily candle closing below the invalidation level would invalidate this analysis.
For risk management, please don't forget stop loss and capital management
Comment if you have any questions
Thank You
