EUR/JPY For Bullish as pull-backwait for pull-back near by entry point and then go long
general trend is down trend
current phase is pull-back
have fun :)
Pivot Points

EUR/NZD For Bullishgo long now
or
wait for pull-back near by entry point and then go long
general trend is down trend
current phase is pull-back
have fun :)

AUD/NZD For Bullishwait for pull-back near by entry point and then go long
general trend is up trend
have fun :)

HAEDAL Analysis (4H)The HAEDAL correction has started from the point marked with the red arrow on the chart.
This correction appears to be a diametric pattern. The green zone is where the price correction may complete, and the price could enter wave F.
The targets are marked on the chart.
A daily candle closing below the invalidation level will invalidate this view.
For risk management, please don't forget stop loss and capital management
Comment if you have any questions
Thank You


Decoding Momentum with Precision: Absolute Strength HistogramMomentum is more than just a buzzword—it’s the pulse of price action. The Absolute Strength Histogram v2 is a powerful open-source indicator that brings that pulse to life, helping traders visualize the ongoing tug-of-war between bulls and bears with clarity and precision.
In this post, we’ll explore how this tool works, how we use it at Xuantify, and how you can integrate it into your own trading strategy to sharpen your edge.
🔍 What Is the Absolute Strength Histogram ?
Originally developed by jiehonglim , this indicator is a refined version of the classic Absolute Strength Histogram. It measures the relative strength of buyers and sellers and plots it as a color-coded histogram.
Key Features:
Color-coded bars to reflect bullish or bearish dominance
Clear visual cues for trend strength and exhaustion
Helps identify trending vs. ranging market conditions
Open-source and customizable
Unlike traditional oscillators, this histogram doesn’t just show overbought or oversold—it shows who’s in control , and how strongly.
🧠 How We Use It at Xuantify
At Xuantify, we use the Absolute Strength Histogram as a momentum confirmation tool within our multi-layered trading models. Here’s how:
1. Trend Confirmation
We look for alignment between price structure and histogram color. For example, if price breaks structure to the upside and the histogram turns green and rising, that’s a strong confirmation of bullish momentum.
2. Divergence Detection
When price makes a new high but the histogram prints a lower high, it signals momentum divergence —a potential early warning of reversal.
3. Range Filtering
Flat or alternating histogram bars often indicate a ranging market . We avoid trend trades during these periods and instead look for mean-reversion setups.
🧩 New: Pivot High/Low Overlay for Reversal Clarity
To make the Absolute Strength Histogram even more actionable, we’ve added a custom Pivot High/Low indicator that visually marks key swing points on the chart. This addition helps traders clearly see how the histogram behaves before, during, and after reversals .
Below an example of HTF 4H used as stronger trade confirmation:
Why this matters:
It highlights where momentum shifts align with structural turning points
It helps validate divergence signals from the histogram
It makes backtesting and visual analysis much easier
How to use it:
Watch for histogram color or slope changes near pivot highs/lows
Look for divergence between price and histogram at these pivots
Use the pivot zones as potential entry or exit points when confirmed by momentum
🔄 Does It Repaint?
One of the most common concerns with momentum indicators is whether they repaint —meaning they change past values based on future price action. The Absolute Strength Histogram is designed to be non-repainting .
Once a histogram bar is printed, it remains fixed, making it suitable for real-time decision-making and reliable backtesting . This gives traders confidence that what they see on the chart is what actually happened in the moment—not a hindsight illusion.
⚙️ Settings That Matter
The indicator comes with several adjustable parameters, but one of the most impactful is the “Indicator Method” setting.
Our recommendation:
Set Indicator Method = STOCHASTIC for smoother, more responsive signals
This setting tends to reduce noise and better capture momentum shifts
It works especially well in combination with structure-based entries
Other useful settings include:
Length – Controls the sensitivity of the histogram
Smoothing – Helps reduce choppiness in volatile markets
Color thresholds – Customize visual cues for easier interpretation
⚙️ Best Combinations with This Indicator
To maximize its effectiveness, we combine the Absolute Strength Histogram v2 with:
Market Structure Tools – Like BOS/CHOCH from LuxAlgo Smart Money Concepts
Volume Profile – To confirm strength around key volume nodes
Fair Value Gaps (FVGs) – For precision entries when histogram confirms direction
RSI or Stochastic – For additional momentum or exhaustion confirmation
This layered approach helps us filter out noise and focus only on high-conviction trades .
⚠️ What to Watch Out For
No indicator is perfect. The Absolute Strength Histogram can sometimes lag slightly in fast-moving markets. It’s best used as a confirmation tool , not a standalone signal generator.
Also, in low-volume or choppy conditions, the histogram may give mixed signals. Always combine it with structure and context.
🚀 Final Thoughts
The Absolute Strength Histogram is a clean, intuitive, and powerful tool for traders who want to see momentum clearly . Whether you’re a trend trader, scalper, or swing strategist, this indicator can help you stay on the right side of the market.
At Xuantify, we’re all about combining simplicity with precision. This tool fits that philosophy perfectly.
Add it to your chart, test it, and see how it sharpens your edge.

Ethereum’s Hidden Bullish Trap: A Technical Breakout to $15K Hello Traders 🐺
ETH — the biggest crypto out there after BTC itself...
You already know my personal opinion on it. However, I really need to talk about it once again to update you, my dear audience, and share the facts that are sleeping on the chart.
As you can clearly see, we had a massive shakeout during the Black Monday, which now seems to be turning into one of the rarest patterns — and one of the most powerful bear traps — I’ve ever seen for ETH.
You know why? Let me break it down for you:
Usually, after Phase 1 during a bull market, ETH starts to show strength against BTC — which is quite normal, as it marks the beginning of the Altcoin Season. ETH, being the leader, attracts most of the capital.
But before Phase 2 (ETH Season) kicks off, ETH often consolidates and starts to accumulate in a bullish pattern. In this case, we have a bullish triangle pattern with a wick below the support line — a classic bear trap — which makes it even more bullish to me.
If ETH can break above the current ATH (~$4700) and push through the key resistance line, we could witness a massive run-up to new highs, in my opinion somewhere between FWB:12K to $15K 🚀
I hope you enjoyed this idea — and as always, don’t forget our golden rule:
🐺 Discipline is rarely enjoyable, but almost always profitable. 🐺
🐺 KIU_COIN 🐺

VRNA Likely Wyckoff Distribution with Topping pattern - SHORT!VRNA has had a Parabolic Run higher with Price > 2 Standard Dev from Mean for 11 WEEKS before showing weakness and Selling to $48 range. Price is forming a pretty picture perfect WYCKOFF Distribution. I believe we have just had the UTAD (Up Thrust After Distribution) Likely, we have lower prices in store.
Target Price $41.36.
Trade what you see.

Btc fib levels Added old level i deleted 107166 107361 we got the pullback let's see how high we push up we need to close above 107166 and we will test 107727

BTC fib levels Btc is holding levels 106749 we are back to barley charted territory so 107727 is resistance so we will see pullback if we touch if we can stay above 106057 after we will continue to uptrend still looking for 111111.11 my levels are some of the best lol

SHIB – Long Here, Aiming for 50% Upside
Time to go long on CRYPTOCAP:SHIB and ride this wave.
Doesn't look like it's going much lower—I was hoping to grab some a bit deeper into the green zone, but that might’ve been too picky.
Stepping in with a decent-sized position here. Will add more if it dips.
Planning to hold through June, market conditions permitting. First target: +50%.
BINANCE:SHIBUSDT

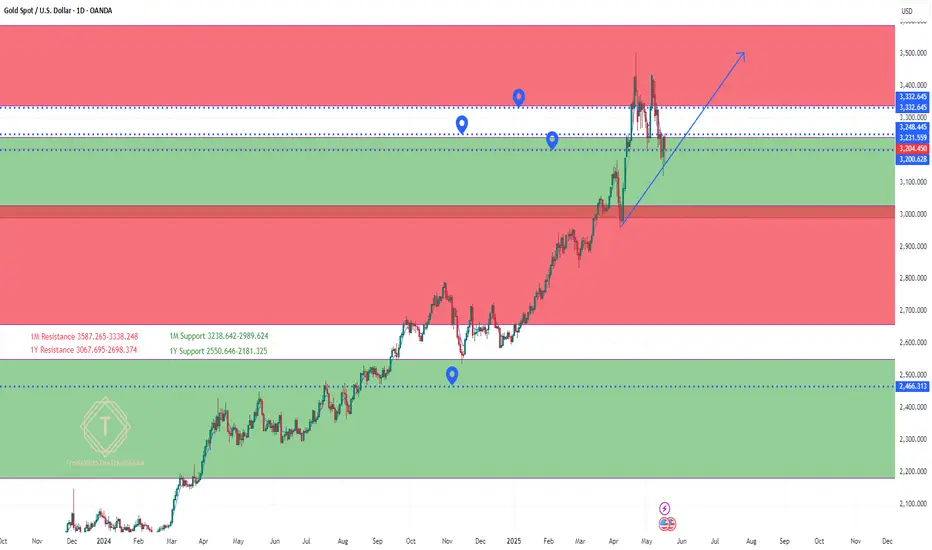
Gold Weekly Forecast: XAU/USD Outlook for May 18–24, 2025Hello,
📅 Gold (XAU/USD) Weekly Outlook – May 18–24, 2025
Current Price: $3,203.47
RSI (1D): 53.54 → Neutral
✅ Base Case: Mild Bullish / Range-Bound
📈 Bias: Neutral to Bullish
🎯 Target Range: $3,230 – $3,280
📊 Probability: ~65%
Gold is consolidating above prior breakout levels with neutral momentum (not overbought). This suggests more upside is possible unless bearish catalysts emerge.
🔍 Key Support & Resistance Levels
Support 1: $3,170 – $3,160 (prior breakout zone, likely defended)
Support 2: $3,120 – $3,100 (deeper dip buy zone)
Resistance 1: $3,230 – $3,250 (minor ceiling — likely tested soon)
Resistance 2: $3,280 – $3,300 (bullish extension target)
📊 Weekly Scenarios
1. Mild Bullish / Sideways (Base Case)
🟢 Probability: 65%
🔁 Price holds above $3,160
🎯 Target: $3,230 – $3,280
2. Bullish Breakout
🟡 Probability: 20%
🚀 Trigger: Geopolitical risk or Fed dovish shift
🎯 Target: $3,300+
3. Bearish Pullback
🔴 Probability: 15%
❌ Trigger: Strong USD, hot data, or yield spike
🎯 Target: $3,160 → $3,100
🧭 Trade Idea (Example Strategy)
Long Entry: Around $3,170
Stop Loss: Below $3,145
Take Profit: $3,230 / $3,280
Risk/Reward: Favorable if price holds support
The Support and Resistance outlined in green and red are the respective support/resistance for this pair currently for 1M-1Y timeframes!
No Nonsense. Just Really Good Market Insights. Leave a Boost
TradeWithTheTrend3344
Exposing Price Inefficiencies: The Role of Fair Value Gaps (FVG)In the ever-evolving landscape of price action trading, one concept has gained significant traction among institutional and retail traders alike: Fair Value Gaps (FVGs) . At Xuantify, we believe that understanding market inefficiencies is key to anticipating high-probability setups—and FVGs offer just that.
🔍 What Is a Fair Value Gap?
A Fair Value Gap is a price imbalance that occurs when the market moves too quickly in one direction, leaving behind a "gap" in liquidity. This typically happens during high volatility or news-driven events, where price skips over levels without sufficient buying or selling.
In technical terms, an FVG is identified when a candle’s low (in a bullish move) or high (in a bearish move) does not overlap with the previous or next candle. This creates a three-candle structure :
- Bullish FVG : Candle 1 (bearish), Candle 2 (strong bullish), Candle 3 (bullish or neutral)
- Bearish FVG : Candle 1 (bullish), Candle 2 (strong bearish), Candle 3 (bearish or neutral)
These gaps often act as magnets for price , as the market seeks to rebalance and fill the inefficiency.
🧠 Why Do FVGs Matter?
FVGs are not just visual anomalies—they represent institutional footprints . When large orders are executed, they often cause price to move rapidly, leaving behind unfilled orders. Smart money tends to revisit these zones to complete their positions.
Key Benefits of Trading FVGs:
- ✅ High-probability entries: Price often returns to fill the gap before continuing its trend.
- ✅ Clear invalidation levels: The edges of the gap provide natural stop-loss zones.
- ✅ Works across timeframes: From scalping on the 1-minute to swing trading on the daily.
🧩 Using the “Fair Value Gap ” Indicator
To simplify the process of identifying and trading FVGs, we recommend the Fair Value Gap indicator on TradingView. This tool automatically highlights bullish and bearish FVGs, tracks their mitigation, and even provides alerts when gaps are filled.
Key Features:
- Auto-detection of bullish and bearish FVGs
- Mitigation tracking: See which gaps are filled and which remain open
- Threshold filtering: Focus on significant gaps by adjusting the minimum size
- Dynamic mode: Monitor evolving FVGs in real time
- Alerts: Get notified when price fills a gap
💡 No Repainting, No Delays
One of the most reassuring aspects of this indicator is that it does not repaint . Once a fair value gap is printed, it stays on the chart—no disappearing zones, no misleading signals.
Even better, the indicator plots FVGs in real time . It uses a three-candle structure and confirms the gap immediately after the third candle closes . This means you’re seeing valid, actionable gaps as they form—not in hindsight.
This makes the LuxAlgo FVG tool a reliable companion for both live trading and backtesting , giving traders the confidence that what they see is what the market actually delivered.
How to Use It:
1. Add the indicator : Search for “Fair Value Gap ” in the TradingView Indicators tab.
2. Adjust settings :
- Use the “Threshold %” to filter out smaller, less relevant gaps.
- Enable “Mitigation Levels” to track filled gaps.
- Use “Auto Threshold” for adaptive filtering based on volatility.
3. Trade setups :
- Contrarian : Wait for price to fill a gap and look for reversal signals.
- Trend-following : Enter trades in the direction of the gap when it forms.
⚠️ FVGs Are Not Always Honored
While FVGs offer powerful insight into market inefficiencies, it's important to remember: they are not guaranteed reversal or continuation zones . Sometimes price will blow right through a gap without reacting—especially in trending or news-driven markets.
Why this happens:
The gap may have already been mitigated on a lower timeframe
Strong momentum or macroeconomic catalysts override technical zones
The FVG is too small or lacks confluence with other key levels
How to manage this:
Always combine FVGs with structure, liquidity, and volume
Use alerts and confirmations (e.g., candle patterns or BOS/CHOCH)
Avoid trading FVGs in isolation—context is everything
🧠 Best Indicator Combinations with FVG
To increase the accuracy of FVG-based setups, we recommend combining the LuxAlgo FVG indicator with the following tools:
1. Market Structure (LuxAlgo Smart Money Concepts)
Identify breaks of structure (BOS) or change of character (CHOCH) near FVGs. Use structure shifts to confirm whether the FVG is likely to hold or fail.
2. Volume Profile or Session Volume
Confirm FVGs with low-volume nodes or volume gaps . FVGs aligning with volume imbalances are more likely to be respected.
3. Order Blocks
Look for FVGs that overlap with bullish or bearish order blocks . This confluence often signals institutional accumulation or distribution.
4. Relative Strength Index (RSI) or Stochastic
Use momentum indicators to confirm exhaustion or continuation near FVGs. For example, a bullish FVG + oversold RSI = potential long setup.
5. Liquidity Zones (Equal Highs/Lows, Swing Points)
FVGs near liquidity pools are often targeted before reversal. Combine with sweep setups for sniper entries.
Here’s a new section you can add to your blog post, focusing on the power of **Multi-Timeframe (MTF) FVG Alignments**:
🧭 Multi-Timeframe FVG Alignments
One of the most powerful ways to increase the reliability of Fair Value Gaps is by using multi-timeframe confluence . When FVGs align across different timeframes—say, a 1H FVG inside a 4H FVG zone—it often signals a high-probability reaction area .
Why it works:
Higher timeframe FVGs represent broader institutional imbalances
Lower timeframe FVGs offer precise entries within those zones
Alignment confirms that multiple layers of market participants are active in the same area
How to use it:
Start with a higher timeframe (e.g., 4H or Daily) and mark key FVGs
Drop to a lower timeframe (e.g., 15M or 1H) and look for fresh FVGs forming inside the higher zone
Wait for structure shifts or liquidity sweeps within the lower timeframe FVG before entering
This technique is especially effective when combined with tools like LuxAlgo Smart Money Concepts and Volume Profile , helping you time entries with sniper-like precision while staying aligned with the broader market narrative.
📊 Backtest It Yourself
FVGs are best understood through chart time . Load up your favorite pair on TradingView, activate the LuxAlgo FVG indicator, and observe how price reacts. You’ll be surprised how often these zones act as support, resistance, or launchpads for major moves.
🚀 Final Thoughts
Fair Value Gaps are more than just a buzzword—they’re a window into how smart money operates. By incorporating FVGs and tools like the LuxAlgo indicator , you gain a deeper understanding of market dynamics and a sharper edge in execution.
At Xuantify, we’re committed to decoding institutional logic and bringing it to the retail trader. Stay tuned for more insights, and as always— trade smart, not hard .

GBP/AUD For Bullish as pull-backwait for pull-back near by entry point and then go long
general trend is down trend
current phase is pull-back
have fun :)

EUR/AUD For Bullish as pull-backwait for pull-back near by entry point and then go long
general trend is down trend
current phase is pull-back
have fun :)

USDCHF 1hr Trade ideaWe have a Daily liquidity sweep and a 1hr sweep to confirm the direction of the price. Targeting liquidity at previous high for first TP and for second TP would be the gap or fvg
(price level: 0.83786) .

Bitcoin Hourly Analysis (2H)Given Bitcoin's rapid movement near previous highs, along with quick pump-and-dump action and liquidity grabs, it's expected that the liquidity pool below the price will be swept, collecting orders from the green zone, and then price may reverse back to the upside.
A 4-Hour candle closing below the invalidation level will invalidate this analysis.
For risk management, please don't forget stop loss and capital management
Comment if you have any questions
Thank You

GJ| gearing up for the smackdown.Entry loading..... don't blink.
Price dancing near the zone.... just waiting on that tap so we can rip through 30M highs. Precision only.
Bless Trading!

EURUSD| Locked in on the SetupPatience is power. EU already did the heavy lifting.
Structure's set, liquidity handled, handled, and now I'm just waiting on price to that order block in discount on the LTF.
Once that entry lines up?
Boom- TP, I'm coming for you.
Simple logic. real precision.
I don't chase price - I let it walk right into my trap.
Bless Trading!

XAUUSD| Precision Entry OnlyUhhhh..... yeah, I'm actually already in this trade lol. Marked up that 4H shift early, saw the intent clear as day. Price pulled right into my killzone.
Dropped to 30M, caught shift, waited for confirmation, and took the short like a sniper.
This ain't luck. This is logic, structure, timing. Inducement? Checked. Execution? Smooth.
Welcome to the other side of trading.
Bless Trading!

USDJPY| Momentum Shift in MotionCaught that 4H Lower High flip, shifting structure bullish and throwing a big signal-we might be running it up.
Zoomed into the 30M to catch the continuation move. Refined structure showing its hand. Now it's all about patience...
I'm letting that internal order flow do its thing. Just waiting on the right area to get tapped for my next execution.
No hype. Just flow. I don't chase- I wait for price to clock in and pay me.
Bless Trading!

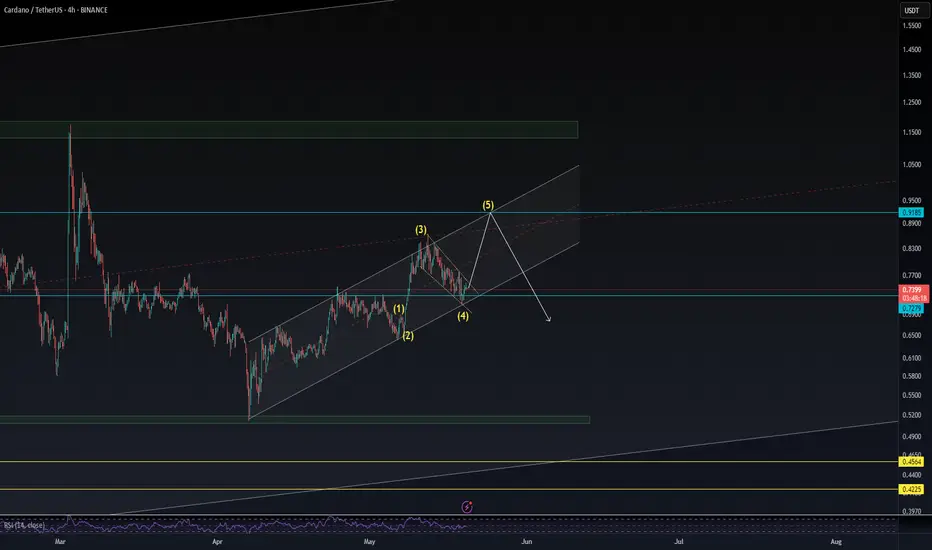
ADAUSDT🔹 Cardano (ADA) Technical Analysis
📅 Date: May 19, 2025
Cardano is currently moving within a medium-term ascending channel. After the second touch of the channel’s lower boundary, the price initiated a 5-wave impulsive structure. Wave 4 has retraced precisely 0.618 of waves 1 through 3 and coincides with the bottom of the channel — a zone that also reflects a Change of Polarity, where former resistance is now acting as solid support.
Currently, wave 5 is developing, but the bullish momentum appears weaker compared to the preceding bearish leg — a possible indication of buyer exhaustion. Interestingly, the projected end of wave 5 aligns with the 0.618 retracement level of the prior decline and overlaps with the Pivot Point R2 zone, which could serve as a strong resistance area.
Based on this setup — and with strict risk management in place — I’ve entered a long position with the stop-loss placed just below the tip of wave 1. Cardano remains one of my preferred crypto assets, and this pattern may offer a promising bullish continuation opportunity.
📈 Disclaimer: This analysis is for educational purposes only and does not constitute financial advice.
GU| Patiently Watching This Setup Cook4H gave me the (BOS) break of structure to the downside - that's my bearish intent on the higher timeframe. Price could climb into the supply zone above before delivering that reversal.
Dropped to the 30M, structure is still bullish for now, showing strong momentum. Now it's a waiting game... Do we dip to take out that sell-side liquidity (SSL) for a clean buy setup first? Or... are we already mitigating the 4H supply and about to print a bearish shift on 30M?
Either way, I'm letting price tell me the truth. No chasing. No guessing. Just real logic with structure & inducement flow.
Stay sharp.
Bless Trading!
