INIT – Missed the Move, Still Watching
Missed the entire move on INIT, but I still see a possible entry.
Will be waiting for prices closer to $1 in the coming weeks.
If it keeps pushing higher, I’ll just sit back and let it go. No chase here.
Pivot Points

EIGEN – Chasing Strength Over PerfectionDoubt I’ll see BINANCE:EIGENUSDT back below $1—so here’s my take:
Risk/reward isn’t ideal at this level, but there’s a clear chance of continuation, and this isn’t one I want to miss.
Buying a small bag now, with plans to add in the green zone if it dips. While a revisit to the Monthly Open is unlikely, that area could be tested if the market cools off.
Leaning more toward higher prices than a retrace—for now.

ADA bulling :)📈 ADA/USDT 4H Analysis
ADA has broken above the 0.7408 resistance, now at 0.78150, showing strong bullish momentum within an ascending channel, targeting higher levels if the trend holds.
🟢 Support Levels:
🔹 0.7220 – recent breakout zone (20/50 EMA)
🔹 0.6630 – key support
🔹 0.6230 – deeper support
[ *]🔴 Resistance Levels:
🔹 0.8430 – next target
🔹 0.9670 – major resistance zone

BMT Rebuy Setup (4H)After the heavy drop in BMT, the price is now approaching demand zones.
If it reaches the green zone, we can consider entering a buy position there.
Risk and capital management should not be forgotten.
Targets are marked on the chart. A daily candle closing below the invalidation level will invalidate this analysis.
For risk management, please don't forget stop loss and capital management
When we reach the first target, save some profit and then change the stop to entry
Comment if you have any questions
Thank You

EUR/CHF For Bullishwait for pull-back near by entry point and then go long
general trend is up trend
have fun :)

WTI Update | Oil CrashSince the last update we were able to perform about two to three swing trades. One from $70 - $79, and from $79 to $68. The next move I'm looking for is another short position from current market price ~($62) to swing to the next major low $33.
We saw a rejection last week and we're currently pulling back to retest the little selloff we had.
Could say this next local move will look to selloff mid week making its way back to $57 which would be a nice short term swing.
The $33 target would be the long term swing of course and moving on I would like to see a break below $57 and a retest.

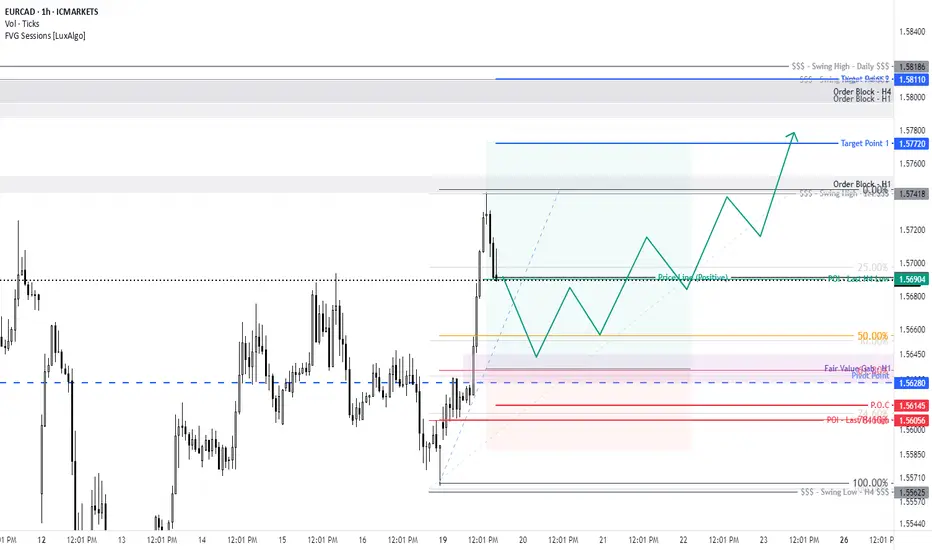
AUD/CAD For Bullishwait for pull-back near by entry point and then go long
general trend is up trend
have fun :)

GBP/CAD For Bullishyou can go long now
or
wait for pull-back near by entry point and then go long
general trend is up trend
have fun :)

EUR/JPY For Bullish as pull-backwait for pull-back near by entry point and then go long
general trend is down trend
current phase is pull-back
have fun :)

EURUSD: Support & Resistance Analysis For This Week 🇪🇺🇺🇸
Here is my latest support and resistance analysis for EURUSD.
Resistance 1: 1.1250 - 1.1295 area
Resistance 2: 1.1368 - 1.1381 area
Resistance 3: 1.1420 - 1.1427 area
Resistance 4: 1.1510 - 1.1574 area
Support 1: 1.1051 - 1.1093 area
Support 2: 1.1085 - 1.1089 area
Support 3: 1.1073 - 1.1078 area
Consider these zones for pullback/breakout trading.
❤️Please, support my work with like, thank you!❤️
I am part of Trade Nation's Influencer program and receive a monthly fee for using their TradingView charts in my analysis.

EUR/CAD For Bullish as pull-backwait for pull-back near by entry point and then go long
general trend is up trend
current phase is pull-back
have fun :)
Wyckoff Distribution Unfolding: UTAD Confirmed, LPSY In ProgressThe 4H BTC/USDT chart presents a textbook Wyckoff Distribution structure nearing completion:
• Buying Climax (BC) defined the supply ceiling
• Secondary Test (ST) confirmed resistance zone
• Upthrust After Distribution (UTAD) swept above 106K, trapping late breakout buyers
• Price is now back at triangle support, potentially forming Last Point of Supply (LPSY)
Technical Snapshot (4H):
• Current Price: 102,540
• Bollinger Bands:
▸ Upper: 105,400
▸ Basis: 103,522
▸ Lower: 101,884
• 55 SMA: 103,642
• RSI: 44.85 (bearish momentum)
• Volume: Red bars rising, above 23.7K MA
What to Watch For:
A confirmed close below the triangle apex and lower Bollinger Band, with RSI below 45 and increased volume, would solidify the LPSY and trigger a likely markdown phase. Until then, the structure remains vulnerable but unconfirmed.
Bearish Targets (if breakdown confirms):
• TP1: 100,678 (horizontal + psychological)
• TP2: 99,595–98,115 (Fib retracement zone)
• TP3: Trail below breakdown with 1% callback logic
Wyckoff Perspective:
This appears to be Phase C, following a clear UTAD. If LPSY forms and support breaks, the market transitions into Phase D with accelerated markdown potential. Holding here may imply range extension or reaccumulation — next 1–2 candles are pivotal.

ETHEREUM New Update (1D)Ethereum has reclaimed the flip zone, but it hasn't tested this area or made a proper pullback yet.
It's expected that this zone will be tested before the price moves toward higher targets.
If we see a strong reaction around the green zone, we can look for potential buy/long positions.
A daily candle closing below the invalidation level would invalidate this analysis.
For risk management, please don't forget stop loss and capital management
When we reach the first target, save some profit and then change the stop to entry
Comment if you have any questions
Thank You

DHANI SERVICES MAY GIVE BREAKOUT SOONDhani Services is an Indian consumer business that operates through its app, Dhani. It provides a range of services, including digital healthcare, financial services, e-commerce, UPI payments, stock trading, and bill payments. The company was originally founded as Indiabulls Ventures Limited in 1995 but was later renamed Dhani Services Limited in October 2020.
SHORT TERM MAY TOUCH 69 TO 72 MARK.

Key Levels for the Week 19-25/05/2025 ∷BitCoin∷🐍 Key Levels Overview for the Week🐍
__________________________
Resistances🔀 107397 , 114115 , 117344 , 124086
Mids∷∷∷ 101045 , 106675 , 108456 , 114878
Supports🔀 110275 , 101388 , 99326 , 88341
Trend Base Lines
108442🐂113313🐂113737🐂119204
105301🏛107030🏛107311🏛111272
104554🐻101465🐻100878🐻99353

$BTC up to $107-108k?While I do think CRYPTOCAP:BTC will ultimately still see a larger correction, I can't deny that the chart looks bullish here.
I think we're likely to see a final move over the next week or two up to $107k-108k to retest the prior highs. I think the middle resistance at $108,183 is the most likely target for the move.
After we hit that, that's where I'll start to position short on BTC.
Let's see how it plays out over the next week or two.

AI16ZUSDT – Setting Up Like PEPE - 3x Potential!Given recent market behavior and the strength behind some reversals, I’m expecting COINEX:AI16ZUSDT to follow a similar path.
Picked up a small bag here—will look to add either above the orange line or on a retest of the Monthly Open.
Structurally, this setup reminds me a lot of $PEPE.

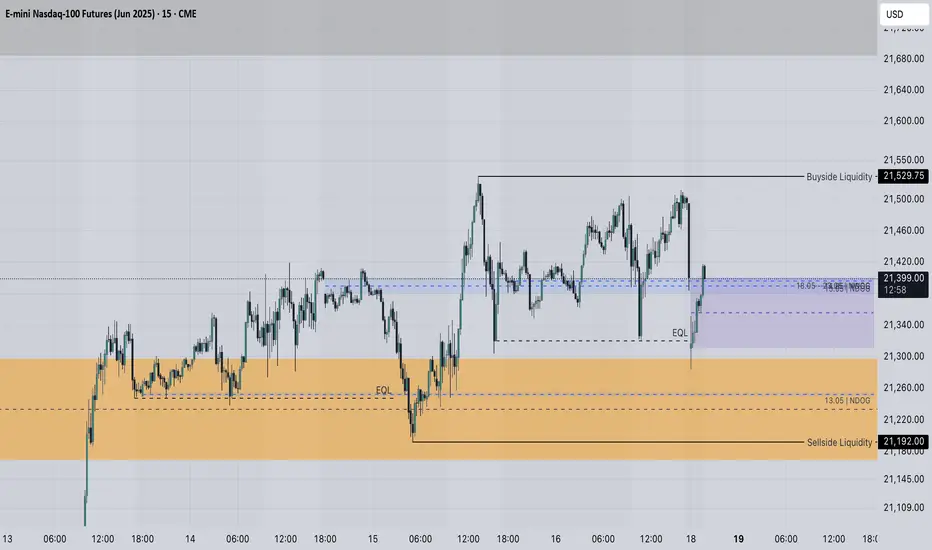
NQ localI think we have done enough work on the current levels as mentioned in the previous daily analysis, we opened today(on sunday) disrupting the relative equal lows which could be used for accumulation of the buy orders.
If so then we would not need to reach out for the sellside marked in the lower part of the current daily ifvg, and we would probably look for higher prices and buyside delivery, in case we break out lower part of the daily ifvg I think we can have the lower prices, where it will balance through the previously left imbalances in the range
Unlocking Market Cycles with the RSI Cyclic Smoothed IndicatorIntro
In the world of technical analysis, the Relative Strength Index (RSI) is established. However, the RSI Cyclic Smoothed indicator takes this classic tool to the next level by incorporating cyclic smoothing and dynamic bands. This post will explore the features, configuration, and practical applications of this powerful indicator.
What is the RSI Cyclic Smoothed Indicator ?
The RSI Cyclic Smoothed indicator is an advanced version of the traditional RSI. It enhances the classic RSI by adding cyclic smoothing and cyclic memory, allowing it to better adapt to market cycles and provide more accurate signals.
Dynamic Bands
One of the standout features of the RSI Cyclic Smoothed indicator is its dynamic bands. These bands adjust automatically to the asset’s cyclical levels, providing clearer signals in varying market conditions. The adaptive upper and lower bands help traders avoid whipsaw trades and identify overbought and oversold conditions more effectively.
What kind of indicator is it ?
The RSI Cyclic Smoothed indicator falls into the category of oscillators. Oscillators are technical analysis tools that vary over time within a banded range, typically used to identify overbought and oversold conditions.
Leading or Lagging ?
The RSI Cyclic Smoothed indicator is primarily a lagging indicator. It smooths the RSI data to reduce noise and provide more reliable signals, but it does not predict future price movements.
Key Features
Cyclic Smoothing: Reduces noise and enhances signal accuracy.
Dynamic Bands: Adaptive upper and lower bands that adjust to market cycles.
Cyclic Memory: Uses the dominant cycle length to optimize signal accuracy.
Benefits Compared to Normal RSI
Enhanced Signal Accuracy: The cyclic smoothing reduces noise and false signals, providing more reliable trading signals.
Adaptability to Market Cycles: The cyclic memory allows the indicator to adapt to the dominant market cycle, making it more responsive to cyclical changes.
Dynamic Bands: Unlike the fixed levels in normal RSI, the dynamic bands adjust to market conditions, offering better identification of overbought and oversold levels.
Reduced Whipsaw Trades: The smoothing process helps avoid the frequent false signals that can occur with the normal RSI, especially in volatile markets.
Indicator Configuration
Configuring the RSI Cyclic Smoothed indicator involves setting the dominant cycle length and adjusting the smoothing parameters. The key parameters include:
Dominant Cycle Length: Defines the duration of the dominant market cycle.
Smoothing Factor: Reduces fluctuations and noise.
Cyclic Memory: Stores the indicator’s history to calculate dynamic reference levels.
Ideal settings vary based on market conditions, but a common approach is to start with a dominant cycle length that matches the asset’s typical cycle and adjust the smoothing factor to balance responsiveness and noise reduction.
Enhancing Signal Accuracy with a Trend Indicator
To enhance the accuracy of signals generated by the RSI Cyclic Smoothed indicator, it can be used in conjunction with trend indicators. Examples of trend indicators include:
Moving Averages: Simple Moving Average (SMA) and Exponential Moving Average (EMA) are widely used to identify trend direction.
MACD: Moving Average Convergence Divergence helps reveal both direction and underlying momentum.
ADX: Average Directional Index measures the strength of a trend.
Combining these tools helps confirm signals and reduce false positives.
MTF Chart Setup
Below is an example chart showcasing the RSI Cyclic Smoothed indicator in action. The chart highlights trading signals where the signal line crosses above or below the adaptive bands, providing clear entry and exit points. Below are the 1H, 2H and 4H overbought aligned.
Alternatives
While the RSI Cyclic Smoothed indicator is powerful, there are other alternatives that also focus on overbought and oversold conditions:
Stochastic Oscillator: This indicator measures the level of the closing price relative to the range of prices over a certain period. It identifies overbought and oversold conditions with key levels below 20 (oversold) and above 80 (overbought).
Williams %R: Similar to the Stochastic Oscillator, Williams %R compares the closing price to the high-low range over a specified period. It indicates overbought conditions above -20 and oversold conditions below -80.
CCI (Commodity Channel Index): The CCI measures the deviation of the price from its average price over a given period. It identifies overbought conditions above +100 and oversold conditions below -100.
Bollinger Bands: While not an oscillator, Bollinger Bands can be used to identify overbought and oversold conditions when the price touches the upper or lower band.
Additional Insights
The RSI Cyclic Smoothed indicator is highly responsive to market moves and can be fine-tuned to match the dominant cycle of the asset being analysed. For more in-depth information, refer to Chapter 4 of "Decoding the Hidden Market Rhythm, Part 1".
Practical Tips
Combine with Trend Indicators: Use the RSI Cyclic Smoothed indicator alongside trend indicators to confirm signals.
Adjust Cyclic Parameters: Fine-tune the cyclic parameters to match the market conditions and dominant cycle.
Monitor Dynamic Bands: Pay close attention to the adaptive bands for overbought and oversold signals.
Backtest Thoroughly: Before using the indicator in live trading, backtest it on historical data to understand its performance and adjust settings accordingly.
Stay Updated: Market conditions change, so periodically review and adjust the indicator settings to ensure they remain optimal.
Which Securities Does This Apply For?
The RSI Cyclic Smoothed indicator can be applied to a wide range of securities, including: Stocks: Useful for identifying cyclical patterns and overbought/oversold conditions in individual stocks. ETFs: Effective for analyzing exchange-traded funds, especially those tracking cyclical sectors. Forex: Valuable for currency pairs, helping traders identify market cycles and potential reversals. Commodities: Applicable to commodities like gold, oil, and agricultural products, where cyclical movements are common. Cryptocurrencies: Can be used to analyze digital assets, providing insights into cyclical trends and volatility.
Conclusion
The RSI Cyclic Smoothed indicator is a powerful tool for traders looking to enhance their technical analysis. By incorporating cyclic smoothing and dynamic bands, it provides clearer and more accurate signals, helping traders navigate complex market cycles.

ZRO (LayerZero) Fresh coin. 19 05 2025Logarithm. Time frame 3 days. The creators of the cryptocurrency "threw" a huge number of their flock, and distributed an airdrop of "pennies", thereby reducing the price burden on themselves in the bearish trend of altcoins. Therefore, this cryptocurrency, unlike others, has a stronger chart, and the decline was only -80%. This is quite small, considering that the capitalization is in 170th place at the moment.
I specifically superimposed 2 channels on top of each other, ascending and descending. There were a lot of lines, but these dynamic support / resistance will be felt by the price in the future.
🟣 Now a triangle is being formed locally , it rested against the downward local trend, from its breakthrough / non-breakthrough, and depends on which global channel the market will be pulled on an average urgent basis. Sorry, the price of this cryptocurrency.
🟢 Local targets of the triangle , which can become an ascending pennant are shown on the chart.
🔴 Also, a descending target is shown, if the trend is not broken and the triangle works down.
Fundamental (not a legend). LayerZero supports any blockchain that can run smart contracts, such as Ethereum, BNB Chain, Avalanche, Polygon, Arbitrum, Optimism, Fantom and other chains. LayerZero also supports non-EVM chains, such as Aptos. These so-called omnichain applications should become a key layer of the multi-chain future, where different blockchains interact simultaneously.
It is worth noting that the fundamental does not really matter, and cryptocurrencies move (rationality of creators and market maker + real supply/demand) in accordance with the market as a whole, with very rare exceptions, which, as a rule, have a manipulative nature and a very short time.
Also, it is worth noting that when the altseason begins, this cryptocurrency can be greatly pumped up, given the emission of cryptocurrencies in one hand, and the real demand in the future for this protocol for different blockchains.

GOLD NEXT POSSIBLE MOVEOVERVIEW:
We are seeing signs of a potential trend reversal or major correction on Gold, with
clear structure shifts and bullish momentum building up after a deep corrective move
inside a larger descending channel. This plan is built around an entry from a key
demand zone formed after a break of structure (BOS) and mitigation of Fair Value
Gaps (FVGs) across multiple timeframes.
1. Market Story (Structure Summary)
Gold has been moving inside a downward sloping channel, defined by lower highs and
lower lows:
Trend Element Price Level
Reason
1st High (ATH)
2nd High
Lower Highs
Lower Lows
3500.20
3431.25
Start of macro descending
trendline
2nd touch, validating resistance
3412.02 → 3345.70 → 3240.13 Confirmed downtrend structure
3269.31 → 3201.43 → 3119.24 Bearish structure continuation
From this point, price found demand at 3119.24 and aggressively broke:
• Internal descending trendline (showing loss of bearish control)
• Previous structural resistance at 3191.00 (now support)
• Multiple Structure Shifts (SS) and a BOS, signaling a bullish transition
Summary: The downtrend structure is weakening. Price is breaking internal
resistances and making higher highs/lows.
2. Current Market Context – 30M Chart Breakdown
From your chart:
• After bottoming at 3119.24, price broke short-term structure (SS) → rallied →
pulled back to mitigate FVG at 3160–3175 zone.
• This mitigation created a strong Point of Interest (POI), aligned across 1H, 30M,
15M, 5M FVGs.
• The current retracement into that POI is setting up a bullish continuation.
Fair Value Gaps (FVGs) represent inefficient price movement (imbalances) that are
often filled before continuation. Once filled, they act as demand or supply.
3. Key Technical Zones & Why They Matter
Zone/Level Type
Why It Matters
3500.20
ATH
Long-term TP zone. Start of entire downtrend
3431.25
Macro Resistance 2nd touch of descending trendline
3343.05
Previous High
TP1 level. Strong reaction expected
3240.13 –
3260
Add Position Zone Previous internal resistance broken. Confirmed demand after
breakout
3175 – 3160 POI / Entry Zone
MTF FVG + demand + origin of last strong bullish leg
3119.24
SL Invalidation
Zone
Last lowest low. Break below here invalidates the setup
4. Execution Plan – How to Trade This Setup
Primary Entry (Buy Limit or LTF Confirmation):
• Entry Zone: 3175 – 3160 (POI)
• Confirmation Entry: Look for bullish price action on 5M–15M:
o Bullish engulfing candle
o Internal BOS on LTF
o Rejection wick from POI
• SL Options:
o Conservative: Below 3119.24 (hard invalidation)
o Aggressive: Below 3149.50, just under the POI
Scale-In/Add Zone:
• Price: 3240.13 – 3260
• Condition: Wait for a clean break and retest
• Why? This zone acted as strong resistance in the past and will confirm buyer
strength once retested successfully.
5. Target Levels (Profit-Taking Zones)
Target
Level
Reason
TP1
3343.05 First structure high
TP2
3431.25 Second macro trendline touch
TP3 (Final)
3500.20 ATH, end of descending channel
6. Risk-Reward Management
Strategy
Entry SL
Target
Conservative
e
RRR (TP1–TP3)
3165 3119.24 3343.05+ 3:1 to 6:1
Aggressive
3165 3149.50 3343.05+ 4:1 to 8:1
Only risk capital you're willing to lose
If POI fails and price breaks 3119.24 → invalidate the long bias
7. Confluences – Why This Trade Is Strong
• Multiple Structure Shifts (SS) confirmed bullish reversal
• Break of Structure (BOS) shows change in momentum
• FVG mitigation = smart money entry zone
• Internal trendline was broken = bearish structure failing
• Demand aligned across 4 timeframes (1H → 5M)
• Clean RRR for both conservative and aggressive styles

"BTC hit TP - exactly how I mapped it out."Patience, structure, and precision. I said what I said, drew what I drew, and price did exactly what I expected. No guessing, no hoping - just reading price and letting it come to me.
Too many traders chase candles. I waited for structure to align, watched price respect the levels I outlined, and took the trade when the market gave me confirmation.
This isn't luck - it's consistency through discipline and clarity.
+ TP smashed.
+ Structure respected.
+ Psychology intact.
Stay Sharp. Let price speak. Read it right, and it'll hand you what you're looking for.
#BTC #Bitcoin #SmartMoney #PriceAction #PatiencePays #inducementKing
Bless Trading!

IRON Main trend. Channel. 18 05 2025Logarithm. Time frame 1 week. Down from the listing price -98%. Dying asset. Suitable for pump/dump strategy work, without reference to the ticker name in the spot, with down-to-earth goals, but understanding the high volatility of these assets due to low liquidity (“dying assets”). Work without stops (they are destructive for such assets with such volatility), from the average price of the set/dump. It is advisable to work on a breakthrough of key zones (understanding the liquidity of the asset, and the amount of the entry amount).
Asset as an example, crypto wrappers of such liquidity and work on them now. There are thousands of similar ones on the crypto market. Therefore, there is no point in considering them separately. One similar one, projection - if not thousands of dying scams (created under the hype of the distribution of the last cycle), then hundreds.
🟢A “Dragon” pattern may form if the downward secondary trend is broken. More precisely, it will be broken if a short alt season starts now for alts. The target is in the previous consolidation zone, and to cross the dynamic resistance of the inner zone of the descending channel (zone of decreasing highs). It is rational to work for a breakthrough, understanding the liquidity of the dying asset.
🔴If the market is negative, then the rollback from this descending line will continue to the dynamic support of the channel in the designated zone. If below, then it is a scam and delists from other exchanges where it is traded.
