Wisetech Global Ltd Stock Quote | Chart & Forecast SummaryKey Indicators On Trade Set Up In General
1. Push Set Up
2. Range Set up
3. Break & Retest Set Up
Notes On Session
# Wisetech Global Ltd Stock Quote
- Double Formation
* (Anchored VWAP)) | Completed Survey
* Wave Feature - * ABC / Entry & Retest | Subdivision 1
- Triple Formation
* 29% Area & Gap Fill | Subdivision 2
* (TP1) | Subdivision 3
* Daily Time Frame | Trend Settings Condition
- (Hypothesis On Entry Bias)) | Indexed To 100
- Position On A 1.5RR
* Stop Loss At 85.00 AUD
* Entry At 100.00 AUD
* Take Profit At 122.00 AUD
* (Ranging Argument)) & No Pattern Confirmation
* Ongoing Entry & (Neutral Area))
Active Sessions On Relevant Range & Elemented Probabilities;
European-Session(Upwards) - East Coast-Session(Downwards) - Asian-Session(Ranging)
Conclusion | Trade Plan Execution & Risk Management On Demand;
Overall Consensus | Buy
Pivot Points

BTC/USDT Technical Analysis, 2025-05-16 19:30 UTC📊 BTC/USDT – Cautiously Bullish with Breakout Potential
Binance Spot | 15-Minute Chart | 16 May 2025
🔎 Market Bias: Bullish
📈 Target Zone: $104,500–$105,000
🛡️ Key Risk: Failure to hold above $103,800 → potential drop to $103,200
🧩 Key Price Levels
Support Zones:
$103,800 – psychological + prior swing low
$103,200 – EMA-13 confluence
$102,900 – 15 May demand spike
Resistance Zones:
$104,300 – recent local high
$104,800 – 1.5x ATR extension
$105,000 – major liquidity pool
📐 Technical Setup
MACD: Bullish crossover confirmed (positive histogram)
RSI: 62.8 – neutral-bullish, no overbought yet
Price Structure: Breakout from descending wedge, forming higher highs/lows
ATR: 172.87 – elevated volatility, favors breakout setups
EMA-13 > EMA-26: Confirms short-term uptrend
🏦 Macro & Quant Notes
Institutional interest remains elevated (S. Korea pension fund)
On-chain data points to $105,000 as a short liquidation cluster
✅ Trade Plan
Entry: Long above $104,100 with volume confirmation
Stop-Loss: Tight below $103,750
Take-Profit:
First TP: $104,800
Full TP: $105,000
Optional: Exit if RSI >75
⚠️ Risk Advisory
Use max 5x leverage due to ATR volatility
Watch for MiCA headlines or Fed comments
Note:
Volume confirmation needed near $104,100
Watch RSI overbought >70 for exit near TP
Macro risk: MiCA / Fed near chart bottom

GBPUSD Week 21 Swing Zone/LevelsNot Always.
Not always will price conform to hypothesis, but in following good RRR success is assured.
We setup week 21 levels and zone as shown with the predicted pathways.
Trade Parameters: Entry on 5 mins chart
Sl 10-15pips
TP usually dynamic but typically 5x
Follow on for trade updates.
As Always PRICE determines trades

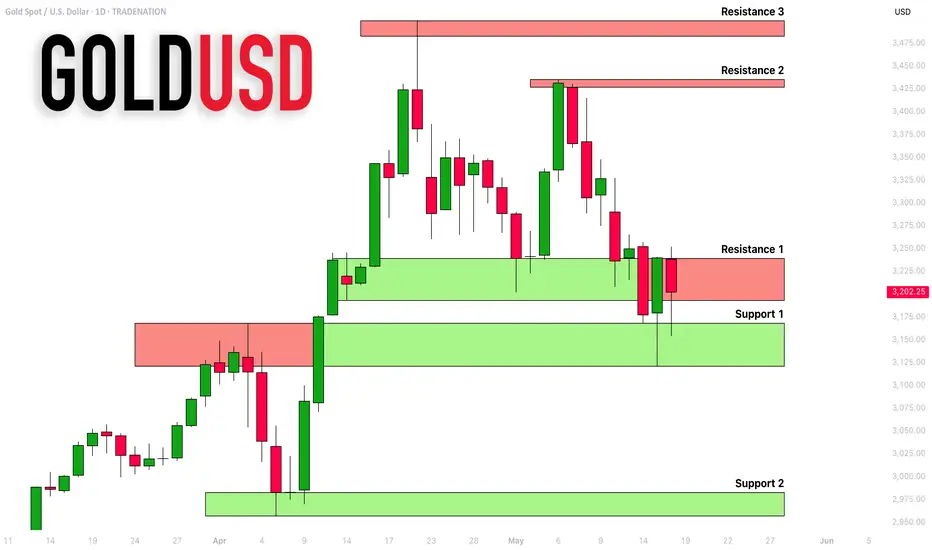
GOLD (XAUUSD): Support & Resistance Analysis For Next Week
Here is my latest structure analysis and
important supports & resistances for Gold for next week.
Support 1: 3120 - 3167 area
Support 2: 2957 - 2982 area
Resistance 1: 3193 - 3238 area
Resistance 2: 3427 - 3425 area
Resistance 3: 3483 - 3501 area
Consider these structures for pullback/breakout trading.
❤️Please, support my work with like, thank you!❤️
I am part of Trade Nation's Influencer program and receive a monthly fee for using their TradingView charts in my analysis.
USDT DOMINANCE is bearish (4H)It is currently in a bearish power move, and if a pullback occurs to the red zone, the price could get rejected again toward the green area.
During this drop, altcoins are expected to perform well since Bitcoin dominance is also bearish. When both Bitcoin dominance and Tether dominance are bearish, altcoins tend to deliver the best returns.
Now that Bitcoin has seen significant upward moves, many might think it’s time to consider sell/short positions. But hold on | this is exactly when market makers want to create the illusion that the bullish phase is nearing its end. However, the charts tell a different story, especially for altcoins!
What better time for altcoins to turn bullish than now | when everyone is expecting a rejection and fearing a price drop
A daily candle close above the invalidation level will invalidate this outlook.
For risk management, please don't forget stop loss and capital management
When we reach the first target, save some profit and then change the stop to entry
Comment if you have any questions
Thank You

Eth Short ScalpEth is wanting to start it's b wave correction, so am expecting price to head lower than my Profitzone, so will update the idea as it progresses.
Idea includes:
Entry - Stop Loss - Conformation - Profit Zone
Not Trading Advice. Not Always Worth Ignoring.

USDCHFThe latest COT data suggested relative strength in the Swissy. The price action also indicated that upside momentum has been meeting obstacles despite a seemingly strong recovery in the Dixie. I'd be interested in shorting this asset, if the opportunity presents it to me.

Solana possible reject off the 21 smaThis is just an observance that I've made. The last time we rejected off this 21 sma, we dropped 93% to the bottom. I am by no means a bear, but I like to read what the charts are telling me. Bitcoin rejected in the same exact way last cycle but blew through it this cycle. Maybe this will change things. Let's just keep on eye on it.

BTC Medium Term and Local Work for 2025 18 05 2025Logarithm. Time frame 3 days. Everything is shown extremely accurately, according to technical analysis, logic based on cyclical repetition, and liquidity consolidation zones as a result of price and trading movements. This trading idea, with precise reversal zones and targets, will last you for 31 weeks. That is, for 7 months.
The previous trading idea BTC/USD Triangle. Medium-term and local work , published on 7 06 2024, it lasted me almost 1 year. It has 63 local work updates (I don't spam with new trading ideas on principle). So, nothing will get lost, you can follow everything, read, possibly use it as training material on a live chart, as a whole explanation of local work, what is really happening on the market, profit/loss potential, always before the price movement, and not after the fact. I show what is, that is, a chart and potential work from the position of a trader, not a crypto marketer.
🟣 Local and medium urgent now
1️⃣💸 The bullish triangle itself (which is not there yet, I have depicted it on the chart for you) acts as a stop and consolidation zone (zone “psychology 100”, reset in trend No. 1). This is the easiest to manipulate and the most probable scenario. This will just be the summer consolidation. Instead of it, there may be:
2️⃣💸 Rising wedge , but more in shape like a triangle (essentially a wedge, there is a meaning of a triangle, but it was formed on aggressive pump news), with a large short liquidity takeout, and not very good logic of the TA movement after that... But, this is a bullish scenario, although quite aggressive.
3️⃣ Working out the bearish targets of the triangle (non-corrective price movement within its canvas). Stopping the decline in the designated zone and reversal upward (continuation of the trend). I emphasize the importance of not fixing the price below the zone of targets of the local corrective decline, which will not break the trend.
4️⃣💸 Double top (or triple). Double top as in 2021 in the distribution zone. This is the least likely scenario, but the most negative, as it breaks the trend. But, this is the least likely scenario, primarily because of the altcoins.
Altcoins in 2021 and now.
4️⃣In 2021, when Bitcoin formed a double top, they (altcoins) were in “space”, that is, in their distribution zones (+500-1000% of the average price of the set).
🔽Now everything is the other way around, they are in capitulation zones (most of them) or in their long-term accumulation channels :
Liquid -90-93%
Medium liquid -93-96%
Low liquid -96-98% or some are already scams or on the verge of it...
Some altcoins have pumped up earlier. That is, they left their long-term accumulation zones earlier. For example: SUN, XRP, DOGE, PEPE, SOL and so on... But there are very few of them, as distributing (raising the price, holding it and selling, inspiring to buy expensive when everything is cheap) in a bearish altcoin trend is very irrational, and you need a lot of money to go against the general market trend.
Main trend (most of it, chart since Binance Exchange foundation) for clarity on a large time frame of this local zone for work.
BTC Primary trend. Secondary — expanding triangle.

ETHUSDT.P~We are In Accumulation To Seek Liquidity SSL/4D Maybe (2314)
~If We are "Respected" Next target Is IPDA 40
~ Maybe To Next Week

Key Levels for the Week 19-23/05/2025 ∷Gold∷
🐍 Key Levels Overview for the Week🐍
__________________________
Resistances🔀 3429,3546,3606,3635
Mids∷∷∷ 3348,3392,3451,3488
Supports🔀 3425,3317,3247,3136
Trend Base Lines
3321🐂3343🐂3345🐂3369
3301🏛3309🏛3313🏛3332
3291>!🐻3277🐻3283🐻3301

Analysis of the dollar indexHello friends, I'm back.
I think the dollar index will follow the path indicated on the weekly time frame.
You can keep this scenario in mind for your trading.
be profitable.

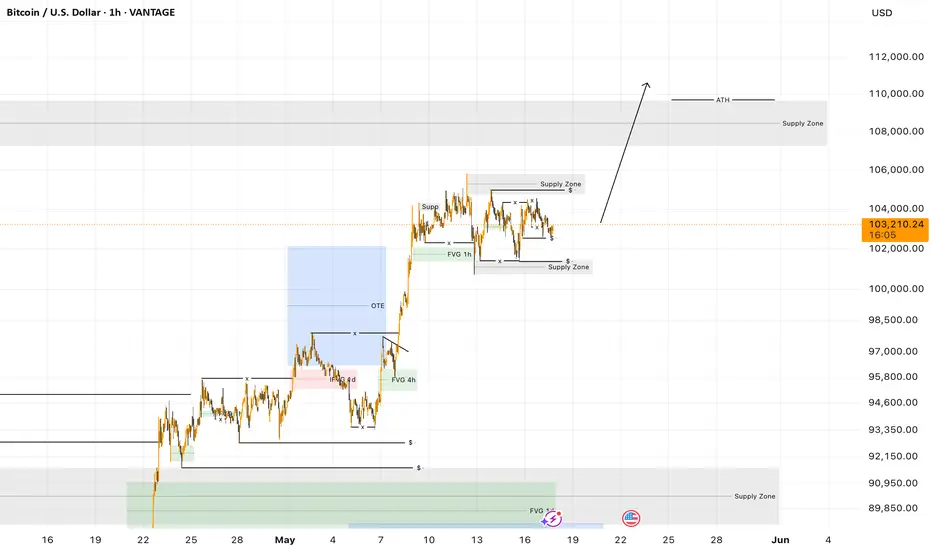
Bitcoin (BTC/USD) – 4H Analysis
🧱 Accumulation Just Below ATH
We’re currently observing a tight consolidation phase, right above the bearish OTE (from the 109K → 74K retracement), and just below Bitcoin’s all-time high.
This is a powerful signal :
📌 Price is holding strong instead of retracing.
📌 Sideways structure in a high zone = strength, not weakness.
📌 This type of accumulation near ATH often precedes an explosive breakout.
🚀 What It Suggests
This current setup implies that BTC is absorbing liquidity, building strength, and likely preparing for a significant leg up, potentially a new all-time high extension.
If the price starts breaking out with volume above the consolidation range :
🎯 110K–115K becomes short-term target zone.
🧭 130K+ possible on longer-term Fibonacci extension levels.
✅ Summary
No sign of weakness.
Consolidating at the top = bullish intent.
Next ATH breakout could be imminent.
Deck pivot Deck has already had a nice pivot from the low and earnings are next week. After a quick analysis it looks like a buy to me. The stock has a strong history of revenue growth and decent operating cash flows. The balance sheet is very healthy as well. Deckers owns Hoka, Ugg, Teva and more popular brands. For a retail company, a 20% net margin is huge, this hows they have pricing power, and a brand moat. Net income has grown at a CAGR of 42% since 2017 which is insane.
My target is 234

ETH/USDTAlt Market on Watch — All Eyes on ETH ⚠️
Despite a strong start to the week, some red flags are starting to show up on the horizon.
The spotlight is on ETH — it’s the key to what’s next for the altcoin market.
In the last update, I shared altcoin levels to work from,
but right now ETH should be your primary reference.
📍 $2400 is a major zone — I’m watching for a reaction there to get aggressive on alt entries.
❌ If that zone doesn’t hold, we’re likely heading down to $2200–2100, possibly even $1900.
No need to overexpose — I’m sitting mostly in cash, waiting for clear signals.
🚫 And most importantly — this is not a short setup (yet).
Let’s wait for the new weekly open before making any big moves.

REI Buy/Long Setup (1D)REI has hit a very significant support zone.
It is expected that the buy orders entering this symbol will be sufficient to create a bullish swing wave.
As long as the demand zone holds, the price can move toward the targets.
targets: 0.02482 _ 0.02948 _ 0.03402
A daily candle closing below the invalidation level would invalidate this analysis.
Do not enter the position without capital management and stop setting
Comment if you have any questions
thank you

XAUUSD[GOLD]; Is it the beginning of the major correction? XAUUSD dropped from 3265$ to 3127$, as predicted in our previous analysis. However, after touching 3127$, the price has retraced slightly and is currently trading at 3178$. In our opinion, the price can go up to $3220 maximum and reject at that level. We need to wait and see how prices behave. Another possible entry point is at 3178$, which is the current trading price. We believe this region is good for selling because the price has struggled to break through it. Please use a proper trading plan while trading gold.
As always, this analysis doesn’t guarantee that price will move as described in the chart. Please use your own knowledge and trading plan while trading gold. Good luck and trade safely.
Want to support us? Do the following ❤️
-LIKE THE IDEA
-COMMENT YOUR VIEW
-SHARE IF YOU AGREE
Much love ❤️
Team Setupsfx_

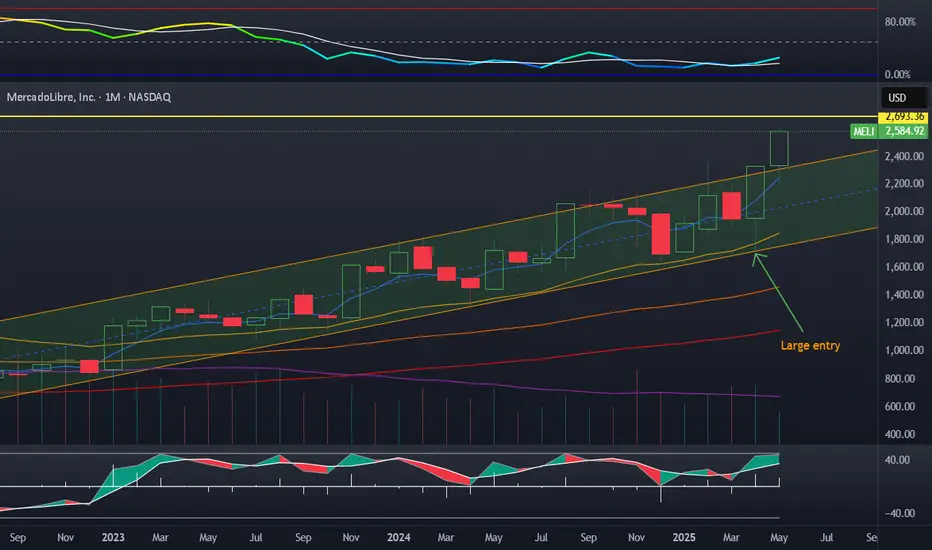
Meli breaking long term channelMeli is breaking the long term channel to the upside. This outstanding company is one of my largest holdings, I plan on holding it for life. I entered hard between 1600-1700$ when the bottom of the channel was tested. My 2700$ target approaches.
Gold seeks buyside.....I'd be interested to engage in buyside delivery if the opportunity presents it to me. The big picture seems to support the idea as the previous three Daily candles have been supported by the Daily BISI to reprice higher prices.

USDJPYIf the Daily BISI holds and supports price to push higher, then I'd be interested to engage. Price is currently at a discount relative to current Dealing Range.

$STO/USDT Bullish Setup:$STO/USDT Bullish Setup:
Price is forming a descending triangle and is now testing the upper trendline — signs of possible breakout.
🔸 Key Support Zone at 0.1100:
This level has held multiple times, showing strong buyer interest.
🔸 Upside Target:
If price breaks 0.1150 with volume, a move toward 0.1650 is likely.
🔸 Risk Level at 0.1050:
If price drops below this, setup is invalid.
$NEIRO, SEED_DONKEYDAN_MARKET_CAP:PEOPLE , ECONOMICS:BOME , $MUBARAK, NYSE:AMP , EURONEXT:CVC , CRYPTOCAP:SYRUP , TSX:FTT , CRYPTOCAP:FXS , NASDAQ:POLYX , TSX:DF , ASX:KSM , $AIXBT, $JELLYJELLY, NYSE:DAR , $LAUNCHCOIN, $HIPPO, $GRASS, SGX:BBT , $SKYAI

BTCDO Analysis | Catch the altseason! (12H)Note: This chart is tied to Bitcoin dominance and moves accordingly.
The trendlines have been lost, the price has dropped, and it has reached a support level. Such strong trends, when they come to an end, usually result in a pullback to the trendline or the broken levels.
Currently, the price may pullback to the supply zone and then enter another correction and drop, which could cause altcoins to turn green again.
Targets are marked on the chart.
A daily candle closing above the invalidation level will invalidate this analysis.
For risk management, please don't forget stop loss and capital management
Comment if you have any questions
Thank You

BTC Re - Entry - Eyes locked on Them 30M HighsPrice came back lookin' too good to ignore - clean reaction off my 100.00 Fib, tucked just below the IDM zone. That 5M order block gave me the nod, and I didn't hesitate.
Re-entered with full intent: this ain't a gamble, it's precision. Structure still bullish, liquidity aboce them 30M hghs is callin'. I'm just walkin' price to the money.
Let's see is BTC plays out how she whispered she would.
#SMC #BTCUSD #PriceAction #OrderBlock #LiquidityRun #FibMastery #5MEntry #30MTarget
