OMI - go long with Coliseum Capital Management LLCOwens and Minor
we have some technical reasons here.
1. RSI divergence on the weekly chart: 2025 Februar and April made a doubla bottom formation, with higher RSI in April
2. $6.88 is a year S1 pivot level
3. At $14.1 is a gap wacthing us, promising a 100% upside potential
Fundamental reasons:
1. The whole healthcare sector is down because US government, can be a good contrarian play for 2025 or 2026
2. This spring, Coliseum Capital management bought around 4M Shares, and now holding 31% of the company.
The share price can decline further, breaking the $6.0 level for a short period of time. But it didn't happened in the April panic. $ 5.89 can be a good stop-loss level alltough if you can handle -18% loss.
But i'm waiting for upside momentum in OMI.
Pivot Points

Nifty Analysis EOD – May 16, 2025 – Friday🟢 Nifty Analysis EOD – May 16, 2025 – Friday 🔴
Nifty Took a Breather After a Big Bullish Day
📈 Nifty Summary
As anticipated, after Thursday’s strong breakout and euphoric rally, Nifty paused for breath today. Despite Gift Nifty indicating a 75+ point gap-up, the actual open was flat, hinting that global cues couldn't ignite further momentum.
From the start, the tone was set for a retracement-style session—every intraday rise met with selling, while dips around 24,980 continued attracting buyers, keeping the structure range-bound but supported.
The most notable observation: today’s low aligned with the 23.8% Fibonacci retracement of yesterday’s candle, which shows bulls are still in control and defending key levels. However, the recovery from the day’s low couldn’t break past the 50% retracement of the same range—signalling hesitation and exhaustion in the short term.
📊 Intraday Walk
🟢 Flat open despite positive Gift Nifty cues
⚖️ Mean-reverting price action throughout
🧲 Buying seen repeatedly near 24,980
❗Rejection seen around 50% retracement of the previous day’s candle
🔚 Closed mildly negative; a pause, not panic
🕯 Daily Candle Breakdown
Candle Type: Small-bodied candle (Doji-ish) indicating indecision
Range: Tight and narrow (117 Points) session
Key Observation: Low held above 23.8% retracement of May 15 candle
What it Implies: Bulls still holding ground, but upside conviction lacking
🎯 Gladiator Strategy Update
Strategy Parameters
ATR: 350.94
IB Range: 94.2 → ✂️ Small IB
Market Structure: ⚖️ Balanced
Trade Highlights
⚠️ 1st Short Trigger: 11:05 → No Entry Initiated
💼 Total Trades: 0
📍 Support & Resistance Levels
🟩 Resistance Zones:
25,116 ~ 25,128
25,180 ~ 25,212
25,285
25,399
25,485 ~ 25,511
🟥 Support Zones:
25,000 ~ 24,980
24,882
24,800 ~ 24,768
24,730
24,660
24,590
24,530 ~ 24,480
🔮 What’s Next?
Today was a classic breather candle after a strong impulse. If Monday opens bullish and crosses above 25,070, we could see a continuation of the uptrend. But a close below 24,950 may be the first red flag for bulls.
🧠 Final Thoughts
Markets don't rise in a straight line. Today was a healthy pause—a base-building day. As long as 24,980 holds, the bulls have the upper hand.
“A pause in trend isn’t weakness—it’s preparation.”
✏️ Disclaimer
This is just my personal viewpoint. Always consult your financial advisor before taking any action.

NZD/CHF For Bullishwait for pull-back near by entry point and then go long
general trend is up trend
have fun :)

AUD/CHF For Bullishyou can go long now
or
wait for pull-back near by entry point and then go long
general trend is up trend
have fun :)

EUR/CHF For Bullishwait for pull-back near by entry point and then go long
general trend is up trend
have fun :)

SHIB/USDTWe're seeing liquidity grabs followed by the start of a local bullish move.
Looking to enter long from the highlighted zone, but only if proper conditions and confirmations align.
🎯 Upside targets: 1765 – 1918 – 2496 points


GBP/CAD For Bearish as pull-backyou can go short now as pull-back
general trend is up trend
current phase is pull-back
have fun :)

GBP/NZD For Bearish as pull-backwait for pull-back near by entry point and then go short
general trend is up trend
current phase is pull-back
have fun :)

AUD/NZD For Bearish as pull-backwait for pull-back near by entry point and then go short
general trend is up trend
current phase is pull-back
have fun :)

NZD/USD For Bullishwait for pull-back near by entry point and then go long
general trend is up trend
have fun :)

NZD/CAD For Bullishwait for pull-back near by entry point and then go long
general trend is up trend
have fun :)

BTC Rocket Fuel Loading.... Get ReadyBTC looking like it's about to lift off from that internal order flow zone.
I keep it clean, pretty, and systematic - and that's exactly how I plan to buy up this next key area.
Scalpers, you already know - LTF confirmations are whispering bullish.
Day traders, this might be the last good push before we either reverse or break the whole zone down.
Me? I'm watching for that 5M CHoCH to give me the green light.
When it flips - I flip. Until then, patience.
Trade with precision. Keep it SMC.
#BTC #SmartMoneyConcepts #OrderFlow
#InducementsHunter #5MCHoCH #RocketReady
Bless Trading!

Missed the first BTC entry? No stress.Second setup is already marked and locked in - I'm eyeing those 30M highs for the next liquidity sweep.
Let the late entries chase. I'm just flowing with price.
#BTC #SmartMoneyFlow #30MInducement #PrecisionTrading #SecondChanceSetup

OFFICIAL TRUMP Main trend. 16 05 2025Logarithm. Time frame 3 days. After a super pump and a drive of "stupid money", a descending channel was formed on a natural dump. The price came out of it. Now a triangle is forming. The price is clamped. The reversal zones and percentages to the key support/resistance levels are shown extremely accurately according to TA.
If there is no aggressive exit in the medium term, then there will be consolidation and, as a consequence, the formation of a horizontal channel "sholtai / chattai", its key zones are shown.
Now, this "cryptocurrency" is now on 16 05 2025 in 41st place by capitalization.
Reductions from the price highs are about -90%.
From the liquid zone about -84%.
These are not the minimum values of the decline of such hype cryptocurrencies. Just take this into account in your money management. For clarity, the level zones and the % of potential decline if the trend breaks again are shown on the chart (pull the chart down).
Even with such a decline, the price is now at a huge profit. I am not speaking for the creators of the cryptocurrency, but for the first speculators and "investors" who may not have sold everything on the hype.
For the creators of the cryptocurrency, perhaps these are manipulators close to the Trump family, for them, any sale is super profit. But in order to sell, you need to maintain liquidity, and from time to time make interest in speculation and asset retention by investors, that is, do pumps and hype. Use this, and do not be greedy...
Levels and zones, pump/dump, which the price will "feel" are shown in advance. Click "play" on the chart and move the chart up. With a high degree of probability, the hype and pumping of the price of this cryptocurrency will be repeated, given the hype and the long term of the political figure whose name this cryptocurrency bears. Now it is a Trump dump, in the future it will become a Trump pump for some time.
Do not forget to sell on the next hype. If you understand that you are very greedy, and the news background affects you, then sell in parts, or use stop losses to protect profits.
There is no need to guess the minimums and maximums. It is important to know these zones, and have an acceptable average price, from the position of the trend, and its potential. It is regulated by the distributed entry volume (in advance) at potential reversal zones.

BTC Long Bias – Here’s the BreakdownEveryone’s screaming “99K dump” — I’m not buying it.
Price swept BSL at the highs without touching the 30M OB that caused the move down. But instead of breaking down, it formed bullish structure and held. That tells me smart money isn’t done buying yet.
🎯 Entry Zone: 101K–102K (where price showed strength)
🎯 Target: 104,979.32 (previous 30M high + liquidity resting there)
Price respected the bullish structure and gave the reaction I called off the demand zone. Now just waiting for a clean 5M entry with inducement + OB.
Let the rest wait on 99K. I’ll follow what the market actually tells me.
#BTC #SmartMoney #SMC #Inducement #OrderBlocks #TradeWhatYouSee
Bless Trading!

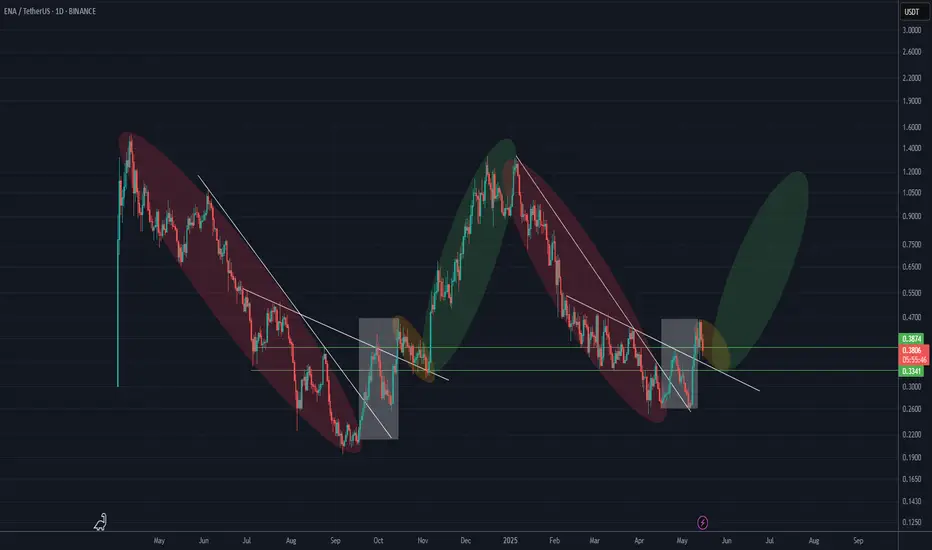
ENA is repeating a bullish fractal (1D)Look at the red, white, yellow, and green boxes in order, and then pay attention to the white trigger lines. You’ll notice that the previous phases | the end of the bearish trend (red box), followed by a bullish move for breakout (white box), then a pullback (yellow box), and finally the main bullish move (green box) | are now repeating.
Also, the price is currently sitting within the trading range marked by the two green lines, which is a key area. After the pullback is completed, a bullish wave is expected to begin, potentially reaching at least around the previous all-time high (ATH).
For risk management, please don't forget stop loss and capital management
Comment if you have any questions
Thank You
BTC Update - Called It Clean Just like I marked up - price came right into that (demand zone) and gave us the bullish reaction I expected. Zone held strong. No flinch. No cap.
Now that the higher timeframe has done its job, I'm down here on the lower timeframes hunting entries like a sniper. Patience. Precision. Letting the market walk into my trap.
IF you know, you know.
Smart Money always leaves a footprint. I just follow the trail.
#BTC #SmartMoneyConcepts #SMC #ForexTrader #CryptoTrader #PriceAction #Liquidity #Inducement #OrderBlock #RefinedEntries #LuxAlgoConfirmation #TopDownAnalysis


BITCOIN Analysis (1H)We have a CHoCH (Change of Character) in the internal structure, and a bullish order block has been cleared. Price is currently within a supply zone, and there is a resistance line above the current price level.
It appears that price is aiming to pull back to lower support zones. These lower zones are fresh and unmitigated, so we expect that upon reaching them, price may bounce back upward toward the previous high.
A 4-hour candle closing above the invalidation level would invalidate this bias.
Do not enter the position without capital management and stop setting
Comment if you have any questions
thank you

Nifty Analysis EOD - May 15, 2025 - Thursday🟢 Nifty Analysis EOD - May 15, 2025 - Thursday 🔴
Heart-Throbbing Wild Weekly Expiry by Nifty
📈 Nifty Summary
What a day! In yesterday’s report, we highlighted the potential for breakout on both sides—and Nifty said, “Why choose one? Have both!”
Opening with a modest gap-up of 28 points at 24,694, the index wasted no time and took a sharp dive, breaching the Previous Day Low (PDL) and hitting 24,494. This test of the 24,483–24,528 support zone sparked an immediate V-shaped recovery.
By 10:30 AM, Nifty had reclaimed its mean level, and breaching 24,600 triggered short-covering that pushed it sharply toward PDH, which was taken out in just 10 minutes. A rumored update from Trump on a USA–India tariff deal (unverified but possible catalyst) might have played a role—though, as always, price is the final news.
However, within the next 30 minutes, Nifty wiped out all the gains, only to enter a consolidation phase until 1 PM. Then came the real action—another breakout above PDH with strong short-covering and fresh buying. The rally took Nifty to a fresh weekly high of 25,116, closing near the highs at 25,035.
This wasn’t a regular expiry. This was a thriller.
📊 Intraday Walk
📉 Breach of PDL to form 24,494 low
🧲 V-shaped recovery from 24,500 zone
🚀 24,600 breakout triggers short-covering to PDH
⚡ Spike to PDH wiped out → range-bound for 2 hours
🟢 1 PM breakout → new weekly high 25,116
🔚 Closed at 25,035, a solid 341-point day
🕯 Daily Candle Breakdown
Candle Type: Bullish Marubozu-like Engulfing
Range: ~622 points
Key Observation: Engulfed previous two candles and broke 12th May’s high & close
What it Implies: Strong bullish momentum, signs of sustained short-covering
🎯 Gladiator Strategy Update
Strategy Parameters
ATR: 376.94
IB Range: 212.3 → 📏 Medium IB
Market Structure: ⚖️ Balanced
Trade Highlights
✅ 1st Long Trigger: 13:05
🎯 Target Achieved: 1:4 Risk-Reward
💼 Total Trades: 1
📍 Support & Resistance Levels
🟩 Resistance Zones:
25,116 ~ 25,128
25,180 ~ 25,212
25,285
25,399
25,485 ~ 25,511
🟥 Support Zones:
25,000 ~ 24,980
24,882
24,800 ~ 24,768
24,730
24,660
24,590
24,530 ~ 24,480
🧠 Final Thoughts
The Nested Inside Bar setup we spoke of yesterday? It delivered. Clean breakdown of PDL without triggering trade saved us from a trap, while the PDH breakout delivered a 1:4 reward—textbook price action setup. With a strong bullish engulfing on the daily, expect continued strength with dips being bought.
“When the market offers clarity, act. When it offers confusion, observe.” — Stay nimble.
✏️ Disclaimer
This is just my personal viewpoint. Always consult your financial advisor before taking any action.

ZK Aanalysis (12H)After forming a 3D bottom, the price moved upward with a strong and rapid bullish wave that was stronger than the previous bullish waves within the bearish move, reclaiming a key zone. Additionally, an important trigger line has been broken, which strengthens the bullish outlook on ZK.
We are looking for buy/long positions within the green zone toward the targets. The targets are marked on the chart.
A daily candle closing below the invalidation level will invalidate this analysis.
For risk management, please don't forget stop loss and capital management
Comment if you have any questions
Thank You

Gold is in the Bearish DirectionHello Traders
In This Chart GOLD HOURLY Forex Forecast By FOREX PLANET
today Gold analysis 👆
🟢This Chart includes_ (GOLD market update)
🟢What is The Next Opportunity on GOLD Market
🟢how to Enter to the Valid Entry With Assurance Profit
This CHART is For Trader's that Want to Improve Their Technical Analysis Skills and Their Trading By Understanding How To Analyze The Market Using Multiple Timeframes and Understanding The Bigger Picture on the Charts
