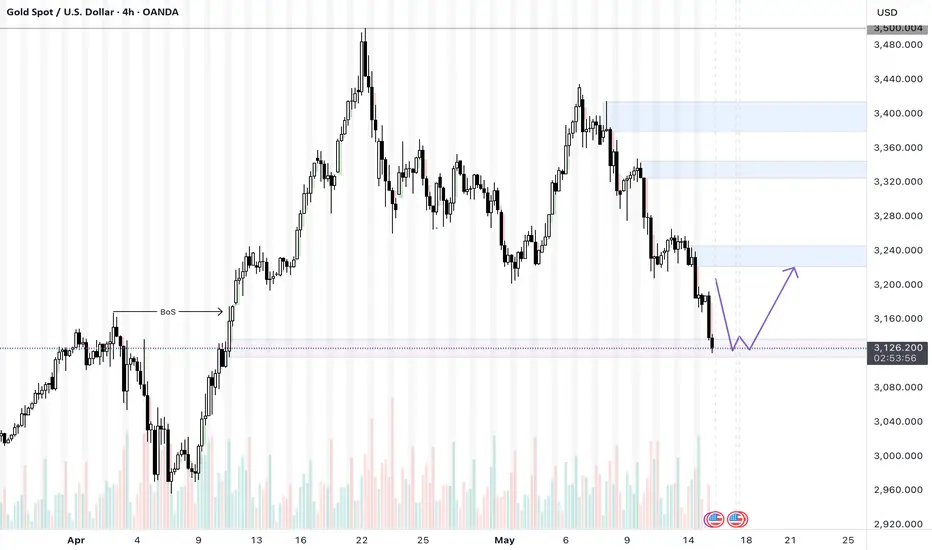
XAUUSD reversal point for this week
Based on 4hour timeframe
- Gold dropped beautifully over the last few days and has reached the demand area that caused the break of structure.
- there is still weakness but for a day trade i would like to see a reversal on the lower timeframe at this point
- the price pushed down during the asian session and not waiting for the reversal on the lower TF that will result in a bullish push during London and hopefully a continuation during US session.
- gold may sweep this zone but i definitely do not want a close after it, if that happens then i will wait for the next extreme zone.
- in terms of target- the first supply zone is my target.
Pivot Points
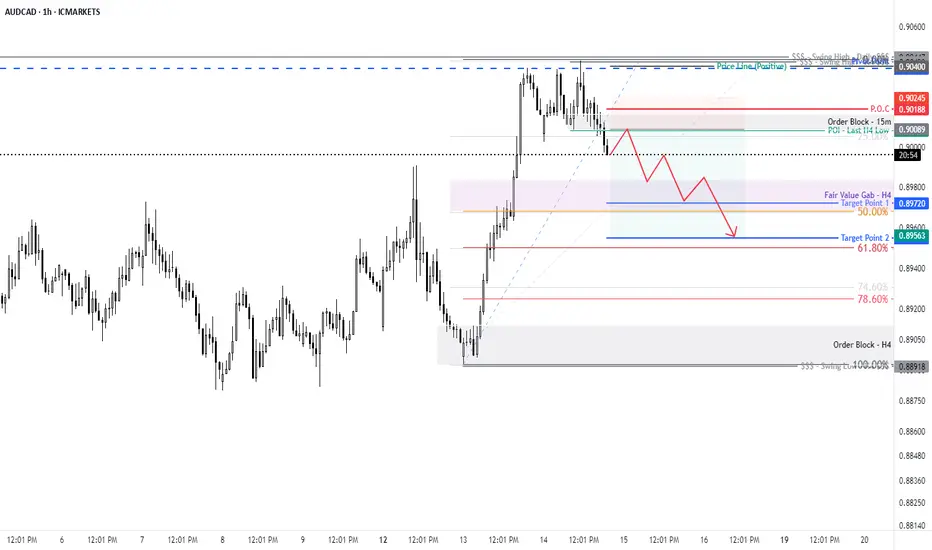
CAD/CHF For Bearish as pull-backyou can go short now
or
wait for entry point and then go short
general trend is up trend
current phase is pull-back
have fun :)

NZD/CHF For Bearish as pull-backyou can go short now
or
wait for entry point and then go short
general trend is up trend
current phase is pull-back
have fun :)

EUR/CAD For Bullishyou can go long now
or
wait for entry point and then go long
general trend is up trend
have fun :)

“BTC: Liquidity Sweep Flipped the Script — Now Watching Bullish BTC moved slick today — I was originally watching for a sell-side mitigation inside the range, but price swept liquidity and reversed quickly without even tapping the OB. No clean mitigation, just a sharp flip. That shift told me bulls are back in control.
Now price is operating with bullish intent. I’m focused on a bullish OB inside the same range — once I get confirmation with a proper OB mitigation following the sweep, I’ll be looking to take longs.
Patience and precision here. Let price do the talking.
Bless Trading!

Break and retest? Quarterly Fair Value needs to hold as support if this upwards move is to continue. After which we look to Yearly Fair Value and Quarterly Premium 1. Let's stay positive and bullish.

Momentum Shift: Gold Holds Strong Amid Mounting Dollar PressureHello,
🪙 Gold Market Outlook – May 8, 2025
📈 Current Price Snapshot
Spot Gold (XAU/USD): $3,302/oz
Gold is holding firm above key support levels, signaling sustained bullish momentum. The $3,300 level has now been clearly breached and is acting as short-term support. If this level continues to hold, further upside continuation is expected, with a possible target of $3,500.
🧭 Technical Outlook
4H Major Support: $3,274.637
1D Floor Support: $3,265.328
1W Pivot Point (PP): $3,265.203
1M Pivot Point (PP): $3,248.445
"A test of the weekly/monthly pivot points is possible but uncertain, as current sentiment favors risk-on for gold, while the USD faces risk-off pressure."
A pullback to support is possible, but it’s unlikely under the current macro and technical context.
💬 Macro Fundamentals
Gold prices fell earlier today due to optimism surrounding a potential Trump–UK trade deal and easing geopolitical tensions. However, the market remains cautious as US-China officials are scheduled to meet in Switzerland. Meanwhile, China's central bank approved foreign exchange purchases by commercial banks, further boosting gold imports and supporting physical demand.
"Such measures are likely to keep supporting bullion demand."
— Han Tan, Exinity Group
🌍 Geopolitical Risk Factor
India-Pakistan tensions have escalated, with Pakistan downing 12 Indian drones, which is contributing to increased safe-haven demand in the region.
"Potentially leading to an unquantifiable level of safe-haven demand."
— Ole Hansen, Saxo Bank
Target: $3,500.
The Support and Resistance outlined in green and red are the respective support/resistance for this pair currently for 1M-1Y timeframes!
No Nonsense. Just Really Good Market Insights. Leave a Boost
TradeWithTheTrend3344

BTC Fibo RetracementIn the meantime, here is my BTC plan. Now we are very close to ATH and I would wait for next retracement to enter long, if we are going to 120.
Zone Of Interest combines several reasons to make an entry.
• 0.5 Fibo
• Sell Side Liquidity
• Valid 8H FVG
• And a border of discount zone
It is not at all necessary that the price will fall to these levels, but if it will, I`ll be watching price action there and make my decision.
Have a good trades!

POL (ex-Matic) Stock Quote | Chart & Forecast SummaryKey Indicators On Trade Set Up In General
1. Push Set Up
2. Range Set up
3. Break & Retest Set Up
Notes On Session
#
- Double Formation
* (A+ Set Up)) | Completed Survey
* (Area Of Value)) - * Swing Low | Subdivision 1
- Triple Formation
* (Middle Range)) & Retest Area | Subdivision 2
* (TP1) | Subdivision 3
* Daily Time Frame | Trend Settings Condition
- (Hypothesis On Entry Bias)) | Indexed To 100
- Position On A 1.5RR
* Stop Loss At 50.00 USD
* Entry At 65.00 USD
* Take Profit At 90.00 USD
* (Uptrend Argument)) & No Pattern Confirmation
* Ongoing Entry & (Neutral Area))
Active Sessions On Relevant Range & Elemented Probabilities;
European-Session(Upwards) - East Coast-Session(Downwards) - Asian-Session(Ranging)
Conclusion | Trade Plan Execution & Risk Management On Demand;
Overall Consensus | Buy

Nifty Analysis EOD - May 14, 2025 - Wednesday🟢 Nifty Analysis EOD - May 14, 2025 - Wednesday 🔴
Day Ends with Directional Uncertainty from Nifty
🔍 Nifty Summary
Nifty opened with a 35-point gap-up, displaying early strength by slowly climbing toward 24,747, which aligned with the critical resistance zone of 24,768–24,800 and the CPR top. But that’s where the rally halted.
From the day’s high, it reversed lower, testing both the Previous Day Low (PDL) and Previous Week High (PWH). Interestingly, the index took support there and managed to close right at the CPR, underlining indecision.
The day was marked by broad consolidation within a 232-point range, with no strong directional follow-through. Price stayed majorly around the CPR zone, signaling a range-bound session with underlying uncertainty.
🕵️ Intraday Walk
☀️ Opened with 35-point gap-up; gradually climbed to 24,747.
🚫 Hit resistance at 24,768–24,800 and reversed.
🔽 Fell to test PDL and PWH zone (24535 area).
🛑 Found support and bounced back to close at CPR.
🔄 A day filled with range-bound movement and no clear trend.
📏 Inside Bar Pattern Watch (Daily Chart)
A 3-day Inside Bar Structure is forming:
📅 May 12: Mother Candle
📅 May 13: Baby candle (ignore 29-point upper wick)
📅 May 14 (Today): Another baby candle within May 13 (ignore 12-point lower wick)
This nested inside bar scenario could trigger a directional breakout soon.
🔼 Upside Levels:
If today’s high (24,767) breaks:Target Zones: 24,800 → 24,882 → 24,940
🔽 Downside Levels:
If today’s low (24,535) breaks:Target Zones: 24,480 → 24,400 → 24,365 → 24,330
🔎 Key Fib Observations
📏 Today’s high (24,747) = ~50% retracement of May 13’s candle → signals rise-on-sell tone
📉 Today’s close (24,640) = ~50% retracement of today’s candle → neutral-to-positive bias
These confluences reflect a tug-of-war between bulls and bears, waiting for a breakout.
🕯 Daily Candle Breakdown
Candle Type: Small-bodied candle inside previous day’s range
Today’s OHLC:▫️ Open: 24,613.80▫️ High: 24,767.55▫️ Low: 24,535.55▫️ Close: 24,666.90 (▲+88.55 / +0.36%)
🔍 Key Observations:
⚠️ No directional expansion, despite higher high & low
✅ Inside bar formation continues
✅ Close at candle midpoint → Neutral, with slight positive bias
📊 Sign of energy build-up for a potential breakout
🛡 Gladiator Strategy Update
Strategy Parameters
ATR: 349.73
IB Range: 169.70 → 📏 Medium IB
Market Structure: ⚖️ Balanced
Trade Highlights
⚠️ No trade triggered
💼 Total Trades: 0
🔢 Support & Resistance Levels
🟩 Resistance Zones:
24,730
24,768 ~ 24,800
24,882
24,980 ~ 25,000
25,100 ~ 25,128
25,180 ~ 25,212
🟥 Support Zones:
24,882
24,800 ~ 24,768
24,730
24,660
24,590
24,530 ~ 24,480
24,461
24,420 ~ 24,400
24,365 ~ 24,330
24,245 ~ 24,240
🔮 What’s Next?
A 3-day Inside Bar Formation generally signals a volatility contraction phase. The tighter the coil, the stronger the potential breakout.
If 24,767 breaks, bulls might regain momentum.If 24,535 fails, we may retest deeper supports from 24,480 downward.
📌 Patience over prediction — let the range resolve.
💬 Final Thoughts
“Inside bars are calm before the storm. Stay alert — breakout decides the next play.”
✏️ DisclaimerThis is just my personal viewpoint. Always consult your financial advisor before taking any action.

AUD/CAD For Bearish as pull-backyou can go short now
general trend is up trend
current phase is pull-back
have fun :)
ADITYA BIRLA CAPITAL LTD – Trend Reversal Breakout Trade🧠 Technical Highlights:
Downtrend Channel Breakout: Clear breakout from a falling channel pattern
Resistance Break: Strong breakout above supply zone of ₹204–₹210
Volume: Massive volume spike validates bullish strength
RSI: Above 70, indicating strong momentum but not overbought yet
🟢 Buy Setup
Buy Above: ₹219 (today's close confirms breakout)
Stoploss: ₹204 (below the previous resistance/new support)
Target 1: ₹235
Target 2: ₹248
Target 3: ₹260+ (swing/high-risk high-reward)
🔻 Sell/Short Setup (only if reversal)
Sell Below: ₹203
Stoploss: ₹210
Target: ₹190, ₹178
📅 Timeframe: Short-to-Medium Term (2–6 weeks)
📊 Risk-Reward: ~1:2.5
For Education Purposes Only

EUR/GBP For Bullish as pull-backyou can go long now
or
wait for pull-back near by entry point and then go long
general trend is down trend
current phase is pull-back
have fun :)

GBP/CAD For Bullishyou can go long now
or
wait for pull-back near entry point and then go long
have fun :)

EUR/CAD For Bullishyou can go long now
or
wait for pull-back near by entry point and then go long
general trend is up trend
have fun :)

USD/CAD For Bullishwait for pull-back near by entry point and then go long
general trend is up trend
have fun :)

APEX Main trend. DEX exchange Bybit. Hype and super pump 05 2025Logarithm. Time frame 1 week. Correction (descending channel, two distribution zones) after a super pump of about 1500%. All key support and resistance zones were shown, including dynamic ones.
Also showed a local target in percentage in case of exit from a local descending wedge. There is a possibility that the price will enter the mirror support zone of the previous volatility zone of the horizontal channel, or even to the median (green dotted line). Just remember this. When working with the crowd hype, remember the risks.

W / USDT Main trend. 23 03 2025Logarithm. Time frame 3 days. Descending channel, price in local clamping in consolidation at dynamic support of the internal channel. From listing -94% at the moment.
Local percentages, medium-term and long-term to key zones of chart logic and liquidity, are shown on the chart as a guide for building your tactics and risk control.
🔴 There is potential for a decline to external support of a large descending channel (optional). I showed this option for building tactics and money management. Such assets in terms of liquidity, as a rule, decrease by 96-98%
🟢 If, from this price clamp, the price goes up , then the first resistance is the dynamic resistance of the internal channel (from which there may be a local reversal). Then the external (similarly). If the trend breaks and exits the descending channel, then strong resistance is the previous consolidation of 0.24-0.36
Locally, this clamping zone looks like this.

GBP/JPY for Bearish as Pull-backwait for pull-back near by entry point and then go short
general trend is up trend
current phase is pull-back
have fun :)

ENS SWING Trade SetupENS Showing strong momentum towards upside and dropped without touching POI, So it can go higher first then it may take correction, spot and future trader can take risk on this. Wait for the entries and enter from 20-19 level, if price reverse from any other point, then wait for the 4hrs candle closing above 26 and target the 30-32$ level. for scalp and day trading get long from 22.40 SL 21.65 and set tp 25.56 & 27.79$.

Best GOLD XAUUSD Psychological Levels Indicator on TradingView
There is one free technical indicator that will show you every significant psychological level on Gold XAUUSD chart.
It is available on TradingView and it is very easy to set.
Discover the best psychological support and resistance indicator for Gold trading , its settings and useful tips.
First, let's discuss the significance of psychological levels in GOLD XAUUSD analysis and trading.
The classic way of the search of significant supports and resistance is based on the analysis of a historic price action.
However, while Gold constantly sets new historic highs such a method does not work, because there are no historic resistances to rely on.
In such a situation, the only reliable strategy to find potentially strong resistances is to analyze psychological levels.
Psychological levels are the round numbers based price levels. Because of the common human psychological biases, these levels attract the interest of the market participants and the prices tend to react to them.
A great example of a psychological level in Gold trading is 3000 level.
It served as a resistance first and after a breakout turned into an important support.
And I found a free technical indicator that plots all the significant psychological levels efficiently.
One more thing to note is that I strictly recommend searching for psychological levels on a daily time frame, because it provides the most relevant perspective.
To use this indicator, search "round" in indicators wind ow.
It is called "Round numbers above and below".
Click on that and it will start working immediately.
You can see that the indicator plotted 3 significant psychological resistances above current prices and 3 supports below on Gold chat.
In the settings of the indicator, you can change the number of levels to identify and change the style of the horizontal lines.
Examine the reaction of the price to psychological supports that the indicator shows. These levels may remain significant in futures and applied for pullback/breakout trading.
With a crazy bullish rally that we contemplate on Gold this year, psychological levels will be the most reliable technical analysis tools for the identification of future bearish reversals and corrections.
This free technical indicator on TradingView will help you in search of the strongest ones.
❤️Please, support my work with like, thank you!❤️
I am part of Trade Nation's Influencer program and receive a monthly fee for using their TradingView charts in my analysis.

EUR/JPY For Bearish as pull-backyou can go short now
general trend is up trend
current phase is pull-back
have fun :)

CAD/JPY For Bearish as pull-backyou can go short now
or
wait for pull-back near by entry point and then go short
general trend is up trend
current phase is pull-back
have fun :)
