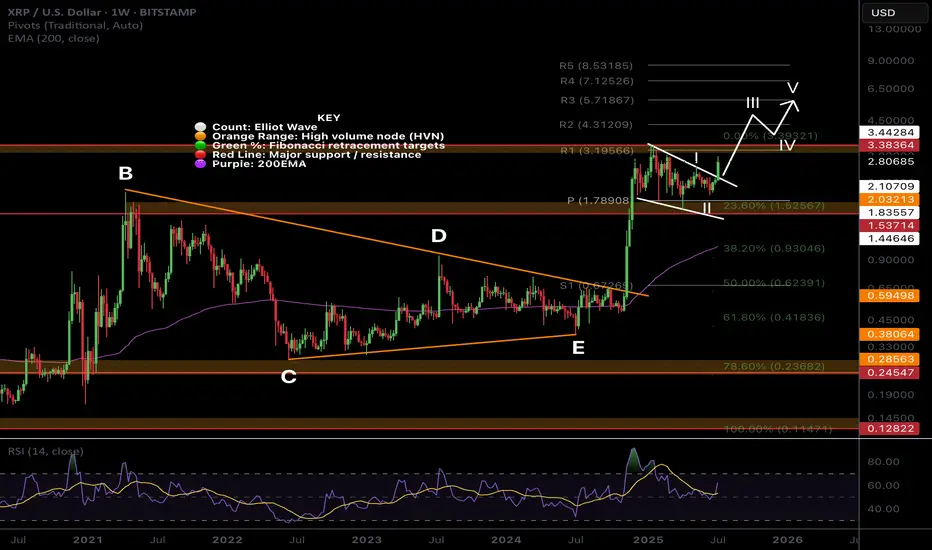
$XRP Macro Tiangle Final Thrust ContinuationCRYPTOCAP:XRP completed a macro triangle pattern last year. Triangles proceed a terminal motif wave which already completed a wave 3.
Wave (3) of (5) is underway with a terminal target around $5.7 after price broke out of the pennant / wedge pattern.
Weekly RSI confirmed bullish divergence.
Safe trading
Pivot Points
RDNT Looks Bullish (1D)The price is showing bullish signs at the bottom.
Higher lows have formed, a trigger line has been broken, and the price has created a bullish iCH. It is now also above the demand zone.
A buy/long position can be entered upon a pullback to the demand zone.
The main targets have been marked on the chart.
If a daily candle closes below the invalidation level, this analysis will be invalidated.
For risk management, please don't forget stop loss and capital management
When we reach the first target, save some profit and then change the stop to entry
Comment if you have any questions
Thank You

What Are Bollinger Bands? How to use it.✅ What Are Bollinger Bands?
Bollinger Bands are a volatility-based technical analysis tool developed by John Bollinger. They consist of three lines:
1. Middle Band: 20-period Simple Moving Average (SMA)
2. Upper Band: Middle Band + 2 standard deviations
3. Lower Band: Middle Band - 2 standard deviations
The bands expand and contract based on price volatility.
📊 What Bollinger Bands Tell You
Contraction (Squeeze): Low volatility, possible breakout coming
Expansion: High volatility, breakout in progress or exhausted
Price Touches Band: Doesn’t mean reversal—it's a sign of strength or weakness
🎯 Mastering Strategies with Bollinger Bands
1. Bollinger Band Squeeze (Breakout Strategy)
Setup: Bands are very close together (low volatility)
Signal: Wait for breakout and volume spike
Action: Enter in direction of breakout
Tip: Combine with MACD or RSI for confirmation
> 🔍 Example: If the price breaks above the upper band with strong volume after a squeeze → potential long entry.
2. Mean Reversion (Reversal Strategy)
Setup: Price touches or exceeds upper/lower band
Signal: Look for RSI divergence, candlestick reversal patterns
Action: Fade the move back to the 20 SMA (mean reversion)
Tip: Works best in ranging markets
> ⚠️ Warning: Don’t short just because price touches the upper band. Look for confluence.
3. Trend Riding with Bands
Setup: Price rides upper/lower band
Signal: Pullbacks to the 20 SMA in a strong trend
Action: Enter on bounce near SMA if the trend is strong
Tip: Use higher timeframes to confirm the trend
> 🟢 In an uptrend, buy near the 20 SMA when price pulls back but doesn’t break lower band.
📌 Key Tips for Mastery
1. Adjust settings for asset/timeframe (e.g., crypto might need a 10 or 14 SMA)
2. Never use Bollinger Bands alone – combine with:
RSI (for overbought/oversold confirmation)
MACD (trend confirmation)
Volume (for breakout confirmation)
3. Use multiple timeframes – e.g., 4H for trend, 15m for entry
4. Avoid chasing band breakouts without confirmation
5. Backtest strategies with your preferred asset
🧠 Advanced Concepts
Double Bottoms Outside Band: When price forms a W-bottom with the second low outside the lower band bullish reversal setup.
Walking the Band: In strong trends, price can "walk" along the band don’t fade too early.
Band Width: Track the width of bands to detect upcoming breakouts.
⚠️ Disclaimer
This guide is for educational purposes only and does not constitute financial advice. Trading involves risk, and past performance does not guarantee future results. Always do your own research (DYOR) and consult with a financial advisor before making any investment decisions.
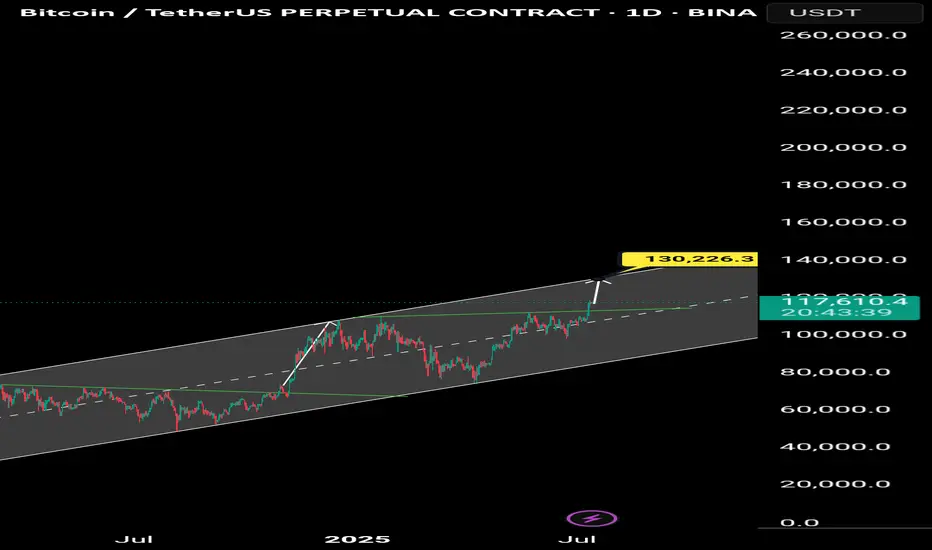
Bitcoin Go 130kBitcoin is heading towards 130,000 tomorrow
The alt season has begun and the market is sharply bullish.
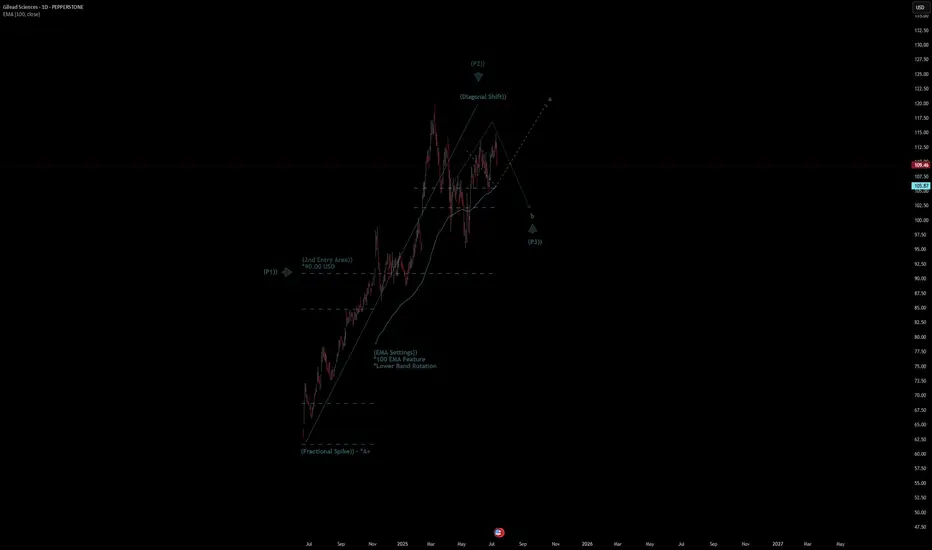
Gilead Sciences Quote | Chart & Forecast SummaryKey Indicators On Trade Set Up In General
1. Push Set Up
2. Range Set Up
3. Break & Retest Set Up
Notes On Session
# Gilead Sciences Quote
- Double Formation
* (Fractional Spike)) - *A+ | Completed Survey
* (2nd Entry Area)) - *90.00 USD | Subdivision 1
- Triple Formation
* (P1)) / (P2)) & (P3)) | Subdivision 2
* (TP1) = a / Long Consecutive Range
* (TP2) = b / Short Consecutive Pullback | Subdivision 3
* Daily Time Frame | Trend Settings Condition
- (Hypothesis On Entry Bias)) | Regular Settings
- Position On A 1.5RR
* Stop Loss At 98.00 USD
* Entry At 110.00 USD
* Take Profit At 126.00 USD
* (Uptrend Argument)) & No Pattern Confirmation
- Continuation Pattern | Not Valid
- Reversal Pattern | Not Valid
* Ongoing Entry & (Neutral Area))
Active Sessions On Relevant Range & Elemented Probabilities;
European-Session(Upwards) - East Coast-Session(Downwards) - Asian-Session(Ranging)
Conclusion | Trade Plan Execution & Risk Management On Demand;
Overall Consensus | Buy
HYPEUSDT KUCOIN:HYPEUSDT 4H Analysis Price has broken out above the 44.5 support zone and is holding strong 🚀. As long as this level holds, targets are set at 50.615 and 57.164 📈. If 44.5 breaks down, next support is seen at 40.433 🔻.
Key Levels:
✅ Support: 44.5
🟩 Targets: 50.615 → 57.164
🔴 Next support if breakdown: 40.433

#BTCUSDT(BITCOIN): Two Targets First $130,000 And Then $150,000Bitcoin is poised for significant distribution, with a potential price surge to $130,000, followed by a swing target of $150,000. The current accumulation phase is poised to transition into a substantial bullish move. We anticipate a surge in bullish volume in the coming days or weeks. Our analysis anticipates this transition to be completed by the end of the year or sooner.
It is important to note that this analysis does not guarantee a specific price movement and is provided solely for educational purposes.
We extend our best wishes for your successful trading endeavours. If our analysis has been of assistance, we would appreciate it if you could express your gratitude by liking and commenting.
For further insights, please follow our account.
Team Setupsfx_

#BTCUSDT: Major Bearish Correction?Bitcoin is currently undergoing a correction following its recent peak. While the initial price decline appeared insignificant, it has since experienced a substantial drop, suggesting a substantial volume of selling activity in the market.
We anticipate two potential areas where the price could reverse and resume its upward trajectory. These areas could lead to a price of 110,000, followed by 120,000, and ultimately reaching 150,000.
We strongly recommend that you implement rigorous risk management measures and conduct your own analysis before making any investment decisions.
Best regards,
Team Setupsfx_


SP500 TECHNICAL ANALYSIS 30 MINUTE TIME FRAME 📊 Technical Analysis – SP500 CFD (30-Minute Chart)
✅ 1. Overall Market Trend:
The market is currently in a range-bound structure after a sharp upward move toward the 6,296 level.
Price entered a clear supply zone and reversed sharply.
Multiple BOS (Break of Structure) and CHoCH (Change of Character) events indicate clear shifts in price behavior.
📌 2. Key Structure Zones:
🟩 Demand Zones:
6,240–6,250: First active demand zone — could trigger bullish reactions.
6,180–6,200: Deeper liquidity zone within the Discount area, ideal for long setups if tested.
Price is approaching equilibrium and preparing for a potential reaction.
🟥 Supply Zones:
6,290–6,300: This premium zone caused the recent rejection and is currently acting as short-term resistance.
📈 3. Price Action & Candles:
Price created a rising wedge near the highs, which broke down.
Strong bearish candles followed, breaking key short-term structure levels.
Price is now heading into the equilibrium zone and testing demand.
📌 4. Possible Scenarios:
🔻 If Price Falls:
Watch for a reaction at the 6,240–6,250 demand zone.
If this area breaks, the next downside target is 6,180–6,200 — a high-probability liquidity zone.
🔺 If Price Rebounds:
A bullish reaction from the current zone could send price back toward 6,270+.
A confirmed break of 6,296 would open the door to higher highs.
🧠 Summary Table:
Condition Analysis
Current Status In corrective phase after bullish impulse
Short-Term Trend Bearish structure active (BOS, CHoCH present)
Key Support 6,245 → 6,180
Key Resistance 6,290–6,300
Buy Opportunity Bullish confirmation at demand zones
Sell Opportunity Weak reactions or breakdowns below BOS
⚠️ Disclaimer:
This analysis is for educational purposes only and does not constitute financial advice or a buy/sell signal.
Always trade based on your personal strategy and risk management plan.
VANTAGE:SP500

USDT Dominance Is Still Bearish (1D)This index is still bearish. It could either drop from here or turn bearish again after a pullback to a higher level.
The larger structure is bearish, and the price is breaking through structures in an attempt to reach the main demand zone. This bearish trend is expected to continue.
Let’s wait and see what happens.
For risk management, please don't forget stop loss and capital management
Comment if you have any questions
Thank You

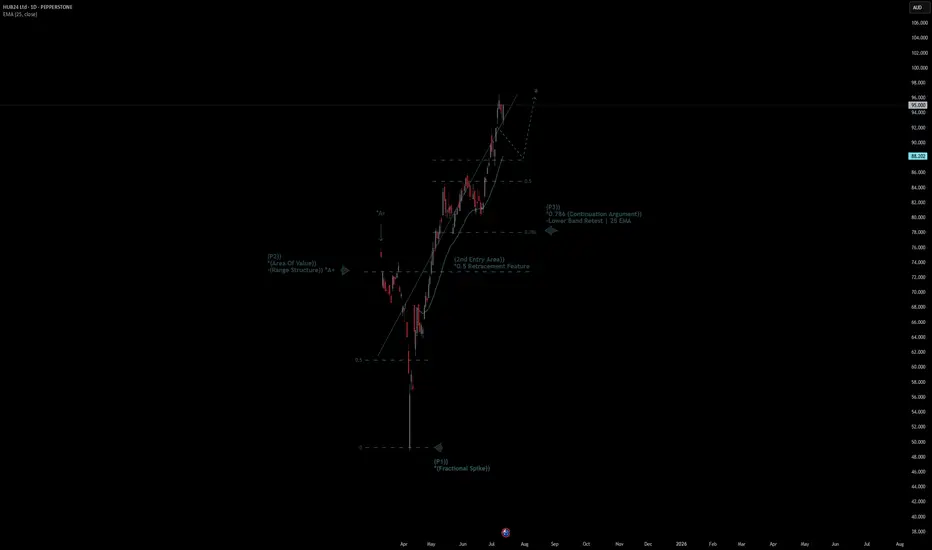
HUB24 Ltd Quote | Chart & Forecast SummaryKey Indicators On Trade Set Up In General
1. Push Set Up
2. Range Set Up
3. Break & Retest Set Up
Notes On Session
# HUB24 Ltd Quote
- Double Formation
* (Area Of Value)) - (Range Structure)) *A+ | Completed Survey
* (2nd Entry Area)) - *0.5 Retracement Feature | Subdivision 1
- Triple Formation
* (P1)) / (P2)) & (P3)) | Subdivision 2
* (TP1) = a / Long Consecutive Range
* (TP2) = b / Short Consecutive Pullback | Subdivision 3
* Daily Time Frame | Trend Settings Condition
- (Hypothesis On Entry Bias)) | Indexed To 100
- Position On A 1.5RR
* Stop Loss At 120.00 AUD
* Entry At 126.00 AUD
* Take Profit At 133.00 AUD
* (Uptrend Argument)) & No Pattern Confirmation
- Continuation Pattern | Not Valid
- Reversal Pattern | Not Valid
* Ongoing Entry & (Neutral Area))
Active Sessions On Relevant Range & Elemented Probabilities;
European-Session(Upwards) - East Coast-Session(Downwards) - Asian-Session(Ranging)
Conclusion | Trade Plan Execution & Risk Management On Demand;
Overall Consensus | Buy
XAUUSD - Will Gold Continue Its Rise?!Gold is trading above the EMA200 and EMA50 on the hourly chart and is trading in its ascending channel. We still have a bullish view on this commodity and we can expect to see $3,350. A correction towards the bottom of the ascending channel will also provide us with a better risk-reward buying opportunity.
According to the World Gold Council, physically backed gold ETFs attracted around $38 billion in investments during the first half of 2025. This marks the largest semi-annual inflow since the beginning of 2020. The remarkable surge is primarily attributed to heightened investor demand for safe-haven assets amid escalating economic and trade tensions triggered by President Trump’s tariff policies.
During this period, the total gold holdings of these funds grew by 397.1 tonnes, bringing their global assets to 3,615.9 tonnes by the end of June—the highest level since August 2022, although still below the all-time high of 3,915 tonnes recorded in October 2020.
U.S.-based funds led the inflows with an addition of 206.8 tonnes, while Asian funds—despite accounting for only 9% of total assets—captured 28% of global inflows, highlighting a significant rise in interest among Asian investors in gold.
This positive trend emerged after three consecutive years of outflows between 2021 and 2023, followed by modest inflows in 2024. Concurrently, gold prices have surged by 26%, reaching a record high of $3,500 per ounce in April.
The World Gold Council, established in 1987 and headquartered in London, is funded by major gold mining companies. Its main objectives include boosting global demand for gold, enhancing market accessibility, and promoting innovation within the gold industry. The council plays a crucial role in shaping global perceptions of gold as a financial asset.
However, some analysts argue that the council essentially functions as a powerful lobbying group for mining corporations, often releasing reports designed to bolster demand and foster a positive market sentiment toward gold.
On the other hand, Bank of America (BofA), in its latest report using a global trading time framework, analyzed the outlook for the U.S. dollar in the second half of 2025. Despite the dollar having its worst start to a year since 1973, the report suggests that selling pressures on the currency may ease going forward, particularly during U.S. trading hours.
U.S. Trading Hours and Federal Reserve Policy
The dollar’s cumulative performance during U.S. trading hours remains strongly correlated—at 71%—with Federal Reserve interest rate pricing. Given expectations for stable rates throughout the rest of the year, the dollar could find some support during this time frame.
Asia: The Main Driver of Dollar Selling in H1 2025
Asian investors were the largest sellers of the dollar during the first half of 2025. However, after fully unwinding the long positions accumulated over the past two years, dollar performance in Asian trading hours has now turned neutral. Fresh selling may remain limited unless new bearish catalysts emerge.
Europe: Tied to Global Equities’ Performance
Dollar weakness during European trading hours largely depends on the relative strength of global equities versus U.S. stocks. As U.S. equities reclaimed market leadership in the second quarter, European investors may have less incentive to continue selling dollars.
Decline in Currency Hedging Appetite
Following the dollar’s significant drop in the first half of the year, foreign investors are now less inclined to increase currency hedges on their dollar-denominated assets.
According to Bank of America’s trading time framework, the pace of the dollar’s decline is likely to slow in the second half of the year, especially during U.S. trading hours, as stable Federal Reserve policy removes a key bearish factor. Selling pressure from Asia is also expected to ease unless new downside triggers arise. The key variable going forward will be the relative performance of global equities versus U.S. markets.

ETHW Looks Bullish (12H)Considering the CH and bullish CHs on the chart, as well as the recent reclaim of key levels, we can maintain a bullish outlook on this coin.
The targets have been marked on the chart.
If a pullback occurs to the green zone, it could present a buy/long opportunity.
A daily candle close below the invalidation level will invalidate this analysis.
For risk management, please don't forget stop loss and capital management
Comment if you have any questions
Thank You

Bitcoin & new rallyBitcoin surpassed its previous all-time high of $112,000 and is now approaching $124,700, the third resistance level for July's pivot.

Bitcoin Breaks Above Prior Highs - What to ExpectFollow-Up Context:
As published previously, long positions were initiated around the $100,000–$102,000 support zone (green fair-value band & 200 DMA).
Current Outlook & Targets:
Quarterly Premium 1 (Q-P1) at $121,283 – first profit-taking objective.
Quarterly Premium 2 (Q-P2) at $135,387 – secondary bullish target if Q-P1 flips to support.
Key Levels Recap:
Support Held: $100 k–$102 k (fair-value confluence)
Liquidity Sweep: brief wick below to capture shorts before rapid reclaim.
No new entry is suggested here – we’re tracking progress toward the listed premium zones.

TECHNICAL ANALYSISI BTC 1 HR TIME FRAME 📊 Technical Analysis – BTCUSDT.P (1H Chart)
✅ 1. Overall Trend:
The market is in a strong bullish trend on the 1-hour chart, confirmed by multiple CHoCH (Change of Character) and BOS (Break of Structure) points.
📌 2. Price Structure:
🔹 First CHoCH:
Indicates weakness in the prior downtrend.
The following BOS confirms a structure shift to the upside.
🔹 Second CHoCH:
After a minor correction, buyers regained control.
Another BOS confirms continuation of bullish momentum.
🟢 3. Demand Zones:
Multiple demand zones are marked in green.
The most relevant zone right now is between 113,100 – 113,600, still untested.
A bullish reaction is likely if price pulls back into this area.
⚠️ 4. Current Price Action:
Price has reached around 115,487 after the latest BOS.
A minor bearish reaction is visible, suggesting a possible short-term correction.
As long as the BOS level holds, the overall structure remains bullish.
🔍 5. Candlestick Signal:
No clear Engulfing candle yet, but if:
A strong red candle forms followed by a full bullish engulfing candle within the demand zone,
→ that would be a valid Bullish Engulfing pattern and a potential reversal signal.
🎯 Conclusion:
Market structure is currently bullish.
Watch for pullbacks to the 113,100–113,600 zone.
Ideal entries come with confirmation (e.g., engulfing candle or strong rejection).
Always apply strict risk management.
❗️Disclaimer:
This analysis is for educational purposes only and does not constitute financial advice or a buy/sell signal.
Please do your own research and trade based on your personal strategy and risk tolerance.
BITGET:BTCUSDT.P

GBPUSD is in the Selling DirectionHello Traders
In This Chart GBPUSD HOURLY Forex Forecast By FOREX PLANET
today GBPUSD analysis 👆
🟢This Chart includes_ (GBPUSD market update)
🟢What is The Next Opportunity on GBPUSD Market
🟢how to Enter to the Valid Entry With Assurance Profit
This CHART is For Trader's that Want to Improve Their Technical Analysis Skills and Their Trading By Understanding How To Analyze The Market Using Multiple Timeframes and Understanding The Bigger Picture on the Charts

Bitcoin ATHBINANCE:BTCUSDT This is amazing for crypto community because this level-up all of lover crypto currencies.
Next target: 120.000K
Best for pollback levels: 111.000K & 105.500K
👓We are this time keep calms emotional in buy or sell.

BTC Leg2 115KBINANCE:BTCUSDT major movement from base 98K S to 106K $.BTC want to next movement to 115K $ but in middle of way 110K $ level there are sellers.
Support: 106.000 - 102.000
Resistance: 110.400 - 115.000
⚠️Control Risk Management

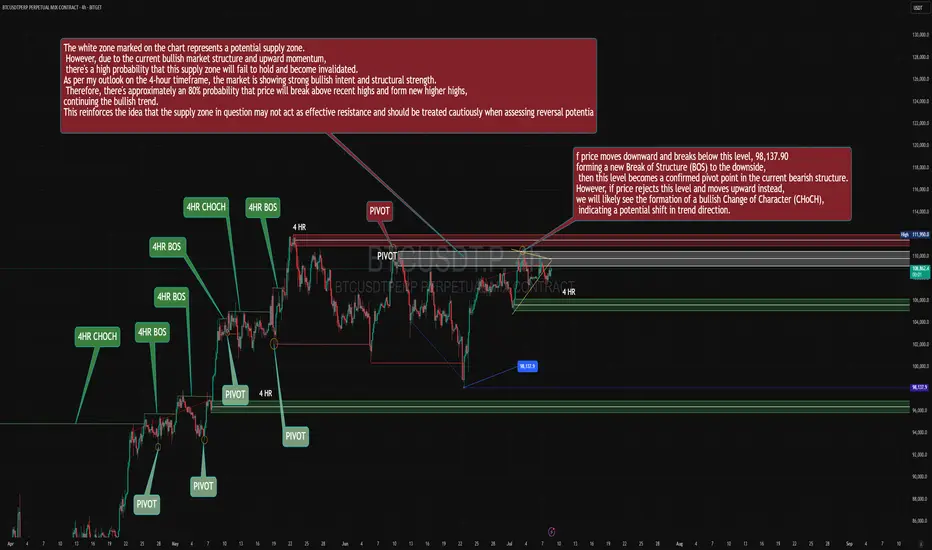
BTC/USDT Multi - time frame analysis and {4HR }BTC/USDT Multi-Timeframe SMC Analysis – July 8, 2025
1. Top-Down Analysis:
Daily Timeframe (Macro Market Structure & Narrative - Inferred from chart context):
The broader market structure indicates a prolonged consolidation phase, initiated around mid-June, characterized by defined support and resistance levels. The identified supply zone, ranging approximately from $108,000 to $109,500 and labeled as "Potential Supply Zone" on the chart, is a key daily-level area.
Crucially, despite entering this daily supply, the strong underlying bullish order flow suggests a high probability that this supply zone may not act as an effective distribution point. The overarching narrative from higher timeframes indicates robust institutional buying pressure, implying a potential shift in the broader trend to unequivocally bullish upon a clear breach of this daily supply.
4H Timeframe (Swing Structure, Internal BOS/CHoCH):
The 4H swing structure explicitly displays a very clear bullish order flow. We observe a series of consecutively confirmed CHoCH (Change of Character) and BOS (Break of Structure) to the upside (indicated by "4HR CHOCH" and "4HR BOS" annotations). This unequivocally establishes a decidedly bullish 4H swing bias.
The most recent 4H BOS occurred around the $107,000 level, after which price has continued its upward trajectory.
Price is currently engaging with a 4H supply zone (marked by the white box). However, given the dominant bullish order flow on the 4H, there is a high probability that this supply zone will be invalidated, allowing price to extend its bullish movement. This phenomenon often signifies an "Imbalance Fill" or "Liquidity Grab" by smart money to fuel further upside.
1H Timeframe (Entry-Level Structure & POIs):
The 1H timeframe currently reflects a phase of consolidation or minor correction following the recent bullish impulse.
In alignment with the decisive bullish 4H bias, any retracement observed on the 1H timeframe is to be considered a buying opportunity.
The "PIVOT" marked around $105,000 serves as a potential 1H demand area, which could be a target for a deeper retracement before the continuation of the bullish move. However, considering the current market strength, price might not even reach this level and could resume its ascent from current or slightly higher levels.
The current "PIVOT" at approximately $108,500 represents a temporary internal resistance. A decisive break and sustained close above this pivot would provide stronger confirmation for the continuation of the bullish trend.
2. Identification:
Clean Breaks of Structure (BOS) and Changes of Character (CHoCH):
4H: Multiple clear bullish BOS and CHoCH events, indicative of strong bullish order flow.
1H: Internal structure currently shows consolidation prior to a likely bullish BOS to new highs.
Valid Supply & Demand Zones (Unmitigated only):
Unmitigated 4H/1H Supply Zone: Approximately $108,000 - $109,500 (marked by the white box). However, as noted, it is anticipated to be invalidated due to the overall bullish order flow.
Unmitigated 4H/1H Demand Zones: Lower down, around the $105,000 PIVOT and the green-shaded regions on the chart (potential demand areas that would activate upon a deeper retracement).
Internal and external liquidity pools (buy/sell-side):
External Buy-side Liquidity: Above the all-time highs or previous "High" (observed at $111,900 on the prior chart).
Internal Buy-side Liquidity: Above current range highs (approx. $109,500) and above recent pivots.
Internal Sell-side Liquidity: Below recent 1H pivots, particularly below $107,000 and $105,000 (which could act as inducement).
Inducement patterns and liquidity grabs (internal sweeps):
Any minor retracement or downside fluctuation from the current supply zone could act as inducement to draw in sellers, before price resumes its bullish trajectory.
Previous sweeps to the downside have served as confirmation of liquidity accumulation for prior bullish moves.
Order blocks, FVGs, mitigation blocks, and imbalance zones:
Given the impulsive nature of the bullish moves, bullish FVGs and OBs should be considered in retracements (e.g., around the $105,000 demand area).
The current supply zone (white box) also contains OB/FVG, but as mentioned, its invalidation probability is high.
Active market range and internal liquidity engineering:
The active 4H market range encompasses the recent bullish move from $102,000 to current highs.
Internal liquidity engineering currently involves drawing sellers into the supply zone and subsequently invalidating it for continued bullish advancement.
3. Delivery:
Directional Bias with Contextual Narrative:
Strongly Bullish. The 4H order flow is unequivocally bullish, with repeated confirmations of bullish BOS and CHoCH. While price is entering a supply zone, the overall bullish strength suggests it is highly probable this zone will be invalidated, leading to further upside to target new highs. The market narrative points towards a continuation of the uptrend, targeting external buy-side liquidity.
Actionable Setup (Long):
Asset: BTC/USDT Perpetual Futures
Entry Level (POI, OB or FVG):
Scenario 1 (Aggressive Entry - given market strength): Enter long within the $107,500 - $108,000 range (upon confirmation of bullish price action on the 1H or 15-minute timeframe within the supply zone, indicating its invalidation). This entry presumes the supply zone will be breached.
Scenario 2 (Conservative Entry - upon retracement): Enter long within the $105,000 - $105,200 range (the pivot area and potential demand zone). This point would activate upon a deeper retracement into a discount area.
Given the chart and current strength, Scenario 1 appears more probable, but price action confirmation is critical.
Stop-Loss (Invalidation Structure):
For Scenario 1: Place stop-loss below the last valid 1H structural low that confirms the bullish impulse, or below $106,500.
For Scenario 2: Place stop-loss below the demand zone and below the $104,500 pivot, e.g., $104,000.
Target Level (Minimum 3R+):
Target 1 (1R): $109,500 (Break of current supply range high and liquidity grab).
Target 2 (2R): $111,000 (Retest of previous "High").
Target 3 (3R+ / Primary Target): $112,500 - $113,500 (Formation of new highs and targeting fresh buy-side liquidity).
R-multiple Calculation Example: If for Scenario 1, entry is $107,700 and stop is $106,500 (1200 points risk), a 3R target would be $107,700 + (3 * $1200) = $111,300, which aligns with our targets.
Confluences:
Multi-Timeframe Alignment: Decisive bullish 4H order flow provides strong support for a bullish bias, treating any retracement as an opportunity.
Liquidity: New highs and external buy-side liquidity serve as clear targets.
Supply Zone Weakness: Despite price entering a supply zone, the underlying bullish strength suggests its probable invalidation.
Pivot Price Action: Repeated bullish pivots and structural breaks confirm the trend.
This analysis presents a high-conviction long setup for BTC/USDT. However, close attention to price action confirmations on lower timeframes (e.g., 1H or 15-minute) within the current supply zone will be crucial for aggressive entry. Should price retrace, anticipate a bounce from lower demand zones.
Disclaimer: This is a market analysis based on current price action and structure. It does not constitute a buy or sell signal. Always conduct your own research and risk assessment before taking any trades
BITGET:BTCUSDT.P
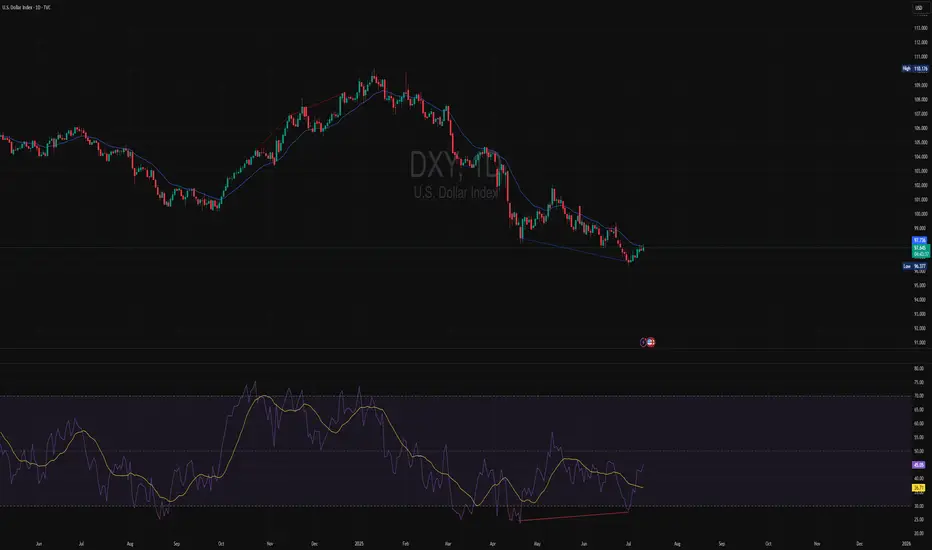
DXY-Technical Analysis DAILY Timeframe 📊 DXY – Technical Analysis (1D Timeframe)
🔷 Overall Trend:
The Dollar Index (DXY) has been in a strong downtrend for several months, forming multiple confirmed Breaks of Structure (BOS) to the downside.
However, recent price action is showing signs of momentum loss and potential exhaustion from sellers near the current lows.
🟡 Market Structure:
Price recently formed a lower low, but momentum indicators are showing bullish divergence — suggesting the downward pressure is weakening.
A small bullish reversal candle has printed, indicating potential short-term buying interest.
There is no confirmed bullish CHoCH yet, but structure is starting to slow down and compress — signaling a possible shift.
📉 Indicators (RSI ):
RSI is rebounding from oversold territory, showing potential early reversal signals.
The confirms bullish divergence and shows fading bearish momentum.
Overall, sellers are showing reduced strength, increasing the chance of a corrective move to the upside.
🔹 Key Levels:
Immediate resistance zones:
🔹 97.23 and 97.73 — key levels to watch for bullish continuation.
Major support:
🔻 96.34 – 96.50 — current low area that if broken, will confirm further downside.
✅ Conclusion:
While DXY remains structurally bearish, the recent bullish divergence, loss of selling momentum, and RSI recovery suggest the potential for a short-term correction or bounce.
A confirmed CHoCH and break above 97.73 would signal a potential shift to bullish structure.
If price fails to break resistance and drops below 96.34, the bearish trend is likely to continue.
🟢 Scenario Table:
Scenario Trigger Implication
Bullish shift Break above 97.73 with CHoCH Potential trend reversal
Continuation bearish Break below 96.34 Downtrend continuation
Disclaimer: This analysis is for informational and educational purposes only. It does not constitute financial advice or a recommendation to buy or sell any asse
USDCHF – Key Resistance TestUSDCHF is currently ranging after a strong downtrend, now testing the 0.79886 resistance level. Price is bouncing between this resistance and support at 0.79178, showing signs of indecision.
Support at: 0.79178 🔽
Resistance at: 0.79886 🔼
🔎 Bias:
🔼 Bullish: Break and close above 0.79886 targets 0.80697 and possibly 0.81564.
🔽 Bearish: Rejection from 0.79886 and break below 0.79178 could resume the bearish trend.
📛 Disclaimer: This is not financial advice. Trade at your own risk.
