XAU/USD For Bullishyou can take small short position now to entry point
or
wait for pull-back near by entry point to go long
general trend is up trend
have fun :)
Pivot Points

XAG/USD For Bullishwait for pull-back near by entry point and then go long
general trend is up trend
General rule: buy at the bottom
have fun :)

XAUUSD – The Setup’s Already BreathingFlipped to the 15M so they don’t see the precision… but this is 5M business.
IDM below that HH is baiting price back in—liquidity needs to get swept.
Once the zone’s kissed, I’m hunting the micro LH to get smoked.
The move’s already loaded… just waiting on the trigger.
They watching. I’m waiting. That’s the difference.
Bless Trading!

Bitcoin (BTC/USD) Analysis – 1H
🏛 1. Current Market Structure
📉 Price is currently moving within a small ascending channel after rejecting the red zone (IFVG 1D), but this move might be a bear trap.
⚠️ A downside breakout is likely, aiming to sweep liquidity lower.
🌍 2. Bigger Picture Outlook
🔍 The market could drop toward the grey support zone (below $91,500) before a potential bullish recovery.
📅 Overall structure remains dependent on a key macro catalyst, particularly Jerome Powell's upcoming speech.
🔍 3. Key Technical Observations
🟥 IFVG 1D: Clean rejection from this zone, increasing selling pressure.
📉 Suspicious ascending channel: Often a corrective pattern before continuation downward.
🟩 FVG 1D below: A potential liquidity zone, likely to trigger a reaction if tested.
🎯 4. Short-Term Expectations
📉 Favored bearish scenario:
Channel breakdown
Liquidity sweep
Retest of the grey support area (~$91,000)
📈 Bullish reaction possible afterwards, depending on how price behaves at support and macro conditions.
🔥 5. Upcoming Catalysts
🕰 Powell’s speech on Wednesday: Highly anticipated by the market.
💸 A rate cut could support BTC, but short-term uncertainty keeps pressure on price.
🔎 Until then, expect high volatility as the market seeks clarity.
✅ Conclusion
👉 Current price action suggests a bear trap with a likely liquidity grab to the downside.
📍 Key levels to watch:
Grey support zone (~$91,000)
Green FVG 1D (~$89,000)
Market reaction post-FOMC
⏳ Until the FED decision, the market remains fragile and liquidity-driven.

XAUUSD – Calm Before the LaunchMarked this IDM sitting under the HH with clean structure flowing bullish on 4H and 30M.
Flipped to the 2H for a smooth Bird’s Eye view—just watching now, waiting for that sweep and micro shift to load up.
The market’s breathing, building up energy. Once it taps in and confirms, it’s game time.
Let the liquidity do the work. I’ll handle the entry.
Bless Trading!

GU Long – Clean CHoCH Flip Off 30M OBCaught the buy after price tapped into a clean 30M order block—sat back and waited for that CHoCH flip to confirm the bulls were stepping in.
Didn’t force the entry. Let the structure shift, watched the reaction, then locked in.
Now holding toward the highs with full control—trade’s in motion and I’m just managing the play.
Patience > impulse. Let the market tell you when it’s ready.
Bless Trading!

EU – Sniper Precision Off the 5M OBMarked my 5M order block off the last sell candle before the internal break of structure. Price showed bullish reaction early, but I didn’t flinch—no need to chase or expand the zone.
Skipped the 10M OB, stayed patient, and let price build the narrative:
• CHoCH forming
• Liquidity sweep in motion
• IDM cooking
Now I’m posted, waiting for price to tap into my 5M OB and flip with a micro LH for the entry.
No guessing. No rushing. Just letting the market come to me.
Bless Trading!

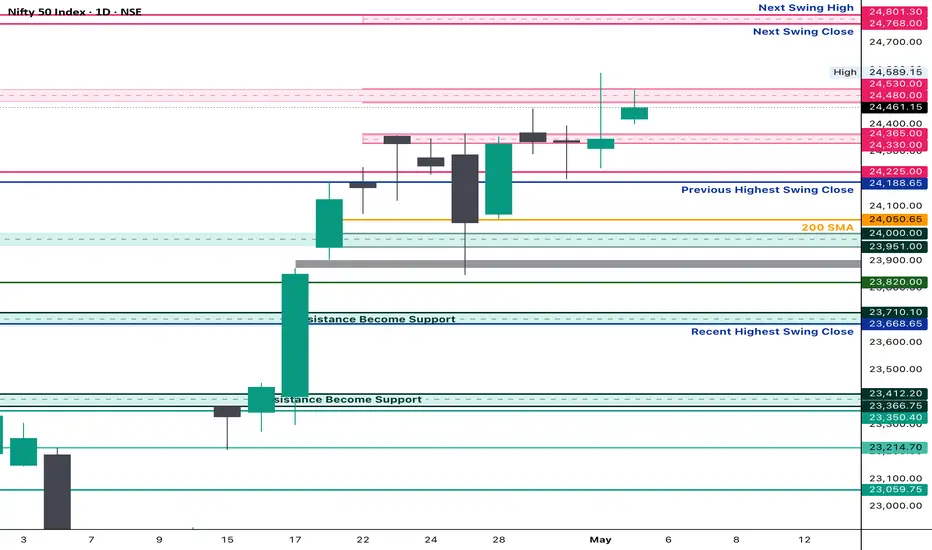
Nifty EOD Analysis – May 3, 2025 Monday🟢 Nifty EOD Analysis – May 3, 2025 Monday🔴
A positive open... but no follow-through. Still stuck in consolidation.
📊 Nifty Summary
Nifty opened with a gap up of 72 points at 24,420, marking the first open above 24,365 in the last 7 sessions — a positive sign. However, the enthusiasm lacked momentum. Price struggled to cross the resistance at 24,526, and the index drifted back toward the mean, trading the entire day between the initial balance (IB) range and hovering around VWAP.
🔹 Intraday Movement: Just 125 points, the smallest in the last 12 sessions — a clear sign of contraction.
🔹 Closing: 24461 closing is the first closing above 24365 in the last 7 sessions.
🔹 Structure: Daily candle formed an Inside Bar, signaling potential energy buildup.
📌 Strategy Forward: Stay alert for an expansion move from this coil — contraction often precedes sharp action.
📌 5 Min Time FrameChart
📌 Daily Time FrameChart
🕯️ Daily Time Frame Chart & Candle Breakdown
🔍 Today’s Candle Type: Spinning Top with a long upper wick
Candle Definition:
A Spinning Top reflects market indecision — both bulls and bears attempted moves, but neither gained dominance. A long upper wick with a narrow body often signals failed bullish momentum or fading enthusiasm.
📌 Today’s OHLC:
Open: 24,419.50
High: 24,526.40
Low: 24,400.65
Close: 24,461.15
Change: +114.45 (+0.47%)
🧱 Candle Structure:
🔹 Real Body:
🟢 Green candle with a modest body →
24,461.15 – 24,419.50 = 41.65 pts
🔹 Upper Wick:
24,526.40 – 24,461.15 = 65.25 pts
🔹 Lower Wick:
24,419.50 – 24,400.65 = 18.85 pts
📖 Candle’s Interpretation:
Despite a strong open and attempt to push higher, the resistance at 24,526 capped the move. The long upper wick shows that buyers lacked follow-through strength, and the close back near the middle of the range indicates a market still stuck in balance.
📉 The Inside Bar + Narrow Range combo is a potential signal for volatility ahead — traders should watch closely for a breakout from this range.
⚔️ Gladiator Strategy Update
📊 Strategy Parameters:
ATR: 303.46
IB Range: 110.65 pts
IB Category: Medium IB
Market Structure: Balanced
📌 Trade Highlights:
Trade Count: 0
❌ No Trigger generated by the system — a no-trade day.
🧠 Note: In contraction phases, it’s common to get fewer setups. Patience is key.
🔮 What’s Next?
Markets are coiling tightly, and an expansion move is likely around the corner. As long as price holds above the 24,330–24,360 band, bulls have hope — but conviction is needed above 24,540.
🧱 Support & Resistance Levels
🔺 Resistance Zones:
24,480 ~ 24,540 (Includes psychological level: 24,500)
24,590 (PDH – Immediate hurdle)
24,800
🔻 Support Zones:
24,400 (CDL)
24,330 ~ 24,360
24,190 ~ 24,225 (Immediate Support)
24,120
24,050
24,000 ~ 23,950
23,820
23,710 ~ 23,660
23,500
23,410 ~ 23,370
23,215
✏️ Disclaimer
This is just my personal viewpoint. Always consult your financial advisor before taking any action.
Little Rest For SPXI think the SPX structure is more prone to bearishness. There is a structure that will probably move quickly in one direction. I don't think a good structure has been formed for a bottom. And the rise does not seem very strong. For this reason, I expect an increase after the first fall.
Since this situation will probably reflect on crypto, my bearish contracts are still in place. But I am thinking of buying a bullish contract until the FOMC time.

GOLD(XAUUSD) -Weekly Forecast,Technical Analysis & Trading IdeasMidterm forecast:
2772.38 is a major support, while this level is not broken, the Midterm wave will be uptrend.
TVC:GOLD OANDA:XAUUSD
Technical analysis:
A trough is formed in daily chart at 2956.50 on 04/07/2025, so more gains to resistance(s) 3357.00, 3500.00 and more heights is expected.
Take Profits:
2833.00
2879.11
2955.00
3057.40
3160.00
3257.03
3357.00
3500.00
__________________________________________________________________
❤️ If you find this helpful and want more FREE forecasts in TradingView,
. . . . . . . . Hit the 'BOOST' button 👍
. . . . . . . . . . . Drop some feedback in the comments below! (e.g., What did you find most useful? How can we improve?)
🙏 Your support is appreciated!
Now, it's your turn!
Be sure to leave a comment; let us know how you see this opportunity and forecast.
Have a successful week,
ForecastCity Support Team

GBP/NZD For Bullish as Pull-backyou can go long now
or
wait for entry point and then go long
general trend is down trend
current phase is pull-back and may be end at target 3
have fun :)

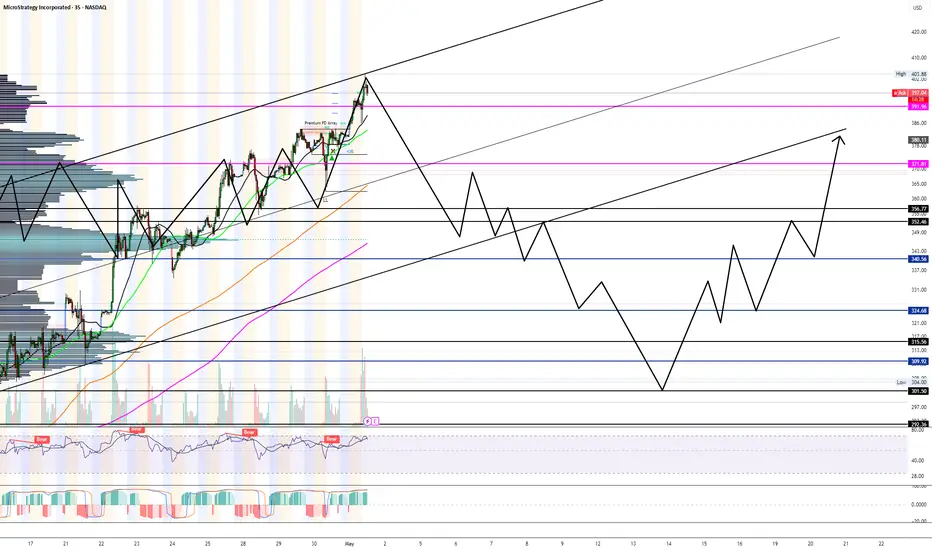
Just hit major resistance w/ bearish indicators.Target level is $415 to $400.
Political news will most likely influence this move. Earnings were great.
Huge volume profile gap that I think will be closed.
Watch out for another bull trap soon, but I think we just peaked.

USD/CAD For Bullish as pull-backyou can go long now
or
wait for entry point and then go long
general trend is down trend
current phase is pull-back
your confirmation for bullish will be break the red arrow level and come back to retest it and then go up to target 2
have fun :)

I think were due for bad earnings reaction for once.As seen in the chart, we are at the top of the range with highly over extended price movement and hitting the largest target number at $400 which has been sought after for months.
I think a snap down to $360-$350 is inevitable.
If we do pop up to $420+ then its a blow off top unless market reacts positively to government involvement to crypto.
GBP/AUD For Bullish as pull-backyou can go long now
or
wait for entry point and then go long
general trend is down trend
current phase is pull-back and may be end at target 3
have fun :)

NZD/JPY For Bearish as pull-backyou can go short now
or
wait for entry point and then go short
general trend is up trend
current phase is pull-back may be end at target 3
have fun :)

AUD/JPY For Bearish as Pull-backyou can go short now
or
wait for entry point and then go short
general trend is up trend
current phase is pull-back may be end at target 3
have fun :)

CAD/JPY For Bearish as pull-backwait for pull-back near by entry point and then go short
general trend is up trend
current phase is pull-back
have fun :)

USD/JPY For Bearish as pull-backwait for pull-back near by entry point and then go short
general trend is up trend
current phase is pull-back
have fun :)

XAU/USD For Bullishwait for pull-back near by entry point and then go long
general trend is up trend
have fun :)

Short-term Short entry in about 12 hours (+Long term entry)I use a combination of Support resistances, FVG, Fib Retracements, trendline, 5 waves, etc.
To keep it simple... (I add more stuff later)
Short term:
Good possible short entry STARTING 95236-95808 to target 89k-88,547 (Using FVG & Support Resistance)
Long term:
Start looking for longs starting at 81283 - 77908 (SL has to be below the 78400 candle) More update for long term strategy later on...

ETH Comeback ? Get the Champagne Ready ...Hello Traders 🐺
Hope you're all doing well.
Let me be honest with you — when I first looked at this chart, I thought:
“This could be the reversal we've been waiting for over the past two years!” 🔥
So please, take this setup seriously. If you manage it wisely, it could offer a highly profitable opportunity 👀📈
⚙️ What’s happening?
On the chart, we clearly see a bullish divergence on the RSI — and that’s always the first signal worth paying attention to.
These divergences usually indicate that bearish pressure is fading, and it's time for the bulls to take over 🐂
But that's not all…
This potential reversal is forming right above one of the most significant historical support zones on the ETH/BTC chart — a massive confluence.
And as you know:
"The higher the time frame, the more meaningful the level."
chart :
🎯 Price Targets:
On the 4H chart, after a clean bear trap, ETH/BTC started to bounce back and is now testing the neckline resistance at 0.01930.
If we see a breakout here, the next price targets are:
Previous local high at 0.02028
And a short-term target around the red resistance box near 0.02137
This setup could mark the beginning of a new Altseason — or at least a strong ETH-led rally.
So act accordingly, manage risk, and as always:
🐺 Discipline is rarely enjoyable, but almost always profitable. 🐺
🐺 KIU_COIN 🐺

btc fibonacci levels btc levels are holding we need to hold 94178 level or we are going to break down to 93710 looking to see if we break 94937 but looking like resistance
