GBPJPY is Holding above the Support , All Eyes on BuyingHello Traders
In This Chart GBPJPY HOURLY Forex Forecast By FOREX PLANET
today GBPJPY analysis 👆
🟢This Chart includes_ (GBPJPY market update)
🟢What is The Next Opportunity on GBPJPY Market
🟢how to Enter to the Valid Entry With Assurance Profit
This CHART is For Trader's that Want to Improve Their Technical Analysis Skills and Their Trading By Understanding How To Analyze The Market Using Multiple Timeframes and Understanding The Bigger Picture on the Charts
Pivot Points

GBPUSD is in the Selling DirectionHello Traders
In This Chart GBPUSD HOURLY Forex Forecast By FOREX PLANET
today GBPUSD analysis 👆
🟢This Chart includes_ (GBPUSD market update)
🟢What is The Next Opportunity on GBPUSD Market
🟢how to Enter to the Valid Entry With Assurance Profit
This CHART is For Trader's that Want to Improve Their Technical Analysis Skills and Their Trading By Understanding How To Analyze The Market Using Multiple Timeframes and Understanding The Bigger Picture on the Charts

SAGA Rebuy Setup (8H)A strong move has formed, and we have a bullish CH (Change of Character) on the chart.
We can look for buy/long positions around key zones, as buyers are present in these areas.
We are focusing on buy/long positions at the entry points.
Targets are marked on the chart.
A daily candle close below the invalidation level will invalidate this analysis.
For risk management, please don't forget stop loss and capital management
Comment if you have any questions
Thank You

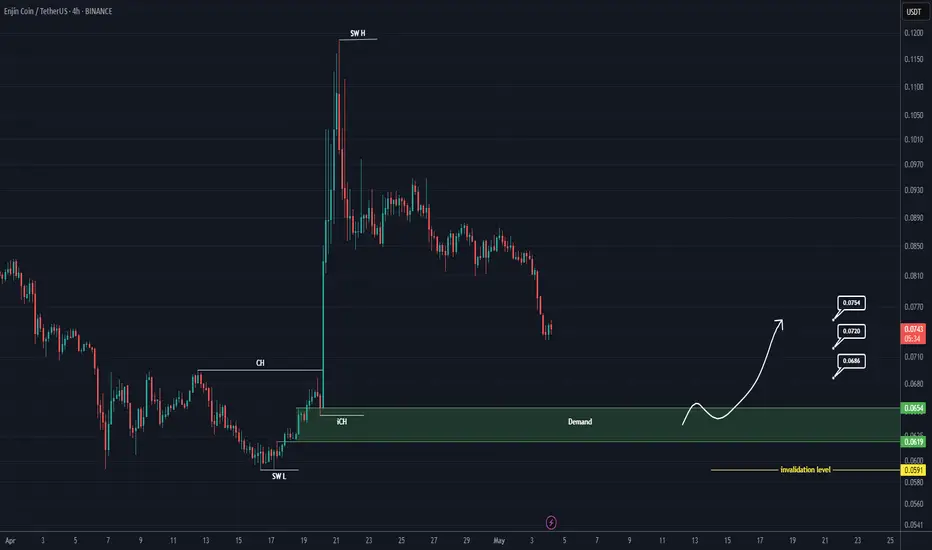
ENJ Buy/Long Setup (8H)After a bullish move and the formation of a strong change of character (CH), followed by a FOMO-driven ENJ rally, the price is now approaching support zones. In areas where strong buyers were previously active, we can look for a buy/long position.
The origin of this move is expected to hold, and price is likely to move toward higher zones.
We are looking for a buy/long position around the demand zone.
Targets are marked on the chart.
A daily candle close below the invalidation level will invalidate this analysis.
For risk management, please don't forget stop loss and capital management
When we reach the first target, save some profit and then change the stop to entry
Comment if you have any questions
Thank You
UNH close to pivotUNH finds itself right on the 100 monthly EMA which is an insane moving average to touch. The stock has also corrected into the golden pocket between the .5-.618 fib which is one of my favorite setups especially on weekly plus timeframes. The last time advanced stochastic was this low was the 2008 financial crisis.
Net long here, would love 375 but as this is a monthly chart the buy signal is now

SPY pump townAs the doomsayers are becoming quiet the market is realizing the economy isnt so crushed after all. Earnings speak for themselves here. MSFT, META, AMZN, and GOOGL all had amazing earnings despite tariff news and "declining GDP". GPD is a trash tier measure anyways. I have moved to much longer term trading and investing styles and have also been mostly selling options. I am new long here on QQQ and SPY related stocks.

USDJPY⚡️After the trendline break and retest
⚡️ Expecting market to rally up to the next point of interest.
Feel free to tell me what you think in the comment section.

USDJPY⚡️After the trendline break and retest
⚡️ Expecting market to rally up to the next point of interest.
Feel free to tell me what you think in the comment section.

EURUSD: Detailed Support & Resistance Analysis 🇪🇺🇺🇸
Here is my latest structure analysis
and important supports & resistances on EURUSD
for next week.
Consider these structures for pullback/breakout trading.
❤️Please, support my work with like, thank you!❤️
I am part of Trade Nation's Influencer program and receive a monthly fee for using their TradingView charts in my analysis.

GOLD (XAUUSD): Support & Resistance Analysis For Next Week
Here is my latest structure analysis for Gold.
Resistance 1: 3260 - 3288 area
Resistance 2: 3350 - 3386 area
Resistance 3: 3482 - 3501 area
Support 1: 3191 - 3210 area
Support 2: 3135 - 3167 area
Support 3: 2956 - 2981 area
Consider these structures for pullback/breakout trading.
❤️Please, support my work with like, thank you!❤️
I am part of Trade Nation's Influencer program and receive a monthly fee for using their TradingView charts in my analysis.

Bitcoin Analysis (4H)Bitcoin has lost its trendline and appears to have accumulated significant sell orders near the top.
The zone between $96K and $100K could act as the main supply area, potentially pushing the price down to at least $88K.
Targets are clearly marked on the chart.
A daily candle closing above the invalidation level would invalidate this outlook.
Do not enter the position without capital management and stop setting
Comment if you have any questions
thank you

ETHEREUM New Update (1D)Price has approached a supply (flip) zone. It is not expected to break this zone on the first attempt, and bears are likely to regain control for now.
If Ethereum returns once again to the lower zones marked on the chart, it could present a low-risk opportunity for buy/long positions.
The main target can be the upper supply zone.
A daily candle closing below the invalidation level would invalidate this analysis.
Do not enter the position without capital management and stop setting
Comment if you have any questions
thank you

EPIC New Update (8H)EPIC appears ready for a rejection to the downside and a drop.
Maintaining the supply zone, it could drop further.
The marked demand zone could potentially reject the price back upward again.
Do not enter the position without capital management and stop setting
Comment if you have any questions
thank you

MAGIC Rebuy Setup (4H)This analysis is an update of the analysis you see in the "Related publications" section
The price didn’t reach our red zone for entering a Sell/Short position, but the trend reversal outlook on MAGIC was correct.
We are now looking for a potential Buy/Long position near the support zone.
We will only enter a Buy/Long position if the price touches the green zone.
Targets are marked on the chart.
A daily candle close below the invalidation level will invalidate this analysis.
For risk management, please don't forget stop loss and capital management
When we reach the first target, save some profit and then change the stop to entry
Comment if you have any questions
Thank You

Btc heads and shoulder formation Longterm (Neutral)heads and shoulder forming, bullish/bearish depending if your a day trader or a hedge funder. Similarities to Jan 11 2021 Heads and shoulder, Short term bearish, long term bullish

USDCAD Technical Expert Review - 3 May 2025✅ Market Structure Summary:
The market entered a distribution phase, clearly forming equal highs and a head & shoulders–like pattern.
After breaking out of the descending wedge, price surged upward to tap the upper supply zone (gray), sweeping liquidity before dropping sharply.
We now see price reacting to a mid-demand zone, with another deeper demand zone resting below.
📍 Key Technical Zones:
🔹 Upper Gray Supply Zone:
This zone was tapped after liquidity was grabbed from the equal highs.
Strong bearish rejection with impulse candles confirms it as a valid shorting zone.
It remains active and could act as a trap if retested without proper bullish structure.
🔹 Mid-Demand Zone (current reaction point):
Price is currently reacting from this area.
Initial bullish reaction is visible, but the reaction isn't strong enough yet to confirm reversal.
Weak buyer pressure (wicky candles) suggests vulnerability.
🔹 Lower Demand Zone (main target if breakdown occurs):
If the current zone fails, price will likely drop toward this deeper demand block, which hasn't been mitigated yet.
This area could offer a more solid foundation for a bullish reversal.
🔮 Forecast Scenarios:
📉 Primary Bearish Scenario:
If price fails to create higher highs from the current mid-demand zone:
Expect a continuation down toward the lower gray demand zone.
If that breaks, price could target the green higher-timeframe demand around 1.37200.
📈 Alternative Bullish Scenario:
If price builds structure and forms a higher high from this zone:
A short-term rally back toward the upper supply zone is possible.
However, without a strong breakout, that area still holds risk for another sell-off.

GBPUSD Technical Expert Review - 3 May 2025🔮 Price Forecast (Main Scenarios)
📈 Bullish Scenario (if price reacts from current level):
Price may bounce from the current 1H LQ Close zone (gray).
It could rally toward the upper 1H LQ Close zone (purple) to retest it and potentially trigger Phase 2 Inducement.
🎯 First target: 1.33150
🎯 Second target: 1.33450 (just below the 4H LQ Close)
📉 Bearish Scenario (if the current zone breaks):
A clean close below 1.32500 could open the path toward the 4H LQ Close zone.
🧲 Expect potential reversal around 1.31600–1.31800 (major buy zone).

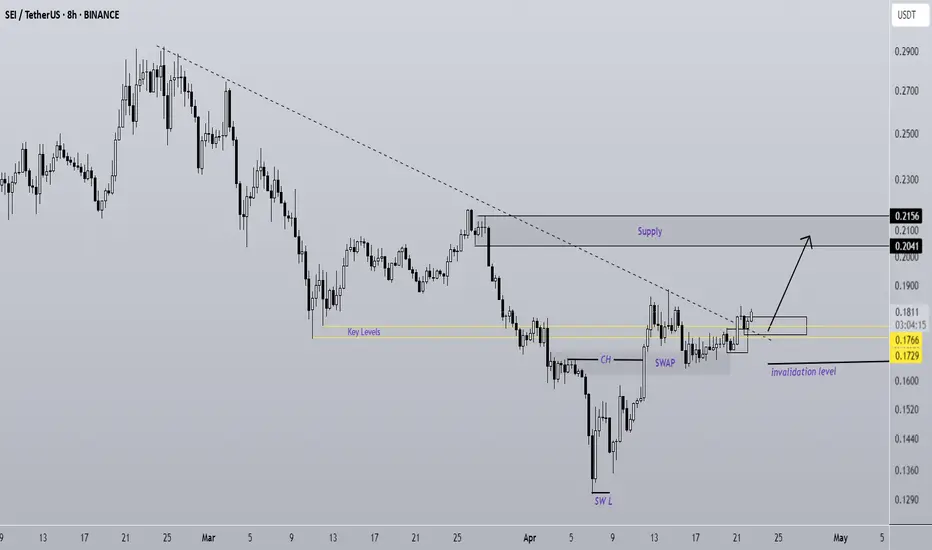
SEI Is A Rocket (8H)SEI has started a strong move from the bottom.
After breaking through a resistance zone with little to no reaction, it has now formed a SWAP zone.
Buy orders have been effectively transferred from the SWAP area into the candles, and the price shows strong momentum to push toward higher levels.
As long as the demand zone holds, SEI has the potential to reach the marked target area | or even go beyond it.
However, a daily candle closing below the invalidation level would invalidate this analysis.
Do not enter the position without capital management and stop setting
Comment if you have any questions
thank you
ALPHA is Ready To Fly (8H)ALPHA has encountered a key zone filled with strong buy orders.
The volume of these orders appears sufficient to potentially pump ALPHA to higher levels.
On the chart, we also have bullish confirmations, such as the formation of a CH (Change of Character) and the breakout of the trigger line.
As long as the green zone holds, ALPHA can move toward the target profit (TP) levels marked on the chart.
However, a daily candle closing below the invalidation level would invalidate this analysis.
Do not enter the position without capital management and stop setting
Comment if you have any questions
thank you

Buying opportunity in CSPR (1D)We have a strong move origin and a fresh, unmitigated support trading range on the chart.
Previously, there was also a bullish CH, and a good time correction has formed. If the price reaches the Demand zone, we will look for buy/long positions.
Targets are marked on the chart.
A daily candle closing below the invalidation level will invalidate this analysis.
Do not enter the position without capital management and stop setting
Comment if you have any questions
thank you

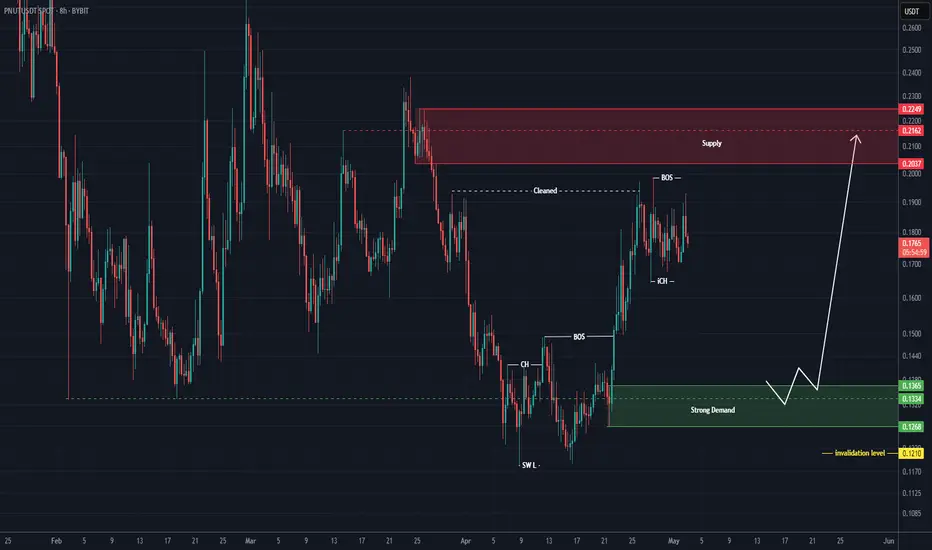
Strong rebuy setup for PNUT (8H)Note: This is not a sell/short setup | it is a buy/long setup.
After clearing resistance order blocks and a strong bullish move, buyers seem to have exhausted their momentum and may need a retracement for price to return to their base.
We are looking for a rebuy within the green zone. The price is likely to move from this area toward the red box.
A daily candle closing below the invalidation level will invalidate this analysis.
For risk management, please don't forget stop loss and capital management
Comment if you have any questions
Thank You
Where Should We Rebuy The PUMP? (8H)With the large bearish master candle formed at the top, the structure has turned bearish.
The green zone is the best and lowest-risk area for long positions or rebuys.
Reaching this zone may take some time, but you can already add this symbol to your watchlist and wait for it to reach the area before entering a position.
A 25%–45% return can be expected from this zone.
A daily candle closing below the invalidation level will invalidate this analysis.
For risk management, please don't forget stop loss and capital management
Comment if you have any questions
Thank You

DXY Technical Expert Review - 3 May 2025Weekly Price Reaction Expectations:
Overall, for this week, we expect a price reaction around the ATI candle zone, followed by another potential reaction near the upper LQCLOSE BOX area.
DXY Bullish Momentum Justification:
Additionally, since the LPP or investment liquidity has been consumed, the bullish momentum in DXY appears more justified.
