NZD/USD For Bearish as pull-backwait for pull-back near by entry point and then go short
general trend is up trend
current phase is pull-back
have fun :)
Pivot Points

HOW-TO: Use the Camarilla Pivots & BBT Strategies indicatorThis how-to shows the Camarilla Pivot & BBT Strategies indicator in action, the 5-minute timeframe is ideal for this. It shows the price action reacting to the HA play (S3 to R3 traversal). The "H" means that the ticker is in a Higher range on this day, the "A" refers to the label on the strategy in the image. In fact, the price does past R3 (which is the exit point) and reaches R4, at which point it trigger the "E" play, which is an R4 extreme reversal. A great trade, if you took it!

NVDA longNASDAQ:NVDA has borken out of its channel and is pushing up, forming a dubble bottom. NASDAQ:NVDA is looking very bullish based on TA rnight now.

GBP/USD For Bearishwait for pull-back near by entry point and then go short
general trend is up trend
current phase is pull-back
have fun :)

AUD/CAD For Bearishwait for pull-back near by entry point and then go short
general trend is up trend
current phase is pull-back
have fun :)

GBP/CAD For Bearishwait for pull-back near by entry point and then go short
general trend is up trend
current phase is pull-back
GBP under pressure
have fun :)

CAD/JPY For Bullishyou can go long now
or
wait for pull-back near by entry point and then go long
general trend is up trend
have fun :)

EUR/CHF For Bullishyou can go long now
or
wait for pull-back near by entry point and then go long
general trend is up trend
have fun :)

USD/JPY For Bullishwait for pull-back near by entry point and then go long
general trend is up trend
have fun :)

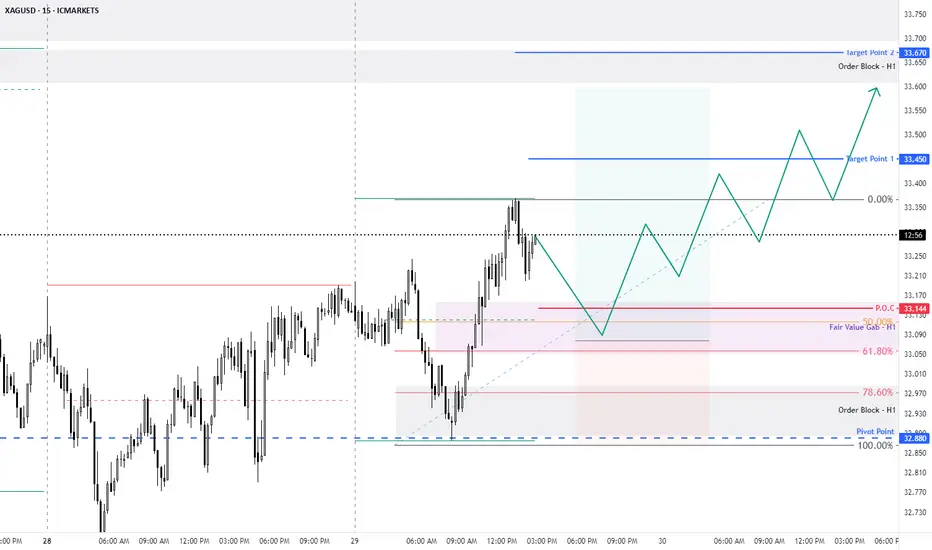
XAG/USD For Bullishwait for pull-back near by entry point and then go long
general trend is up trend
have fun :)
Emerging Swing Trade OpportunityHello,
GBPUSD sees more downside as the dollar stays strong as doubts about fed rate cuts grow so the UK struggles to find a way out of the market slump that it is currently in.Early gains of +0.15% were seen as the USD came under pressure late in NY, following a +0.05% close. Trump advisors considering gradual tariff hikes led to USD selling in late NY. A survey shows UK firms reduced headcount late last year in response to a tax hike. Mixed daily momentum studies and expanding 21-day Bollinger bands are noted in charts. The 5, 10, and 21-DMAs are sliding, with weeklies remaining bearish, indicating a strong negative slip. The focus is on testing the 1.2038 low from October 2023, followed by the 1.1805 low in March 2023. Friday's high of 1.2322 and the well-tested 1.2465 21 DMA are the first resistance levels. Bulls need a close above the 1.2465 21-DMA to gain excitement. A swing trade opportunity is emerging, with strong daily and weekly resistance at 1.226201/1.241555 which have to confirm upside along the way and act as supports. Ultimately, we want the monthly initial support at 1.24809 to hold, ensuring a guaranteed upside.
No Nonsense. Just Really Good Market Insights. Leave a Boost
TradeWithTheTrend3344

USD/CHF Outlook: Bearish Shift ExpectedHello,
FX:USDCHF has experienced further upside, but downside is still expected. CHF maintains a stable monetary policy with a favorable risk stance, though economic data is mixed. Despite this, its safe haven status is influenced by regional factors, with a shift into bearish territory anticipated soon.
No Nonsense. Just Really Good Market Insights. Leave a Boost
TradeWithTheTrend3344

AUD/USD Recovery Amid Rate Cut ExpectationsHello,
OANDA:AUDUSD shows a slight recovery from multi-year lows, with AUD market expectations of a rate cut by the central bank. The Aussie experiences some relief, but risks remain skewed to the downside as key US inflation reports approach. Further downside is anticipated towards the strong monthly support at 0.600436.
No Nonsense. Just Really Good Market Insights. Leave a Boost
TradeWithTheTrend3344

NZD/USD: Confidence Boost Signals Potential ReversalHello,
OANDA:NZDUSD : Business confidence in New Zealand improved in the fourth quarter, reaching its highest level since Q2 2021, according to a private think tank on Tuesday. The NZIER's quarterly survey showed that a net 16% of firms expect better business conditions, compared to just 1% expressing pessimism in the previous quarter. This suggests we may see further support tests before a potential bullish reversal.
No Nonsense. Just Really Good Market Insights. Leave a Boost
TradeWithTheTrend3344

Canadian Dollar Rises Amid Tariff Concerns and Oil GainsHello,
FX:USDCAD : The Canadian dollar slightly rose against the U.S. dollar, with bond yields reaching multi-month highs, partly recovering from recent declines due to U.S. trade tariff threats. The loonie traded at 1.4405 to the U.S. dollar, recovering from a near 5-year low in December. Concerns about potential U.S. tariffs and their impact on the Bank of Canada have influenced the market. Despite strong job data in December, investor confidence in further BoC rate cuts has waned. Speculators have increased bearish bets on the Canadian dollar. Meanwhile, the U.S. dollar gained against major currencies as expectations for Federal Reserve rate cuts diminished. Oil prices rose 2.9% to $78.82 per barrel due to anticipated U.S. sanctions on Russian oil. The Canadian 10-year yield increased to 3.507%, marking its highest level since July 9.
For this pair a bearish reversal is still anticipated in the near future!
No Nonsense. Just Really Good Market Insights. Leave a Boost
TradeWithTheTrend3344

USD/JPY Bulls Charging: Can 144.88 Launch the Next Rally?Hello,
USD/JPY: Bulls Charging Up — Bigger Upside in Sight!
Current View:
USD/JPY bounced strongly from 140.00 and bulls are aiming for a bigger breakout. Momentum is building, and if key support levels hold, we could see much higher prices soon.
🔥 Why We’re Bullish:
Strong rebound from 140.00 support.
Price pushing against the 144.00 resistance and 38.2% Fibonacci retracement.
A break above 144.00 would unlock bigger upside potential.
Fundamentals (U.S. growth + possible BOJ disappointment) favor USD strength.
📈 Bullish Roadmap:
Level Action Next Target
144.00 Breakout and hold needed Move toward 144.881
144.881 (Important) If it holds as support, bullish continuation Rally towards 1M Pivot @ 149.266
149.266 If it holds as support, next move higher Push towards 1Y Pivot @ 152.9069
150.39–152.573 (Caution) 1M resistance zone — watch for possible pullbacks
If cleared: Full bullish extension Aim for Final Target: 155.135
🗓 Events to Watch:
BOJ Policy Meeting → Potential for yen weakness if BOJ disappoints.
U.S. GDP + Non-Farm Payrolls → Could boost USD strength.
⚡ Quick Visual Flow:
➡️ Break above 144.00 ➡️ Hold 144.881 as support ➡️ Target 149.266 ➡️ Break through resistance at 150.39–152.573 ➡️ Target 152.9069 ➡️ Final goal: 155.135
⚠️ Key Cautions:
150.39–152.573 is a major resistance area; expect possible profit-taking or heavy battles here.
If 144.881 fails to hold, short-term pullbacks to 140.00 could reappear — manage stops accordingly.
TL;DR:
✅ Bulls are strong.
✅ Watch 144.00 breakout and 144.881 support hold for bigger upside.
✅ Long-term targets: 149.266 → 152.9069 → 155.135, if major resistance breaks cleanly.
⚡ Stay updated on BOJ and U.S. data for confirmation!
The Support and Resistance outlined in green and red are the respective support/resistance for this pair currently for 1M-1Y timeframes!
No Nonsense. Just Really Good Market Insights. Leave a Boost
TradeWithTheTrend3344

Japan's Economic Outlook: Steady Progress Amid UncertaintiesHello,
FX:USDJPY will see downside as Japanese economic data remain positive, with recovery ongoing. The BOJ's outlook appears accurate, as the economy continues to progress steadily. Although uncertainties persist, they are unlikely to prevent the BOJ from raising rates in the future. The current account surplus is now Y3.3525 trillion, with a Y2.6911 trillion surplus anticipated. December bank loans increased by 3.1% year-on-year, following rises of 2.9% in November and 2.6% in October. Robust bank loans indicate that Japan Inc is progressing smoothly. There are uncertainties regarding new US Trump administration policies in 2025. Nonetheless, the domestic economy is stable, with trade with the US being the only question. This will be a solid bearish opportunity that will unfold shortly!
No Nonsense. Just Really Good Market Insights. Leave a Boost
TradeWithTheTrend3344

GE Aerospace Wave Analysis – 28 April 2025- GE Aerospace broke resistance area
- Likely to rise to resistance level 205.00
GE Aerospace recently broke the resistance area between the round resistance levels 200.00, 193.60 and the 61.8% Fibonacci correction of the downward impulse from March.
The breakout of this resistance area accelerated the active short-term impulse wave 3 from the start of April.
GE Aerospace can be expected to rise toward the next resistance level 205.00 (former top of wave b from the end of March).

SHIBUSDT Is Flashing Major Bearish Warnings – Are You Ready??Yello Paradisers, Have you been keeping an eye on SHIBUSDT? If not, now is the time. The market is showing clear signs of weakness that could lead to a significant bearish move, and many traders may not be prepared for what’s coming.
💎SHIBUSDT is currently looking bearish after forming a clear bearish Change of Character (CHoCH) on the higher timeframe. Adding to this, the price action on the lower timeframe is showing an internal Change of Character (I-CHoCH) originating from a 4-hour bearish Order Block (OB). This setup substantially increases the probability of a continuation to the downside.
💎What we are focusing on now is the potential pullback. If SHIBUSDT pulls back to fill the Fair Value Gap (FVG) or develops a bearish pattern from the Order Block, it would provide a strong short opportunity with an excellent risk-reward profile.
💎However, it is crucial to remain cautious: if the price breaks out and closes a candle above the identified Order Block, it would completely invalidate the bearish idea, and we would need to step aside from any short positions.
Remember, Paradisers, sustainable trading success comes from patience and disciplined execution. There is no need to rush. Waiting for confirmation will always keep you on the winning side. Be smart, wait for the right setup, and always trade like a professional. This is the only way you will make it far in your crypto trading journey.
MyCryptoParadise
iFeel the success🌴

GER40 TECHNICAL ANALYSISThe GER40 has been on a strong bullish run, but is now stalling just below the 22,444 🔼 resistance zone. Price is showing early signs of hesitation, suggesting potential for either a breakout continuation or a deeper pullback.
Support at: 21,973 🔽, 21,570 🔽, 20,900 🔽
Resistance at: 22,444 🔼, 22,800 🔼, 23,400 🔼
Bias:
🔼 Bullish: A clean breakout and retest above 22,444 could fuel a move toward the next major resistance at 22,800. As long as price holds above 21,973, the bullish structure remains intact.
🔽 Bearish: A failure to break above 22,444 combined with a break below 21,973 could trigger a pullback toward the 21,570 support zone.
📛 Disclaimer: This is not financial advice. Trade at your own risk.

India’s Rise as the Global Rice Leader: Asian OpportunitiesIndia has solidified its position as a global agricultural powerhouse, overtaking China to become the world’s leading rice producer in the 2024/25 season. India’s rice production has reached a record 147 million tons, marking its ninth consecutive year of growth. This milestone, coupled with record-high rice exports of 24.5 million tons, underscores India’s growing influence in global food markets. For investors, this shift presents compelling opportunities in Asian agriculture, particularly in India’s agribusiness sector.
India’s Rice Dominance: A Record-Breaking Year
The WASDE report tells to us that India has taken a leadership position in rice production, with output raised by 2 million tons to 147 million tons. This figure is based on the Indian government’s Second Advanced Estimate, which includes both kharif and rabi crops, alongside expectations of a robust summer crop similar to recent years. For the first time, India has surpassed China, which produced 146 million tons in the same period, making India the top global rice producer. This milestone is significant, as rice is a staple for over half the world’s population, and India’s production growth ensures its pivotal role in global food security.
India’s dominance extends beyond production to trade. The country’s rice exports for 2024/25 are projected to reach a record 24.5 million tons, up significantly from previous years. This surge has driven global rice trade to a new high of 60.6 million tons, an increase of 2.2 million tons from the prior forecast. India’s export growth is fueled by strong demand from Sub-Saharan Africa, where consumption is rising, as noted in the report’s 1.4 million ton increase in global rice consumption to 532.1 million tons. Additionally, global rice ending stocks are up 1.7 million tons to 183.2 million, with increases for India, Indonesia, Thailand, and Vietnam, further stabilizing supply.
Why India Stands Out
India’s agricultural sector benefits from several structural advantages that make it a standout investment destination. First, its massive population of over 1.4 billion creates a robust domestic market, as highlighted in earlier discussions on emerging markets. This internal demand provides a buffer against global trade disruptions, such as the US-China trade conflicts, which has impacted other export-reliant economies. India’s focus on self-sufficiency, exemplified by initiatives like “Make in India,” has further strengthened its agricultural base, reducing dependence on imports.
Secondly, India’s rice sector is supported by favorable government policies. Subsidies for farmers, investments in irrigation, and advancements in agricultural technology have driven productivity gains. India’s production growth is consistent, with nine consecutive years of increases, reflecting the effectiveness of these measures. Additionally, India’s ability to redirect exports to regions like Sub-Saharan Africa and Southeast Asia demonstrates its adaptability in a volatile global market.
Investment Opportunities in Indian Agribusiness
India’s ascent as the global rice leader has created a fertile ground for investment across multiple sectors. Central to this are companies engaged in rice cultivation, milling, and packaging, such as KRBL Limited NSE:KRBL , which exported 1.2 million tons in 2024 and is well-positioned to leverage India’s total rice exports of 24.5 million tons. Enhancing this production is the growing adoption of agricultural technology; platforms like DeHaat, which supports over 1.5 million farmers, reported a 40% revenue surge in 2024, underscoring the sector’s potential. As exports soar, efficient logistics become paramount, with firms like Adani Agri Logistics NSE:ADANIPORTS , possessing a storage capacity of 1.5 million tons, ready to facilitate the movement of rice to global markets. Furthermore, the domestic market’s increasing consumer spending presents opportunities in rice-based consumer goods, exemplified by Britannia Industries’ 8% revenue growth in 2024.
Broader Implications for Asian Agriculture
India’s success in rice production has broader implications for Asian agriculture. The region, home to 60% of the world’s population, is a critical player in global food markets. We can see increases in rice production for Indonesia (up 0.5 million tons) and Cambodia (up 0.3 million tons), alongside higher ending stocks for Thailand (up 0.4 million tons) and Vietnam (up 0.3 million tons). This regional strength suggests, that Asian agriculture is becoming a more resilient investment theme, particularly amid global trade conflicts.
Investors can also look beyond rice to other Asian agricultural sectors. For example, India’s soybean production contributes to global supplies (122.5 million tons ending stocks), offering opportunities in oilseed processing. Similarly, Southeast Asia’s palm oil production, despite a 1.3 million ton decline to 78.2 million tons, remains a pretty important investment area, with companies like Wilmar International poised to benefit from any recovery.
Risks to Consider
While India’s agricultural sector offers significant potential, risks remain. Inflationary pressures, as seen in India’s broader economy, could increase input costs for farmers, that may impact profitability. We also must highlight geopolitical tensions, such as the US-China trade conflicts, which may indirectly affect rice demand if economic growth slows in key markets like Sub-Saharan Africa. Additionally, infrastructure gaps in logistics and storage could hinder export efficiency, though government investments are addressing these challenges.
To sum it all
India’s ascent as the global rice leader, with a record 147 million tons of production and 24.5 million tons in exports, marks a pivotal moment for Asian agriculture. This trend offers a gateway to high-growth opportunities in India’s agribusiness sector, from rice production and agricultural technology to logistics and consumer goods. The broader resilience of Asian agriculture, supported by regional production gains in Indonesia and Cambodia, further enhances the investment case. While risks like inflation and geopolitical tensions persist, India’s structural advantages-domestic demand, policy support, and export growth-make it a compelling destination for long-term investors seeking exposure to the global food market.


S&P 500 Rally Exhausted? Watch This Level for the Next Drop!The S&P 500 Index( SP:SPX ) has finally touched the Resistance zone($5,680-$5,500) as I expected in my previous post .
The S&P 500 Index is moving near the Resistance zone($5,680-$5,500) , the Resistance line, and Yearly Pivot Point .
Also, we can see the Regular Divergence(RD-) between Consecutive Peaks .
In terms of Elliott Wave theory , it seems that the S&P 500 Index is completing the Zigzag Correction(ABC/5-3-5) , and if the uptrend line breaks , we can confirm the end of the Zigzag correction .
When the S&P 500 Index started to rise on April 22 , Bitcoin also started to rise at the same time , so a decline in the S&P 500 Index can cause Bitcoin ( BINANCE:BTCUSDT ) to decline .
I expect the S&P 500 Index to drop to at least $5,313 AFTER breaking the uptrend line .
Note: If the S&P 500 Index touches $5,712, we can expect more pumps.
Please respect each other's ideas and express them politely if you agree or disagree.
S&P 500 Index Analyze (SPX500USD),2-hour time frame.
Be sure to follow the updated ideas.
Do not forget to put a Stop loss for your positions (For every position you want to open).
Please follow your strategy and updates; this is just my Idea, and I will gladly see your ideas in this post.
Please do not forget the ✅' like '✅ button 🙏😊 & Share it with your friends; thanks, and Trade safe.
