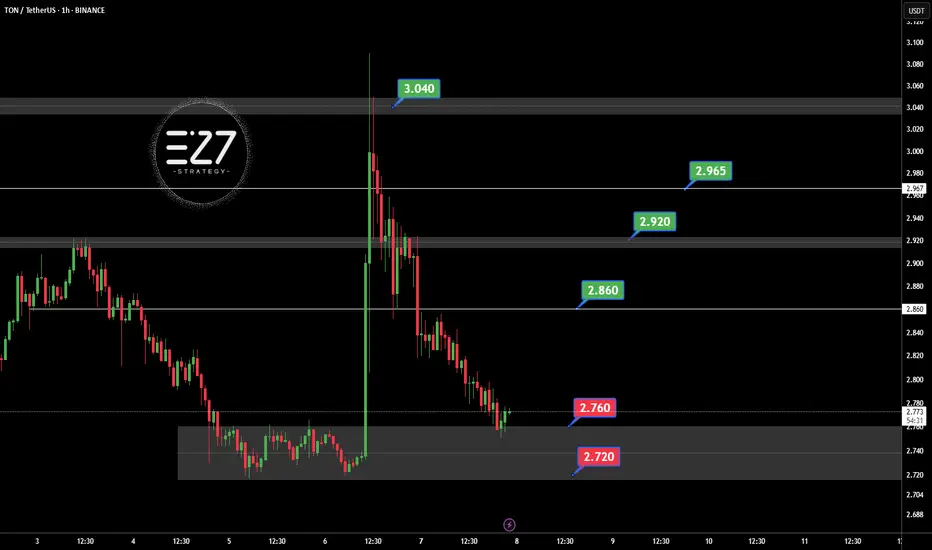
TONUSDT Following the official denial by UAE authorities regarding the possibility of obtaining a golden visa through staking OKX:TONUSDT , the bullish momentum driven by that rumor has faded. Selling pressure has increased, and TON is now consolidating within the key support zone of 2.720 to 2.760 USDT. If this support breaks, further downside is likely. However, if the price holds and reclaims the 2.860 USDT resistance, it could trigger a recovery toward 2.920 and 2.965 USDT. For now, the market sentiment remains bearish with a corrective bias.
Key Points:
UAE officially denied TON-based golden visa claims, weakening sentiment.
Current support zone: 2.720–2.760 USDT.
Key resistance: 2.860 USDT, then 2.920 USDT.
Break below 2.720 = further decline.
Break above 2.860 = potential bullish reversal.
⚠️ Please Control Risk Management in trades.
Pivot Points
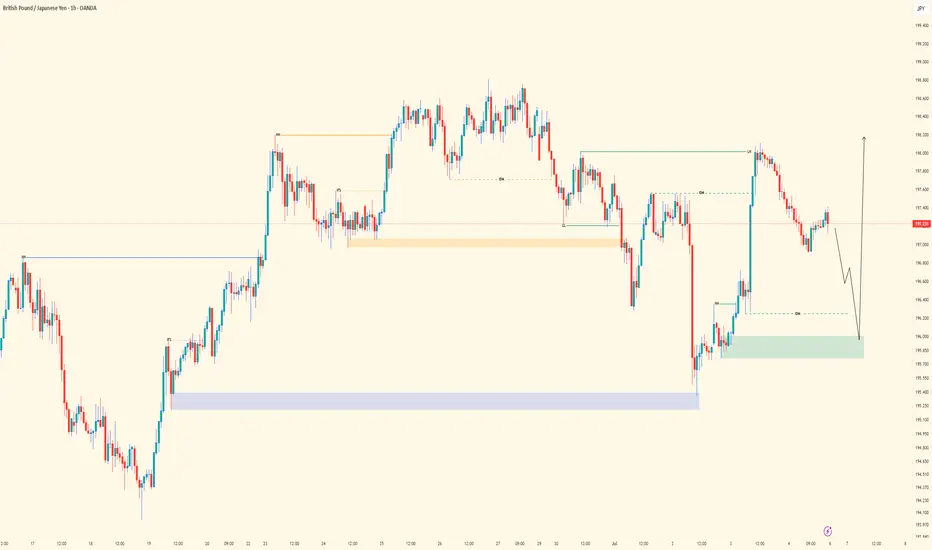
USDJPY Price Accumulated|Time For Bullish Distribution|Setupsfx|The price has accumulated nicely and is now distributing. We have three targets in mind, but set your own based on your analysis. Our approach is purely technical, but also includes a basic fundamental approach. This analysis concludes over 1500 pips and is a swing move. Please use this analysis as educational purposes only, as it does not guarantee that price will move exactly as predicted.
If you like our idea, please consider liking and commenting on it.
Good luck and trade safely!
Team Setupsfx_

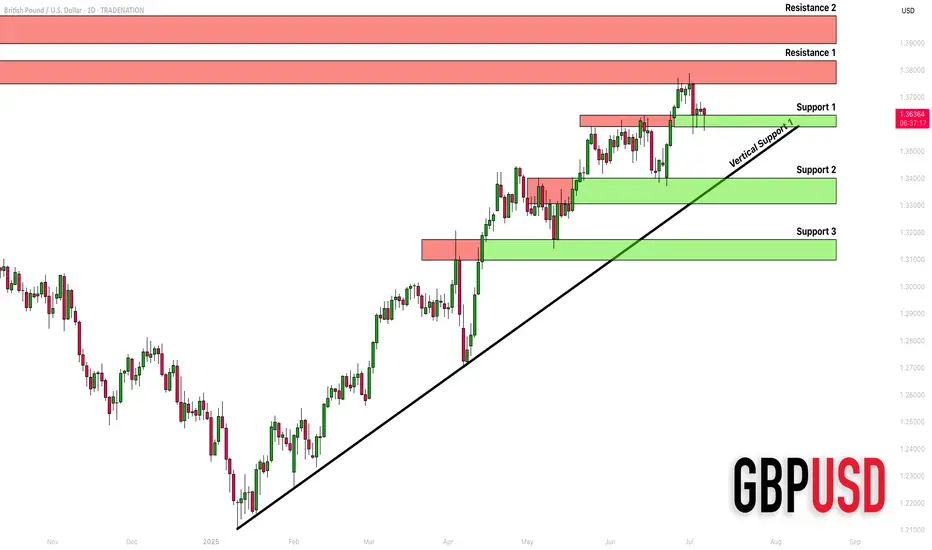
GBPUSD: Detailed Support & Resistance Analysis 🇬🇧🇺🇸
Here is my structure analysis for GBPUSD.
Horizontal Structures
Support 1: 1.3588 - 1.3633 area
Support 2: 1.3305 - 1.3400 area
Support 3: 1.3097 - 1.3175 area
Resistance 1: 1.3748 - 1.3835 area
Resistance 2: 1.3900 - 1.3400 area
Vertical Structures
Vertical Support 1: rising trend line
Consider these structures for pullback/breakout trading.
❤️Please, support my work with like, thank you!❤️
I am part of Trade Nation's Influencer program and receive a monthly fee for using their TradingView charts in my analysis.
BTC — Weekend Pump Fades.. All Eyes on the Gartley Reversal ZoneBitcoin has been consolidating in a tight range between $110K and $105K over the past two weeks. This weekend’s attempted breakout stalled out quickly! BTC was rejected at the Point of Control (POC) of the previous range and came close to the 0.786 retracement of the recent drop.
🧠 Reminder: Weekend pumps are notorious for being unreliable, especially without strong volume.
Now, the charts point toward something much more structured — a potential Gartley harmonic pattern forming, with multiple levels of confluence suggesting the next key decision zone is just around the corner.
🧩 Gartley Completion Zone: $106,290–$106,400
This price zone is loaded with confluence:
✅ 0.786 Fib retracement of the XA leg sits at $106,290
✅ 1.0 trend-based Fib extension of the BC leg is at $106,370
✅ Anchored VWAP from all-time high aligns precisely at $106,370
✅ VAL (Value Area Low) sits at the same level
✅ Imbalance (Fair Value Gap) from earlier price inefficiency lies in this exact region
All of this stacks up into a high-probability reaction zone.
🎓 Educational Insight: How to Trade a Gartley Harmonic
The Gartley pattern is one of the most powerful harmonic setups — a structured form of retracement and extension that captures exhaustion before reversals. Here's how it works:
🔹 XA: Impulse leg
🔹 AB: Retracement of 61.8% of XA
🔹 BC: Retraces 38.2%–88.6% of AB
🔹 CD: Extends to 78.6% retracement of XA and aligns with a 1.0–1.272 Fib extension of BC
🟢 Point D is the entry zone — your reversal opportunity.
📉 Stop-loss sits just below invalidation (Point X).
💰 Targets usually lie at 0.382 and 0.618 of the CD leg.
🔎 Why It Works: It traps late traders and captures price exhaustion at natural Fibonacci ratios. Combined with other tools — like VWAP, liquidity zones, and order flow — it becomes a high-conviction strategy. These patterns are most effective on higher timeframes like 4H or daily.
_________________________________
💬 If you found this helpful, drop a like and comment!
Want breakdowns of other charts? Leave your requests below.

NOV Inc. Stock Quote | Chart & Forecast SummaryKey Indicators On Trade Set Up In General
1. Push Set Up
2. Range Set Up
3. Break & Retest Set Up
Notes On Session
# NOV Inc. Stock Quote
- Double Formation
* (Downtrend Argument)) + Diagonal Shift At 20.00 USD | Completed Survey
* (EMA Settings)) - *100 EMA
- Lower Band Feature | Subdivision 1
- Triple Formation
* (P1)) / (P2)) & (P3)) | Subdivision 2
* (TP1) = a / Long Consecutive Range
* (TP2) = b / Short Consecutive Pullback | Subdivision 3
* Daily Time Frame | Trend Settings Condition
- (Hypothesis On Entry Bias)) | Regular Settings
- Position On A 1.5RR
* Stop Loss At 14.00 USD
* Entry At 13.00 USD
* Take Profit At 11.00 USD
* (Downtrend Argument)) & No Pattern Confirmation
- Continuation Pattern | Not Valid
- Reversal Pattern | Not Valid
* Ongoing Entry & (Neutral Area))
Active Sessions On Relevant Range & Elemented Probabilities;
European-Session(Upwards) - East Coast-Session(Downwards) - Asian-Session(Ranging)
Conclusion | Trade Plan Execution & Risk Management On Demand;
Overall Consensus | Sell

#GBPUSD: A strong bullish move incoming, comment your views The price has shown a possible price divergence, which could lead to a long-term move to 1.37. We expect the US dollar to weaken, which will likely push the price of GBPUSD to our target. Key economic data will be released later today and tomorrow, which could shape the price pattern.
Good luck and trade safely!
Team Setupsfx_

SPX500 Holding Bullish Structure – Eyes on 6287 BreakoutSPX500
The price maintains bullish momentum as long as it remains above 6225 and 6246.
Currently, the market is approaching the 6287 resistance level. A confirmed 4H candle close above 6287 is required to validate continuation of the bullish trend toward 6325.
However, a rejection from 6287 may trigger a short-term bearish correction, with potential pullbacks toward 6246 and 6225.
A sustained break below 6225 would shift the momentum to the downside, targeting the 6143 support level.
Pivot Level: 6264
Resistance: 6287 – 6325
Support: 6246 – 6225 – 6143

GBPCAD FORMING BEARISH FLAG PATTERNGBPCAD Bearish Trend Analysis (1-Hour Time Frame)
The GBPCAD pair is currently exhibiting a bearish trend on the 1-hour chart, with the market forming lower lows, confirming a sustained downward momentum. This price action indicates that sellers are in control, and the bearish sentiment is likely to continue in the upcoming trading sessions.
Bearish Flag Pattern Signals Further Decline
The price is forming a bearish flag pattern, a continuation pattern that often leads to further downside movement. This pattern suggests that after a brief consolidation, the pair may resume its downward trajectory. Traders should watch for a breakdown below the flag’s support, which could accelerate the decline.
Key Support and Resistance Levels
- Downside Targets: If the bearish momentum continues, the pair could test 1.84500, followed by 1.83200. These levels may act as potential take-profit zones for short positions.
- Upside Resistance: On the higher side, 1.87700 remains a critical resistance level. A break above this level could temporarily halt the bearish trend, but as long as the price stays below it, the downtrend remains intact.
Trading Strategy
- Short positions could be considered near resistance levels, with stop-loss orders placed above 1.87700 to manage risk.
- A confirmed breakdown below the bearish flag may present additional selling opportunities.
- Traders should monitor price action around support levels (1.84500 & 1.83200) for potential pullbacks or continuation signals.
Conclusion
With the lower lows formation and the bearish flag pattern, GBPCAD is expected to remain under selling pressure. Traders should watch for breakdowns below key support levels while keeping an eye on resistance at 1.87700 for any trend reversal signals.

TSLA – Calm Before the Storm or Just Another Dip Buy?Tesla (TSLA) is trading around $315, bouncing off recent lows, but this isn’t just a clean technical setup. With Elon Musk’s political drama escalating (hello, “America Party”) and ongoing tension with Trump, TSLA is becoming a battleground stock with serious volatility.
As swing traders, that’s exactly where we thrive.
📍 Entry Plan
✅ Entry #1 – $315
✅ Entry #2 – $300
• Previous breakout zone — ideal for dip buyers
✅ Entry #3 – $265
• Strong macro support; only activated if market correction deepens.
🎯 Profit Targets
• TP1: $335
• TP2: $355
• TP3: 400+ – if sentiment + volume align with narrative momentum (think: Robotaxi or AI catalyst)
If $265 gets hit, I’m not panicking, I’m preparing for high-reward setups.
⚠️ Disclaimer: This is not financial advice. I’m just sharing my plan and technical zones. Always do your own research and manage your risk.
📌 Follow for more ideas based on price, narrative, and timing. Trade smart — not loud. 🧭📈

JUP Main trend. Channel. Wedge. Double bottom. 06 07 2025Logarithm. Time frame 3 days. Decline from the maximum -84% (this is not enough), but given the capitalization of 59th place, if the market is positive in the near future, then it is quite possible to reverse this cryptocurrency through a double bottom.
All long-term consolidation above with high volatility is the distribution of ladies and gentlemen. Also study the vesting of this cryptocurrency. There are less than half of the tokens on the market, and there are also pauses for 1 year, which is good.
Jupiter (JUP) is a key player in the decentralized finance (DeFi) space, especially in the Solana blockchain.
Main trend is downward. Descending channel.
Secondary trend is downward. Descending wedge.
Local trend is sideways. Potential double bottom in case of a breakout.
The price will move in the corridors of this descending channel from the dynamic lines of its support/resistance. Remember this and use it in your trading strategy, observing money management.
Local breakout zone
Understand where the zones are cheap, and where, on the contrary, the zones are expensive. If you work (tear out movements, there should be short-term or conditionally medium-term transactions, with very mundane goals) conditionally in expensive zones, then limit losses. Do not let yourself be fooled by news noise and the opinions of the majority.

BTCUSDT: Trend in 2H time frameThe color levels are very accurate levels of support and resistance in different time frames.
A strong move requires a correction to major support and we have to wait for their reaction in these areas.
So, Please pay special attention to the very accurate trend, colored levels, and you must know that SETUP is very sensitive.
BEST,
MT

DIAUSDT: Trend in daily timeframeThe color levels are very accurate levels of support and resistance in different time frames, and we have to wait for their reaction in these areas.
So, Please pay special attention to the very accurate trend, colored levels, and you must know that SETUP is very sensitive.
Be careful
BEST
MT


Wait for all currencies to fall further and sell your tokens.There is currently no news of growth in Ethereum and altcoins, and every time it goes up, there is an opportunity to exit and it is a trap. Ethereum and altcoins are only for sale. Soon Cardano will be 0.08, Ethereum 600,
Dogecoin 0.003,
Shiba 0.0000001,
and the rest will fall, and they will only release tokens and swallow your dollars in the name of Alt Season.
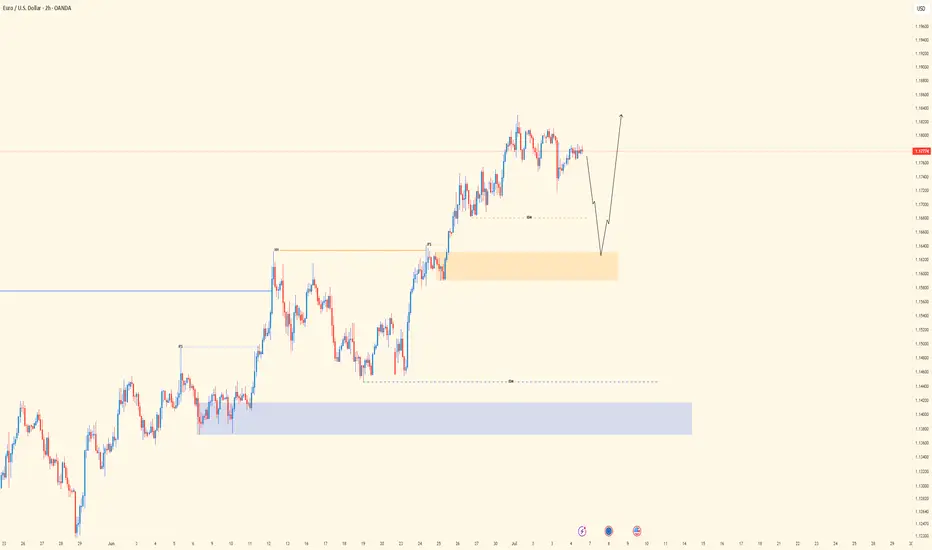
EURUSD: Support & Resistance Analysis For Next Week 🇪🇺🇺🇸
Here is my recent structure analysis and important
supports and resistances for EURUSD for next week.
Consider these structures for pullback/breakout trading.
❤️Please, support my work with like, thank you!❤️
I am part of Trade Nation's Influencer program and receive a monthly fee for using their TradingView charts in my analysis.

GOLD (XAUUSD): Support & Resistance Analysis For Next Week
Here is my latest structure analysis
and important supports and resistances for Gold for next week.
Resistance 1: 3356 - 3368 area
Resistance 2: 3391 - 3403 area
Resistance 3: 3443 - 3452 area
Resistance 4: 3493 - 3501 area
Support 1: 3230 - 3274 area
Support 2: 3120 - 3177 area
Consider these structures for pullback/breakout trading.
❤️Please, support my work with like, thank you!❤️
I am part of Trade Nation's Influencer program and receive a monthly fee for using their TradingView charts in my analysis.

Insiders are selling Roblox ! Heres the levels you need to knowIn this video I lay out a solid plan for a move to the downside for Roblox after a 100% move to the upside since April of this year .
I demonstrate why I believe we will take a 30% retracement and provide confluent evidence to support this theory.
There are some fundamental reasons that I also did include alongside the technical analysis which is not my regular style but important given the context.
Tools used in the video 0.382 Fib , Standard Fib pull, Trend based fib and pivots .

GOLD (XAUUSD) | 4H OB Respected | waiting for 30m LH BreakPair: XAUUSD
Bias: Bullish
Timeframes: 4H, 30M, LTFs
• 4H showing strong bullish structure — OB respected cleanly, confirming higher timeframe demand.
• On 30M, now patiently waiting for the break of LH to confirm continued bullish intent. After that, looking for a sweep off a fresh internal OB for LTF entry confirmation.
🔹 Entry: After LH break + sweep + CHoCH on LTFs
🔹 Entry Zone: Within fresh internal OB post-LH break
🔹 Target: Near structure highs
Mindset: Let the structure speak. No guesswork — wait for your levels, your break, and your confirmation. Precision over prediction.
Bless Trading!

USDJPY| - Bullish Structure Holding | Waiting For Mitigation Pair: USDJPY
Bias: Bullish
Timeframes: 4H, 30M, LTFs
• 4H is showing clean bullish structure — internal high was breached, confirming bullish pressure.
• 30M broke the LH, showing further signs of demand holding.
• Now waiting on price to return and mitigate the OB zone for possible LTF confirmation.
🔹 Entry: Once price hits OB and gives CHoCH/sweep confirmation on LTFs
🔹 Entry Zone: Marked OB on 30M
🔹 Target: Near structure highs (continuation path if demand holds)
Mindset: Ride the wave, not the noise. Let the structure print, and don’t blink when price gives your cue.
Bless Trading!

NASDAQ | - Structure Refined | Bullish Intent Into Next WeekPair: NAS100
Bias: Bullish
Timeframes: 4H, 2H, LTFs
• 4H broke structure to the upside with a new HH — clear sign of bullish intent stepping in.
• 2H gives clarity on the move — beginning of the week was messy, but price cleaned up nicely and gave us refined structure to work with.
• Now we wait for mitigation into the OB zone to see if price respects and gives us the setup.
🔹 Entry: After price mitigates OB and confirms with CHoCH on LTFs
🔹 Entry Zone: Marked OB zone — wait for confirmation
🔹 Target: Near structure highs — continuation if bulls step in
Mindset: Messy beginnings don’t mean bad outcomes. Structure eventually reveals the truth — just stay patient and ready.
Bless Trading!

EU| - Bullish Structure Intact | Watching for SSL Sweep and RunPair: EURUSD
Bias: Bullish
Timeframes: 4H, 2H, LTFs
• 4H structure is clean and bullish — momentum’s been steady, and the market looks ready to ride higher going into next week.
• 2H gives clarity — I’m watching for a sweep of SSL into OB to set the stage for LTF confirmation.
• Entry process remains the same: wait for CHoCH, followed by sweep inside the OB zone.
🔹 Entry: After CHoCH + sweep inside OB (LTF process repeated)
🔹 Entry Zone: After confirmation within OB
🔹 Target: Structure highs — letting price unfold with the trend
Mindset: Patience pays the most. Wait for the market to come to you, not the other way around.
Bless Trading!
GU| - Bullish Ride in Motion | Key Zone Hold into New WeekPair: GBPUSD
Bias: Bullish
Timeframes: 4H, 2H, 30M
• 4H showing strong bullish momentum — price pushed aggressively, and we caught the move. Heading into next week, the bullish continuation is still valid unless price tells us otherwise.
• 30M gave a sweep from a refined OB zone — circled area shows the key move. Watching closely to see if bulls truly hold that ground.
• 2H gives a clear picture of structure — smooth directional flow confirming the bias.
🔹 Entry: After break of micro LH for confirmation
🔹 Entry Zone: Will be found within price flow — post-shift
🔹 Target: Structure highs — same continuation goal if bulls follow through
Mindset: No chasing. We wait, let price do the heavy lifting. Our job is to react with clarity, not emotion.
Bless Trading!

GJ| - Bullish Flow Maintained |Continuation into Next Week Pair: GBPJPY
Bias: Bullish
Timeframes: 4H, 1H, 30M
• 4H structure remains clean and bullish — no break in flow. Price is still respecting HTF order and momentum.
• 30M gave us that deeper SSL sweep, likely grabbing the early buyers and fast hands. But we stayed patient and followed the structure.
• 1H shows my view clearly — bullish pressure confirmed with reaction from OB and shift in momentum.
🔹 Entry: After sweep of SSL into demand (OB)
🔹 Entry Zone: Green zone marked — same level from earlier in the week
🔹 Target: Near structure highs — letting price flow up clean
Mindset: Week played out with precision. All levels still valid going into next week — no need to erase, just observe how price continues to respect our framework.
Bless Trading!