How Do Traders Use the Pivot Points Indicator? How Do Traders Use the Pivot Points Indicator?
Pivot points are a popular technical analysis tool for spotting areas where the price is expected to react, i.e. pause or reverse. Calculated using the previous day’s high, low, and close, they’re projected onto the current session to highlight potential support and resistance levels, especially useful for intraday traders.
Alongside stock charts, pivot point levels can be used in a wide variety of markets, including forex, commodities, and cryptocurrencies*. As a versatile indicator, pivot points also come in many different types. This article breaks down the definition of pivot points, the variations traders use, and how they can fit into a broader trading strategy.
A Deeper Look at Pivot Points
A common question in technical analysis is, “What is a pivot point?” Pivot points trading, or pivot point theory, is a popular technical analysis concept used in a range of financial asset classes, including stocks, currencies, cryptocurrencies*, and commodities. The indicator assists traders in gauging overall market trends and determining possible support and resistance barriers.
How to Read Pivot Points
The pivot point indicator is static—it’s an average of the high, low, and close prices from the previous trading day. It includes three levels: pivot point (P), support (S), and resistance (R). If the price is above the pivot point, it is supposed to target resistance barriers. Conversely, if it’s below the pivot, it could move to support levels. Thus, support and resistance levels serve as targets or stop-loss zones. They remain constant throughout the period, enabling traders to plan ahead.
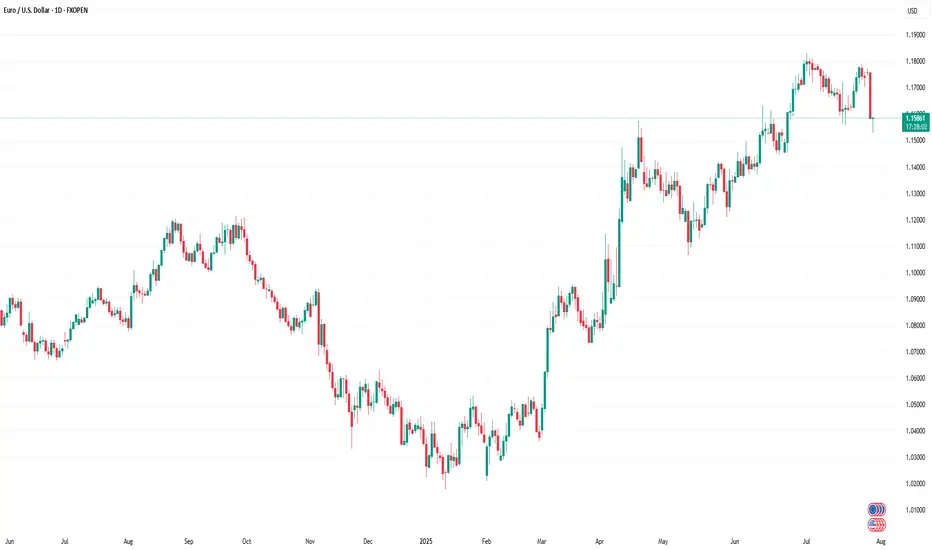
In the EURUSD daily chart below, the price is trading above R2; therefore, market sentiment is assumed to be bullish. R3 indicates the next possible price target. Should a shift below P occur, bearishness arises, and S1 becomes the upcoming support level.
Pivots are widely used with trend indicators such as moving averages and Fibonacci tools. In the chart below, Fibonacci retracements could be used to identify intermediate levels of support and resistance within widely placed pivots.
How to Calculate Pivot Points?
There are four key types of pivots, including standard, Woodie’s, Camarilla, and Fibonacci. While there’s no need to use a pivot points calculator—they’re calculated automatically when implemented on a price chart—it is worth looking at their formulas to understand how they differ from each other.
Note the labels for the following formulas:
P = pivot point
H = high price
L = low price
C = close price
Standard Pivot Points
Traders commonly use standard pivot points. Traditional pivots (P) identify potential levels of support (S) and resistance (R) by averaging the previous trading period's high, low, and close prices.
P = (H + L + C) / 3
S1 = (2 * P) - H
S2 = P - (H - L)
R1 = (2 * P) - L
R2 = P + (H -L)
Although they are popular among traders, they can produce false signals and lead to incorrect trades in ranging markets and during periods of high volatility.
Woodie’s Pivot Points
Woodie's pivots are similar to standard pivots but include a slight modification to the calculation. In Woodie's method, the close price is assigned more weight.
P = (H + L + 2 * C) / 4
R1 = (2 * P) - L
R2 = P + H - L
S1 = (2 * P) - H
S2 = P - H + L
However, their extra sensitivity can make them less reliable during choppy markets or when the price lacks a clear direction.
Camarilla Pivot Points
Camarilla pivots use a set formula to generate eight levels: four support and four resistance. They are based on the previous day’s close and range and multiplied by a certain multiplier. The inner levels (R3 and S3) often act as reversal zones, while R4 and S4 are watched for breakouts. Still, in trending markets, the reversals can fail frequently.
R4 = C + (H - L) x 1.5
R3 = C + (H - L) x 1.25
R2 = C + (H - L) x 1.1666
R1 = C + (H - L) x 1.0833
P = (High + Low + Close) / 3
S1 = C - (H - L) x 1.0833
S2 = C - (H - L) x 1.1666
S3 = C - (H - L) x 1.25
S4 = C - (H - L) x 1.5
Fibonacci Pivot Points
Fibonacci pivot points are based on the Fibonacci sequence, a popular mathematical concept in technical analysis.
They are calculated in the same way as the standard indicator. However, the levels of support and resistance are determined by including the Fibonacci sequence with a close monitoring of the 38.2% and 61.8% retracement levels as the primary price points.
P = (High + Low + Close) / 3
S1 = P - (0.382 * (H - L))
S2 = P - (0.618 * (H - L))
R1 = P + (0.382 * (H - L))
R2 = P + (0.618 * (H - L))
Despite their popularity, Fibonacci pivots can become less reliable when the price reacts to other fundamental drivers.
Trading with the Pivot Points
Although every trader develops their own trading approach, there are common rules of pivot point trading that are expected to improve their effectiveness.
Day Trading
Day trading with pivot points is usually implemented for hourly and shorter intraday timeframes. As pivot levels are updated daily and calculated on the previous day's high, low, and close prices, this allows traders to react promptly to market changes and adjust their strategies. Some traders prefer Camarilla pivots as their calculation takes into account the volatility of the previous trading period to produce pivot levels closer to the current price.
Medium-Term Trading
When looking at a medium-term analysis, weekly pivot levels are added to four-hour and daily charts. These are calculated using the previous week's high, low, and close prices, which remain unchanged until the start of the next week.
Long-Term Trading
For longer-term analysis, traders use monthly pivots on weekly charts. These levels, gathered from the previous month's data, offer a broader picture of market trends and price movements over time.
Pivot Point Trading Strategies
The pivot points indicator is typically used in two ways – breakout and reversal trading.
Breakout Trading Strategy
The breakout approach seeks to take advantage of market momentum by entering trades when prices break above or below significant levels of support and resistance.
- Bullish Breakout. When levels P and R1 are broken, and the price closes above either, it’s more likely a rise will occur.
- Bearish Breakout. When levels P and S1 are broken, and the price closes below either, it’s more likely the price fall will occur.
Strong momentum and high volume are two critical factors needed for a solid price movement in both cases.
Trading Conditions
If a breakout is confirmed, traders enter a trade in the breakout direction. A take-profit target might be placed at the next pivot level. A stop-loss level can be placed beyond the previous level or calculated according to a risk/reward ratio. Traders continuously monitor their trades and adjust their stop-loss levels to lock in potential returns if prices move in their favour.
Reversal Trading Strategy
The reversal strategy seeks to take advantage of a slowdown in market momentum by entering trades when prices stall at significant levels of support or resistance.
- Bullish Reversal. When levels S1 and S2 are not broken and the price stalls above either, a reversal is more likely to occur.
- Bearish Reversal. When levels R1 and R2 are not broken and the price stalls below either, a reversal is expected to happen.
Note: Reversals are always confirmed by another indicator or a chart pattern.
Trading Conditions
If a reversal is confirmed, traders consider entering a trade in its direction. The next level may be a take-profit target, which might be trailed to the next level if the market conditions signal a continuation of a price move. A stop-loss level is typically placed below a swing low or above a swing high, depending on the trade direction.
Pivot Points and Other Indicators
While pivots show where the price may reverse, there’s nothing to say a market won’t trade through these areas. Therefore, traders typically pair them with other technical indicators and patterns.
Candlestick and Chart Patterns
Traders often combine levels with specific reversal candlestick formations, like three black crows/three white soldiers or engulfing patterns, to confirm a change in market movements. For example, a bullish engulfing candle forming at S1 could reinforce the idea of a reversal at that level.
Moving Averages
When a pivot aligns with a major moving average, e.g. the 50-period or 200-period EMA, it strengthens the area. As moving averages act as dynamic support and resistance levels, an overlap can signal a strong area where a reversal might occur.
RSI and Stochastic Oscillator
Momentum indicators like RSI or Stochastic help judge whether the price is likely to bounce or break through a pivot. If it hits support and RSI is oversold, that adds conviction. But if momentum is still strong in one direction, it might get ignored.
Considerations
Even with strong confluence, these combinations can fail. Markets don’t always respect technical alignment, especially around data releases or sharp movements in sentiment. For instance, in stocks, pivot points may be ignored if an earnings release strongly beats analyst estimates. Instead, they are believed to work when treated as one piece of a broader technical framework.
Limitations
Pivot points are widely used, but like any tool, they have flaws. They’re based purely on past price data, so they don’t account for news, sentiment shifts, or broader market context.
- False signals in ranging markets: The price often oscillates around pivot zones in markets without a clear direction, meaning setups might not follow through.
- Less reliable during strong trends: In trending conditions, the price can blow past several levels without reacting.
- No built-in volatility filter: The points don’t adapt to changing volatility, so levels might be too close or too far apart to be useful.
- Lag in real-time shifts: Since pivots are pre-calculated, they don’t adjust mid-session as new data emerges.
Final Thoughts
Pivot points are widely used in stock trading as well as in commodity, cryptocurrency*, and currency markets. While they can be useful tools, their limitations cannot be overlooked. It is essential to conduct a comprehensive analysis and confirm the indicator signals with fundamental and technical analysis tools.
FAQ
What Is a Pivot Point in Trading?
The pivot point meaning refers to a technical analysis tool used to identify potential support and resistance levels. It’s calculated using the previous day’s high, low, and close prices, and helps traders find areas where the price may react during the current session.
What Is the Best Indicator for Pivot Points?
There isn’t one best indicator, but traders often pair pivot points with moving averages, RSI, or candlestick patterns to confirm a potential reversal. The most effective setup usually depends on the strategy and market conditions.
What Are the Pivot Points’ R1, R2, and R3?
R1, R2, and R3 are resistance levels above the central point. They represent increasingly stronger potential resistance zones where the price may stall or reverse.
Which Is Better, Fibonacci or Camarilla?
Fibonacci offers wider levels based on retracement ratios, useful in trending markets. Camarilla focuses on tighter reversal zones, which are mostly used for intraday strategies. Each suits different trading styles; neither is objectively better.
*Important: At FXOpen UK, Cryptocurrency trading via CFDs is only available to our Professional clients. They are not available for trading by Retail clients. To find out more information about how this may affect you, please get in touch with our team.
This article represents the opinion of the Companies operating under the FXOpen brand only. It is not to be construed as an offer, solicitation, or recommendation with respect to products and services provided by the Companies operating under the FXOpen brand, nor is it to be considered financial advice.
Pivotpointtrading
NFP Bears gathering their troops? or will the Bulls stampede...The past 9 days have been quite interesting for the EUR/USD which has been relentless. Price has been rising like a helium balloon let loose at the park...
Bulls have clearly been in control, not only the past 9 days but since the beginning of the year with the exception of the strong pullback in April & May only to bounce for another 700 pip run.
I am totally USD bearish across the board as I have been mentioning in my analysis videos for the past few months but like all macro moves, we always have pullbacks along the way and that is why I have been shorting the EUR/USD back from 1.1500+ - 1.1700+
I've given this a lot of room to breathe, more than usual but considering the following technical setup, I'm willing to give the Bears some leeway and potentially show me they'll come through.
•Rising Broadening pattern (Where two trendlines start close together only to divergence and expand) - This is a bearish pattern.
•Negative Divergence on the MACD, Linear Regression & the RSI.
•Price has made a run to the yearly R3 pivot level. (Rare extension)
•Last daily candle is a hanging man candlestick (Reversal candle)
•Weekly chart has the EUR/USD at the upper band of a polynomial regression channel which calculates for price extremities in the market.
There are a few more setups as well but it's too much to describe here and I'd have to show it in a video (Which I plan to do over the weekend)
With all of that said... It could all fail lol but seriously speaking... You just can't ask for a better probabilistic setup so whatever happens during NFP... happens.
Aside from the technical aspect... I know yearly R2 around 1.1600 was a hotspot for shorts because divergence was at the early stages and taking a short there wouldn't have been a bad idea but we know institutions are in play as well, so above 1.1600 could have been a huge area to run stop losses and margin calls before a potential reversal.
250 pips would be enough to run a large pool of stops and liquidation.
IF price is going to reverse here during NFP, I believe late longs and breakout/pullback traders are going to try and buy at the trendline at 1.1660ish but it wont hold and trap them on the other side of the trade.
Under that, I can see us pulling back towards 1.1200ish...
If the Bears give up and price continues to climb... the original macro target may very well be under way which was 1.2000 - 1.2200 (Based on a Monthly and 3-Month chart analysis)
As of this writing the EUR/USD is pretty much completely flat which is expected before the NFP fireworks ahead of July 4th.
We'll see what happens tomorrow morning! buckle up!
As always, Good luck and Trade Safe! See you post NFP.

GBPUSD Weekly overviewRegarding our observations, currently there are almost same number of buyers and sellers in the market
These are best levels regarding Support and resistance, Channels, Weekly pivots, Buyers and Sellers focus and order_block.
Regarding our timeframe, levels are so tight so just shorter term traders like intraday traders and scalpers could make profit on this market!
We will not enter medium risk and high risk trades between 1.2850 and 1.2550
