PLATINUM | XPTUSD Weekly Outlook Oct. 21st: BULLISH Bias!This weekly forecast is for Oct 21 - 25th.
Platinum is heading towards the Swing High with good momentum.
Target should be achieved this week.
Enjoy!
May profits be upon you.
Leave any questions or comments in the comment section.
I appreciate any feedback from my viewers, and I respond to every comment.
Like and/or subscribe if you like the video and want to receive updates directly.
Thank you so much!
Disclaimer:
I do not provide personal investment advice and I am not a qualified licensed investment advisor.
All information found here, including any ideas, opinions, views, predictions, forecasts, commentaries, suggestions, expressed or implied herein, are for informational, entertainment or educational purposes only and should not be construed as personal investment advice. While the information provided is believed to be accurate, it may include errors or inaccuracies.
I will not and cannot be held liable for any actions you take as a result of anything you read here.
Conduct your own due diligence, or consult a licensed financial advisor or broker before making any and all investment decisions. Any investments, trades, speculations, or decisions made on the basis of any information found on this channel, expressed or implied herein, are committed at your own risk, financial or otherwise.
PL1!

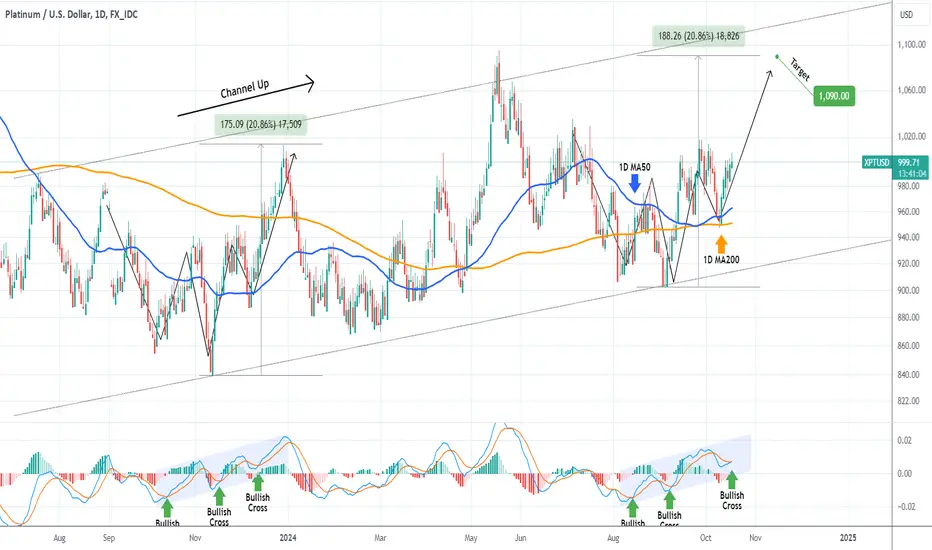
PLATINUM Strong rebound on the 1D MA200.We got a perfect bottom buy entry on Platinum (XPTUSD) last time we analyzed it (August 30, see chart below), with the price already halfway to our 1090 Target:
As you can see, the price action is almost a perfect mirror image of September - December 2023. Now that the price has confirmed the new Bullish Leg with a strong rebound on the 1D MA50 - 1D MA200 zone (blue and orange trend-lines respectively), we can expect it to complete the pattern and complete a +20.86% rise, right where our 1090 Target is.
-------------------------------------------------------------------------------
** Please LIKE 👍, FOLLOW ✅, SHARE 🙌 and COMMENT ✍ if you enjoy this idea! Also share your ideas and charts in the comments section below! This is best way to keep it relevant, support us, keep the content here free and allow the idea to reach as many people as possible. **
-------------------------------------------------------------------------------
💸💸💸💸💸💸
👇 👇 👇 👇 👇 👇
PLATINUM Strong buy opportunity at the bottom of the Channel Up.Platinum (XPTUSD) has been trading within a 1-year Channel Up pattern and on August 05 it priced the latest Higher Low on the pattern's bottom. Having already recovered the 1D MA50 (blue trend-line), we have a confirmed signal of the start of the new Bullish Leg.
The last two major rallies rose by at least +20.86% and as such, our long-term Target is 1090.
-------------------------------------------------------------------------------
** Please LIKE 👍, FOLLOW ✅, SHARE 🙌 and COMMENT ✍ if you enjoy this idea! Also share your ideas and charts in the comments section below! This is best way to keep it relevant, support us, keep the content here free and allow the idea to reach as many people as possible. **
-------------------------------------------------------------------------------
💸💸💸💸💸💸
👇 👇 👇 👇 👇 👇

Gold Ripper Rally Set For 8-16 into 8-20 Targeting $2575-$2650Have you been following my research on GOLD?
This next move will likely be a very strong Ripper-Rally where Gold will break through the dual Flag Apex and move dramatically higher over the next 5-10+ days.
I will let this video tell you all you need to know.
Remember, watch my Gold Dual-Leg Rally video too.
I wonder what the "driver" of this rally in Gold will be?
US-Dollar?
Foreign Markets?
Some political or geo-political news?
Something will send Gold upward $75-$100+ over the next 5+ days.
Get some.
#trading #research #investing #tradingalgos #tradingsignals #cycles #fibonacci #elliotwave #modelingsystems #stocks #bitcoin #btcusd #cryptos #spy #es #nq #gold

XPTUSD Strong buy on this 1W MA50 rebound.Our April 24 analysis (see chart below) on Platinum (XPTUSD) saw us struck Gold as we caught the exact Bullish Megaphone bottom which hit our 1060 Target:
The situation isn't all that different now as Platinum got close to those April levels, with last week's Low marginally breaking below the 1W MA50 (blue trend-line), managing however to close the candle above it.
This has been followed with a strong green 1W candle this week, which we expect to be the technical rebound towards at least Resistance 1 if not a new Higher High. Our Target is slightly lower than this at 1095.00.
-------------------------------------------------------------------------------
** Please LIKE 👍, FOLLOW ✅, SHARE 🙌 and COMMENT ✍ if you enjoy this idea! Also share your ideas and charts in the comments section below! This is best way to keep it relevant, support us, keep the content here free and allow the idea to reach as many people as possible. **
-------------------------------------------------------------------------------
💸💸💸💸💸💸
👇 👇 👇 👇 👇 👇

Gold & Silver Build Momentum Into A New Rally PhaseAre you following my videos/research? If not, pay attention.
Gold and Silver will start to build momentum over the next few weeks - eventually moving 5 to 12% higher before mid-September.
This is a huge move for metals and will prompt Gold to attempt a rally toward $2750 while Silver attempts to rally above $32 - possibly targeting $34.
The dynamics of the global markets and the pending US POTUS elections will continue to drive global traders harder into precious metals as a hedge.
Nothing has changed.
The only thing that is new and taking place right now is the pause in metals is nearing an end point - which means we shift into bullish trending again.
Get ready - here we go (BULLISH)

Platinum: Destination Reached Platinum has reached our beige Target Zone between $995.40 and $1026. Within this range, the price should place the high of beige wave (4) and enter a larger sell-off. If, on the other hand, there is a direct break of the resistance at $1105 (28% likely), we will still see the price in the green wave alt.X.

PLATINUM Massive profit last time. What's the next trade?Straight and plain success of our previous Platinum (XPTUSD) signal (April 24, see chart below), where we caught the exact Bullish Megaphone bottom and hit directly our 1060 Target:
The price could now enter a consolidation phase, the last accumulation, similar to November 15 - December 15 2022, when after it touched the 1D MA50 (blue trend-line), it rallied to the bottom of the Resistance Zone.
As a result, we are turning into buyers again, targeting 1100 (just below the Resistance Zone).
-------------------------------------------------------------------------------
** Please LIKE 👍, FOLLOW ✅, SHARE 🙌 and COMMENT ✍ if you enjoy this idea! Also share your ideas and charts in the comments section below! This is best way to keep it relevant, support us, keep the content here free and allow the idea to reach as many people as possible. **
-------------------------------------------------------------------------------
💸💸💸💸💸💸
👇 👇 👇 👇 👇 👇

Platinum: Examining Resistance Retests and Seasonal BehaviorThe recent movement in Platinum futures has seen a notable retest of the upper boundary of the range, coinciding with a resistance zone commonly referred to as "Supply." Our analytical approach begins at this critical juncture, where we factor in various elements, including the seasonal behavior observed in this precious metal over the past decade and a half.
A meticulous examination of historical data reveals a consistent pattern wherein Platinum experiences a significant decline in value from May through July. This seasonal trend, observed over the course of the last 10 to 15 years, underscores the likelihood of a continued downturn in Platinum's value during this period.
In light of this compelling historical precedent, we are inclined to anticipate a continuation of this seasonal pattern in the current market environment. Consequently, our focus is squarely on identifying and capitalizing on potential bearish opportunities. Specifically, we are actively seeking a setup that anticipates a local retest of the aforementioned resistance zone, which could serve as a catalyst for a reversal in price direction.
By aligning our analysis with both technical and seasonal considerations, we aim to position ourselves strategically to navigate the evolving dynamics of the Platinum futures market.

XPTUSD Strong Higher Low buy opportunity. 1D Golden Cross formedPlatinum (XPTUSD) gave us an excellent bottom buy signal last time (March 13, see chart below), as the metal entered a Channel Up pattern following the bottom just below 880.00:
Currently we are on the 2nd Bearish Leg of the Bullish Megaphone pattern that emerged and will complete a Golden Cross on the 1D time-frame today. As per the December 02 2023 Golden Cross, which was formed after a similar rebound, but on a more aggressive Channel Up instead of a Megaphone, we should be expecting another Higher High near the 1.382 Fibonacci extension. Our Target is 1060.
-------------------------------------------------------------------------------
** Please LIKE 👍, FOLLOW ✅, SHARE 🙌 and COMMENT ✍ if you enjoy this idea! Also share your ideas and charts in the comments section below! This is best way to keep it relevant, support us, keep the content here free and allow the idea to reach as many people as possible. **
-------------------------------------------------------------------------------
💸💸💸💸💸💸
👇 👇 👇 👇 👇 👇


XPTUSD About to test the 1D MA200. Strong buy above it.Platinum (XPTUSD) is going quite well since our October 25 buy call (see chart below) as we caught the bottom and the price is now rebounding:
The long term pattern is a Channel Up. At the moment the price is supported by the 1D MA50 (blue trend-line) buy restrained below the 1D MA200 (orange trend-line) where it got rejected on November 28. Even though the bottom of the Channel Up was made and the 1D RSI patterns between the two sequences are similar, we need confirmation for upward extension by a break above the 1D MA200.
If you didn't buy lower, you can wait until that level breaks, and then target the +28.55% range at $1100.
-------------------------------------------------------------------------------
** Please LIKE 👍, FOLLOW ✅, SHARE 🙌 and COMMENT ✍ if you enjoy this idea! Also share your ideas and charts in the comments section below! This is best way to keep it relevant, support us, keep the content here free and allow the idea to reach as many people as possible. **
-------------------------------------------------------------------------------
💸💸💸💸💸💸
👇 👇 👇 👇 👇 👇

Platinum: A few more strokes🖌️The platinum price is currently in the final phase of its blue wave (ii). It has not yet been able to overcome the resistance at $947.10 and has bounced off it. In the further course, however, this should be left behind as we do not expect the end of the movement until the blue Target Zone between $966.60 and $992.20. From here, a descent should then begin and the price should fall to around $750.

XPTUSD bottomed and has almost +30% upside potential.Platinum (XPTUSD) is testing (and so far failing to break) the 1D MA50 (blue trend-line) after a rebound on the bottom (Higher Lows trend-line) of the long-term Channel Up structure. A break above the 1D MA50 but mostly the Lower Highs trend-line, would confirm the bullish bias on such a low price action, with considerable upside potential.
As you can see the current bottom formation is very similar to the one that led to the September 01 2022 Low. The 1D RSI fractals are identical and will be confirmed if it continues on Higher Lows.
As a result we do have a low risk buy signal on the current level but it is not confirmed yet and needs to break above the Lower Highs to do so. Our long-term target is the 1100, which represents a +28.55% rise from the bottom, similar to the November 11 2022 peak.
-------------------------------------------------------------------------------
** Please LIKE 👍, FOLLOW ✅, SHARE 🙌 and COMMENT ✍ if you enjoy this idea! Also share your ideas and charts in the comments section below! This is best way to keep it relevant, support us, keep the content here free and allow the idea to reach as many people as possible. **
-------------------------------------------------------------------------------
💸💸💸💸💸💸
👇 👇 👇 👇 👇 👇

PLATINUM FUTURES, Massive BEARISH TRIANGLE-Formation, BREAKOUT!Hello There!
Welcome to my new analysis about PLATINUM FUTURES on the global timeframe perspective. The precious metals market is moving into a decisive momentum within the recent times as developments within the financial markets point to a continuation of exceptionally high interest rates within vast majorities of economies and a continuation of hawkish interest rate approaches. An market with continued higher interest rates is pointing to an main indication of a more bearish determination for the precious metals market. If there is no change in the hawkish FED policies and a turning point into more dovish policies decreasing interest rates this is likely to setup the continuation of a bearish indication for precious metal derivatives such as PLATINUM FUTURES. This in combination with a strong DXY, U.S. Dollar Currency Index is increasing opportunity costs of holding precious metal derivatives such as PLATINUM FUTURES, especially within the currencies baskets this is likely to decrease long open interst and increase open interest in short positions to hedge against a depreciating fiat currency pointing to a bearish precious metal scenario.
From a technical perspective the signs are definitely worthwhile to consider here as PLATINUM FUTURES form this gigantic descending-channel-formation in which PLATINUM FUTURES already completed several massive bearish waves to the downside increasing bearish pressure and momentum forming several lower lows and pointing to a higher likelihood possibility of a continuation within the descending-channel-formation. Within this channel PLATINUM FUTURES also form the coherent wave-count with the waves A to C being already completed and now within the formation of the wave D PLATINUM FUTURES are forming this gigantic triangle-formation which is likely to complete within the next times. A breakout below the lower boundary of the triangle-formation will setup the origin of a continuation into the bearish direction and a substantial extension of the wave E within the whole wave-count increasing the bearish momentum till the final targets have been reached.
Taking all these factors into the consideration here the final breakout can setup faster than expected and then it will be important on how PLATINUM FUTURES setup the actual bearish momentum to develop within the wave-E of the whole wave-count because when the momentum is that strong reaching out to the initial target-zones marked in blue this can lead to a continuation just below these levels and a invalidation of the descending-channel into the lower directions. If this does not happen and PLATINUM FUTURES show up with the ability to stabilize within the final target-zones from there on the potential for a reversal increases and if this reversal setups, once it has emerged PLATINUM FUTURES also have the potential to show up with a final breakout out of the upper boundary of the descending-channel-formation. Especially with continued hawkish interest rate policy, in combination with the open interest in short-positions increasing exponentially, and the strong DXY putting bearish pressure on commodities as well as precious metals this is pointing to the final bearish acceleration and breakout developments to emerge realizing this whole bearish scenario.
In this manner, thank you everybody for watching the analysis, support from your side is greatly appreciated.
VP

XPTUSD Solid buy entry but not confirmed yet.Platinum (XPTUSD) is trading around the 1D MA50 (blue trend-line) after a rebound on the bottom (Higher Lows trend-line) of a potential long-term Channel Up structure. This is the 2nd time it bounces off the Higher Lows and the 4th within the 7-month Support Zone.
The 1D MACD made a Bullish Cross last week and is on Higher Lows since June 30. The very same Triple Bottom formation on a Higher Lows MACD can be seen on the previous bottom. The Lower Highs trend-line break-out didn't confirm the bullish signal, it had to be a break above the 1D MA200 (orange trend-line) to give the confirmation. As you can see on both fractals the price got rejected on the 1D MA200 (August 11 2022 and July 18 2023) before it bottomed.
As a result we may have a low risk buy signal on the current level but it is not confirmed yet and needs to break above the 1D MA200 to do so. Our long-term target is the Top of the Resistance Zone at 1130.
-------------------------------------------------------------------------------
** Please LIKE 👍, FOLLOW ✅, SHARE 🙌 and COMMENT ✍ if you enjoy this idea! Also share your ideas and charts in the comments section below! **
-------------------------------------------------------------------------------
💸💸💸💸💸💸
👇 👇 👇 👇 👇 👇

PLATINUM: Excellent buy signal at the bottom of a Rectangle.Platinum (XPTUSD) is rebounding after entering the S1 Zone, which is the bottom part of the Rectangle pattern that has been keeping the price action sideways for the past three months. The 1D technical outlook is neutral (RSI = 45.406, MACD = -7.150, ADX = 37.615) as a result, which justifies this ranged price action. The 1D RSI is rising on a HL trendline, thus we use this low price level to go long and target the 1D MA200 and the R1 Zone (TP = 983.00).
## If you like our free content follow our profile to get more daily ideas. ##
## Comments and likes are greatly appreciated. ##

Platinum: How low will you go? 🤔Platinum is on its way downwards to develop wave Y in light green and still has got room to expand. Indeed, there is a 30% chance that the price could even drop into the green zone between $758 and $659, establishing the low of wave Alt.Y in light green instead. Primarily, though, we expect platinum to turn upwards before reaching the green zone.

Platinum Futures ( PL1! ), H4 Potential for Bearish DropTitle: Platinum Futures ( PL1! ), H4 Potential for Bearish Drop
Type: Bearish Drop
Resistance: 1068.8
Pivot: 1022.0
Support: 971.4
Preferred case: Looking at the H4 chart, my overall bias for PL1! is bearish due to the current price being below the Ichimoku cloud , indicating a bearish market.
Expecting price to retest the pivot at 1022.0, where the overlap resistance and 38.2% Fibonacci line is before heading towards the support at 971.4 where the previous swing low is.
Alternative scenario: Price could possibly break the pivot at 1022.0, where the overlap resistance and 38.2% Fibonacci line is before heading towards the resistance at 1068.8, where the recent high is
Fundamentals: There are no major news.

PLATINUMHELLO GUYS THIS MY IDEA 💡ABOUT PL1! is nice to see strong volume area....
Where is lot of contract accumulated..
I thing that the buyers from this area will be defend this LONG position..
and when the price come back to this area, strong buyers will be push up the market again..
UP TREND + Resistance from the past + Strong volume area is my mainly reason for this long trade..
IF you like my work please like and follow thanks

PLATINUM The 1D MA50 is the key. Potential long-term bull.Platinum (XPTUSD) has been trading within a (very) long-term Triangle pattern since the September 24 2020 Low. That was the low that initiated a massive rally to the February 16 2021 High that started the long-term Lower Highs trend-line, which lastly rejected the price November 11 2022.
The 1D MA50 (blue trend-line) is the key here. As long as it holds, there are good chances that Platinum will push for another Lower Highs test and potentially a break-out, targeting the 0.618 Fibonacci level.
If the 1D MA50 breaks, we will pursue the Symmetrical Support Zone as our short-term target and the September 24 2020 low (830.00) as our long-term.
-------------------------------------------------------------------------------
** Please LIKE 👍, SUBSCRIBE ✅, SHARE 🙌 and COMMENT ✍ if you enjoy this idea! Also share your ideas and charts in the comments section below! This is best way to keep it relevant, support me, keep the content here free and allow the idea to reach as many people as possible. **
-------------------------------------------------------------------------------
You may also TELL ME 🙋♀️🙋♂️ in the comments section which symbol you want me to analyze next and on which time-frame. The one with the most posts will be published tomorrow! 👏🎁
-------------------------------------------------------------------------------
💸💸💸💸💸💸
👇 👇 👇 👇 👇 👇

Platinum Futures ( PL1! ), H4 Potential for Bullish MomentumTitle: Platinum Futures ( PL1! ), H4 Potential for Bullish Momentum
Type: Bullish Momentum
Resistance: 1037.8
Pivot: 974.3
Support: 940.9
Preferred case: The current bias for PL1! on the H4 chart is bullish. To add to this bias, the price is currently trading above the Ichimoku cloud and ascending trendline, indicating a bullish market. If the bullish momentum continues, price may head towards the resistance at 1037.8, where the previous high is located.
Alternative scenario: Price may retrace downwards and head towards the 940.9 support level, where the 61.8% Fibonacci line is located.
Fundamentals: There are no major news.

Platinum Futures ( PL1!), H4 Potential for Bearish MomentumType: Bearish Momentum
Resistance: 975.5
Pivot: 940.7
Support: 914.0
Preferred case: On the H4 chart, we have a bearish bias. To add confluence to this, price is crossing the Ichimoku cloud and breaking ascending channel, which indicate a bearish market. The price may drop from the pivot at 940.7, which is in line with the 38.2% fibonacci retracement to the 1st support at 914.0, where the swing low and 61.8% fibonacci retracement are.
Alternative scenario: Price may rise to the 1st resistance at 975.5, where the swing highs are.
Fundamentals: There are no major news.
