EURJPY - Waiting to buy in the dip following the trading planThe buy opportunity in this scenario is risky, because the demand was already tested and it seems uncertain. In the demand I marked 2 potential entries, but the highest one has been already tested. so in this retracing back I don't take it in consideration anymore, but I expect to buy in the dip on the lowest entry point, if it will be possible.
The Trading Plan consider a possible buy trade in the demand, riding a potential new swing, and one or more sell trades in the fresh supply level, expecting that the weaker demand could be taken out.
What do you think about this currency?
Thank you
Girolamo Aloe
Plan

$XAUUSD Trading Plan - MondayGood time of the day Everyone, just rehabilitated from my seasonal illness, and came back to work, sorry for not posting for a while.
Ok at the moment I'm looking for a retest of 1172 area and is going to enter long at 1135 area, if price action confirms with a stop loss below 1120 area.
Daily Resistance area has been broken, however it's not yet confirmed but my trading plan is around this subject.
Colored fibs are the resistance levels of the most recent downswing, and grayed are the opposite - supports of the most recent up swing.
Not trading actual levels - but areas, so there are a bit more lines then usual.
Any questions, critics, etc - will be glad to comment!!!
Sincerely!!!

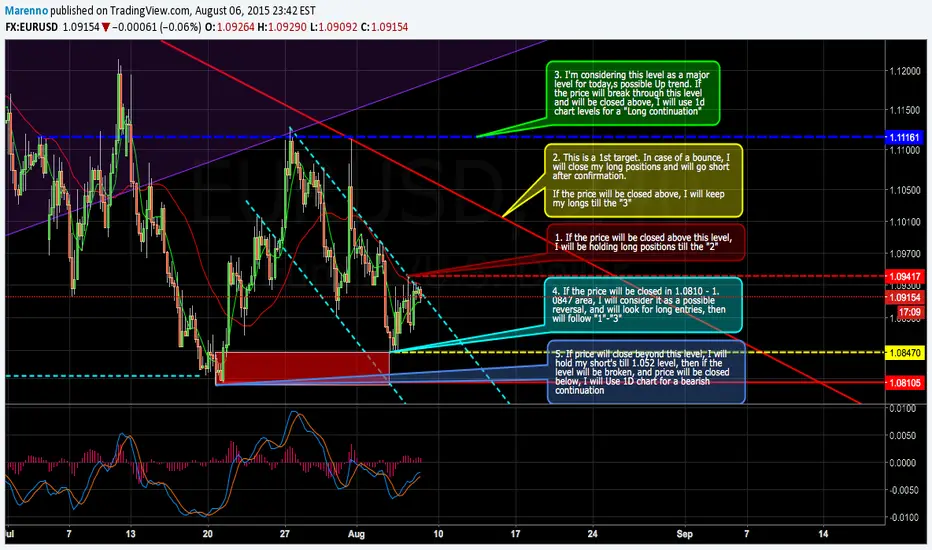
$EURUSD #Trading plan for NFP releaseToday's NFP is something, what most trader's are paying more attention then usual.
It's a very good Idea to have a plan to follow during the news release and after.
I do not recommend to gamble, and to use buy stop and sell stop orders, as mistakes, whipsaws and a guaranteed horrible mood over the weekend is possible.
Please consider it as a rule N1:
DON'T be afraid of loosing trade. Be afraid of loosing your account!!!
I plan to act on a 15 min chart, and will start to watch the situation after 1st 15 min candle/bar is closed.
The situation can be changed a lot, but having a plan, as I've mentioned before is a "must"
Please browse through the chart for more details.
TRADER’S RULES:Let’s glimpse into the basics and do not forget to use these rules.
It’s proved - they do work!
TRADER’S RULES
1. Always work in the direction of the dominant trend
2. Find the strategy where you are most successful, namely the one that gives the minimum account drawdown
3. Reduce the number and size of transactions in case of losses, and vice versa
4. The main rule of profitable trading is control over losses
5. Plan ahead
6. At any time, assume that your plan is not working
7. Everything that happened is history. Focus on the future
8. Success in this business requires incredible concentration and mental costs. Learn to relax
9. Never allow your winning attitude to became unprofitable
10. If you have done something wrong, immediately close the position
11. If you do not see the possibilities – do not trade
12. Do not be a hero. Do not think that you know more than the market. Work with confidence, but always doubt yourself
13. Never overtrade
14. Do not take risks before and immediately after the release of important economic data. This is not the trading but the gambling
15. Avoid emotions
16. Use not just a price stop, but a time stop. If you are waiting for a breakthrough of the market, and it did not happen, close the position, even if it is in profit.

AUD/USD Analysis 30.04.2015Background:
Aud/Usd Remains in a downtrend but we found support @0.75600 ish level and price found balance,
we formed a minor range between 0.7560 support and 0.7914 resistance , where price broke thru resistance
but price traded back into the broken resistance, however its not over for the bulls as the up channel is still intact
and if we find buyers we may head back aboove to retest the current high @0.80600
Signs of Strenght:
price found support
broken resistance
up channel
Signs of Weakness:
Downtrend
broken resistance didnt turned support @ retest
Key Levels above current price:
80750
82500
79800
Key Levels below current price:
78180
77200
75600
sidenote:
A Trading channel is nothing but a diagonal trading range where the upper limits is the oversold level and the lower limits is the oversold level , whereas the mean in this case rising represents fair value. and as it rises so does demand , if price fails to take out the lower limits of the channel and we break the RED trendlines this indicates that demand is in charge and any higher low can be used as an entry signal for a long position


A Simple FOREX trading plan: 2 moving averages and the MACD 3 simple rules and you are set. Try to get your entries close to the 20 SMA.
If markets are not moving much try this on other markets, maybe stocks.

SPX levels and plan Recently, i posted chart where I mentioned that i am not going to be too bearish untill break down og this intermidiate trend line. You need to be prepared for different scenarios with stocks that are on your long/short watch list. When this scenario came into play, plenty of short opportunities emerged (check some of them in the link below). I still don't think that this 2 days selloff is the end of the world. If bears want to keep control, they should defend $1,937 (important), then we have resistance zone a t$1,949-56.
I will be watching for tactical pullback, as it feels a bit oversold here, trading with stock that show us relative strength. Then short opportunities ("h"-pattern) on pullbacks from resistance zone and moving averages.

AAPL in front of earningsRecent news:
* Deal with IBM
* Split 1:7
* Presentation of new iOS 8
* Acquisition of Beats for $2.6 bln + 400 millions of shares
Tendencies and perspectives:
* Smartphones with big screen threaten sales of iPad
* market share of tablets reduced according to research
* Smart home, Apple Smart-TV, Touch ID, iWatch - these are innovations that investors expect from Apple
* iPhone 6 with sapphire glasse?
* Rumors: Apple can acquire Tesla
What to expect:
* EPS expectations $1.23 vs $1.07 yoy
* iPhones + iPads = 3/4 of profit
* Analysts upgrades (Barclays, UBS, JMP: $110, $115, $135 respectively)
* Comments of upper management and Tim Cook on Conference Call about new products coul be catalyst
* I think, numbers will meet expectations
How to trade:
* Hold Call options in front of earnings. I like this idea because it has well defined risk-premium and you wont be caught with gap down.
* Long above $97 resistance
* Long if drop down to support $89.65-$90.00
* Gap up and cover (Buy on rumors, sell on news)
* Open below $92.50-$93.00 - short to bigger support

QQQ showing relative strengthIt started 2014 year as laggard and was trending lower in bear channel. But then it bounced off of 200 EMA with RedDogReversal, regrouped and have built higher highs. Finally, sentiment changed when it resolved this indecision area with break up of resistance at $88.60 with nice 4 days follow through. Traders should adapt and make adjustments if they want to survive and be profitable. Then, it built nice upper-level base and borke up again. After 3 weeks of consolidation it broke up to new highs.
$MSFT put another record high, 8/21/50 EMA control price. Stocks like $TSLA, $INTC, $FB, $NFLX and even $TWTR looks well and hold above 8 EMA, but no calculated setups here.
$AAPL broke up its descending channle as this stock was not interesting for traders last 2 weeks. Lets see if it can build above $91.35. High at $95.05 could be intermidiate target.
My previous ideas on some of those stocks and evolution of thoughts:
MSFT
MSFT
INTC
INTC
Facebook

SPY reversal off highs, scenarios and game planUS indexes were up in early trading after New Home Sales data came out much better than expected. Consumer Confidence Index beats expectations as well. But later markets reversed, engulfed those gains and closed near lows. Lets see clues and points of adjustments (15 min timeframe analysis). After price reached resistance zone $195.50-.60 reversal candle appeared that usually leads to correction. Then buyers failed to hold 8/21 EMA - sentiment is changing. Finally, when sellers managed to erase all intraday gains and broke down 3-days support - strong signal that sellers are in control.
Many traders waited for such type of sell off that suddenly took place. Today, in media we will see many articles with fears across the board. They will be screaming that price found its top and now it is going to pullback 10% off the highs. But let be objective. Price just closed below 8 EMA. And before this boom scenario will come into play price should go through 21/50/100/200 EMAs. I think that we will see new highs this year, but question is what will happen first - pull back lets say to 50 EMA or new recor high. This red reversal candle is definitely something to take notice for short term active traders who open their positions intraday or for few days. We can expect 2-3 days of continuation down move and then will measure.
I mapped out levels of support and resistance where to make adjustments/take decisions. If sellers want to be in control they don't want to give back $195.27 8 EMA, then we have high at $196.50. And break below intraday low $194.48 could lead to $193.95 21 EMA. Then we have potential support - swing low from 12 of June at $193.11.
Intermidiate target could be $191.28 50 EMA.
I have three scenarios ni my had to game plan today's action.
#1: Price will bounce off of yesterday's low. High probability strategy will be buying leaders that show relative strength: $MSFT, $INTC, $NFLX, $FB, $YELP, $JPM, $WFC, $TSLA, $DDD, $FSLR are some of them.
#2: otherwise, if SPY will go through low then I will consider short stocks that show relative weakness: $BA, $GE, $AAPL, $IBM, $C.
#3: market opens higher then will sell off.
