BTC Possible Bottom November 8th The date isn't meant to be precise, but rather a range of several weeks before and after when the bottom could fall. All cycles on this planet have been governed by very technical planetary data since the dawn of time.
We shouldn't assume the bottom is in until after November, but it's also risky to presume it isn't in until then. Make sure you trade safe!
Planets

BTC Cycles and Important date with price areas 2013-2021 to 2023As we peaked in 2021 October 25/November we see the top area from 2013 Cycle top. Looking from this if whole global economy collapses to another support area BTC has a possibility of going to accumulation area from November 21-28 till February 20 2023 in the Price range of 6900-8k with a Possible top in 2025 at 30-40k zone.

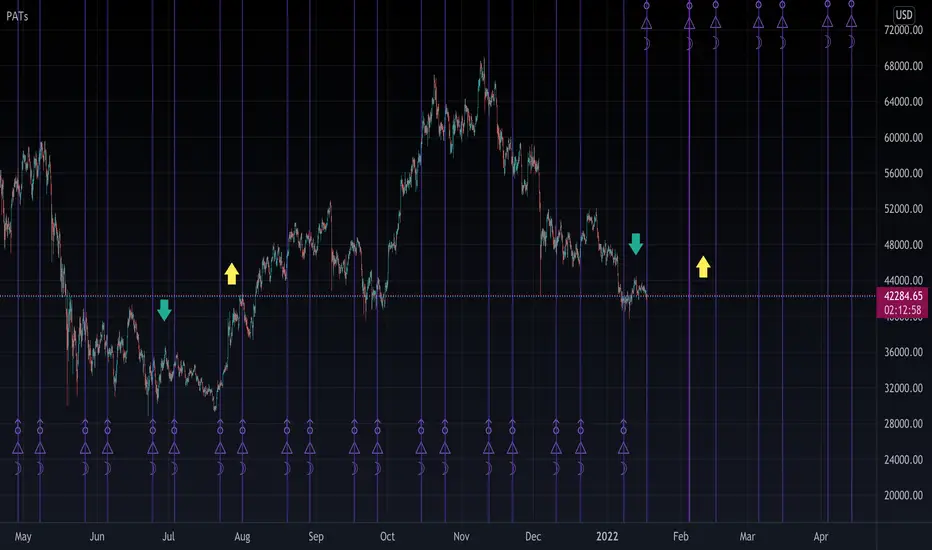
Local Tops and Bottoms BTC (future+historical)The Teal lines mark local times (future and historically) and the pink lines mark local bottoms.

Gann Dates EthereumMAY/6 : one eight of the year
JUNE/20 : two eights of the year
AUGUST/05 : three eights of the year
SEPTEMBER/19 : four eights of the year
NOVEMBER/03 : five eights of the year
DECEMBER/18 : six eights of the year
FEBRUARY/01 : seven eights of the year
MARCH/21 : one full year cycle

Mars Bitcoin Transits Zodiac (Extended) Rainbow Chart𓃭 ♥ 𓆃
The esotericism of lesser known is the ancient body of esoteric sciences. Such sciences include numerology (the universal language of numbers), astronomical cycles, astrological interpretations, time cycles, Biblical symbology, and sacred geometry. These sciences contain the keys to accurate market timing. For example, reading the Bible three times to learn about cycles and how the Creator reveals nature’s universal laws. Obviously, such a study requires years to master and cannot be picked up by the dabbler.
Observe Pisces 1 2 1 2 1 2 pattern for instance.
𓃭 ♥ 𓆃

Mercury Speed And Pattern EthereumAs you can see when Mercury speed accelerates, it has recently lead to longer down trends (when the horizontal lines are closer together).
Now we are at the point where Mercury is slowing (expanding) again - as well as entering its uptrend "pattern". We are still in an overall bearish longer term multitide of cycles until 2024, but I would not be suprised to see the price rise into the first week of May.
From the Lunar eclipse towards the end of May looks sketchy.

Mars Bitcoin Octaves Zodiac Rainbow WheelHarmonic horoscopes are based on principles of resonance, like overtones, which are present in every horoscope. The whole zodiac (360°) is taken as the basic tone, representing the number one (1). By using a higher vibration, we can 'cause' the circle to oscillate more quickly, so to speak, and investigate which planets work together in this particular pattern.
When we divide the octaves of music and color into intervals we find another interesting phenomenon. If we consider the octaves as circles we find that points on the opposite sides of the circles are disharmonic.
Each Zodiac correlates with a musical note.

BITCOIN MARS URANUS TRINE𓆃 I discovered this interesting pattern with the Mars Uranus Trine Heliocentric. Take it as you will. 𓆃
PATS Planetary aspects charting indicator used by creator @NasserHumood

Venus and Mars zodiac crossing ETH - April 2022I have marked with grey lines the heliocentric zodiac crossovers of both Venus and Mars. As you can see, these events always leads to some sort of pivot - be it large or small.

PLANETS - BTC : Bullish long term - Buying OpportunityIf Fibonacci levels are respected and the ascending channel should not be broken ...
Observe All-Time High at ~ .000009 , which corresponds approximately to the key zone of Fibonacci circles level 3.618 (daily)
Maybe a new high at ~ .000023 , which corresponds approximately to the key zone of second Fibonacci circles level (3.618) .
Only the future will tell ....
PlanetWatch : A great project with fundamentals and a good application for the future.
Planets are utility tokens issued on the Algorand blockchain.
DYOR.
PlanetWatch : A great project with fundamentals and a good application for the future.
Planets are utility tokens issued on the Algorand blockchain.
DYOR.

PLANETS long term bullish scenario - Buying opportunityIf Fibonacci levels are respected, and the $0.49 level will be broken ...
The structure takes longer so maybe the pump will also be higher in future. I'm Bullish long term.
Observe All-Time High at ~ $0.49 , which corresponds approximately to the Fibonacci circles level 3.618 (daily)
Maybe a new high at ~ $1.2 , which corresponds approximately to the second Fibonacci circles level 3.618 .
Only the future will tell ....
PlanetWatch : A great project with fundamentals and a good application for the future.
Planets are utility tokens issued on the Algorand blockchain.
DYOR.

60 Degree Planetary Crystallization Rule: When planets form multiple 60-degree angles, a type of geometric crystallization occurs causing a restructuring of the vibrational energy at work in a particular market. The crystallization effect usually occurs at turning points in the markets.
There were many more 60 degree alignments that I did not care to mark on this display.

Lunar Degrees BitcoinI used the "Astro Toolbox" by @NasserHumood to assist me in finding the exact days of these lunar degrees. It is an amazing tool.
Observation: 75° 105° and 165° are effective at predicting turning points in the market.
Hint: these degrees don't only apply to the moon.

Powerful Planet Conjunctions BitcoinScrolling through this chart, one can observe how powerful the 0 degree planetary conjunctions are.
Zooming out - an obvious cycle cluster pattern is revealed and sparks price action become extremely volatile, heated, electric etc...Often in the upward direction as it nears the planetary clusters, with a release and reversal of pendulum hermetic lawful revelation as the cycle nears its cool down.
Inversions are a natural law, which means nothing is to be expected to repeated identically 100% of the time. One can expect inversions to happen using a safe 10% measured estimate.

Bitcoin February Reversal By use of indicators created by @NasserHumood in helping to easily chart the 45° 90° and 120° gap aspects of Mars and Luna.
Not to be taken blindly as trading advice.
Huge crash to come later in the year.
Where will Planets go in 2022? Just speculation on the price of Planets.
Seems like a decent long-term project and I'll be studying what price does over the long run.

Mercury's speed at 0.98 or 1.98 marks trend energy transitionsA Financial Astrology Research member "Ashok" recently suggested that based on George Bayer financial astrologer rules, the points where Mercury's in Geocentric longitude speed is 59 minutes (0.98 in decimal) or 1 degree 58 minutes (1.98 in decimal) seems to indicate major tops or bottoms in market prices. I felt curious about this rule so have extended our Mercury speed indicator to mark those points and plotted vertical lines to clearly validate if the rule has real predictive value. You can see in the chart that locating this points give us an intense planet energy transitions points in BTCUSD. Is really impressive how this speed points narrow down an important trend energy transitions which can be used to locate good trading opportunities.
However, once this rule is confirmed that works the question is: Why this speed values are important for determining the trend energy transitions? I'm researching to figure out why this is important, any hints will be appreciated. Thanks!
Is clear that last BTCUSD trend transition have occurred very close to this points so the expectation is that next major top will be reached at the next speed mark.
DISCLAIMER: This idea don’t provide financial or investment advice and the main purpose is to document the research observations within financial astrology field. Any allocation of funds following the documented machine learning model prediction is a high-risk endeavour and it’s the users responsibility to practice healthy risk management according to your situation.

Mars and MercuryThis chart is made to show how the Indian market reacts to Mars & Mercury + the Gann Seasonal Dates.
Mars is set to display the opposition as well.

NIFTY50 Forecast for June 2021Market repeats and it does it consistently. Lets see how the forecast plays out for June.


GBPUSD 1st June to 2nd June ForecastGBPUSD Intraday 1st June to 2nd June Forecast using proprietary planetary system.


EURUSD - H1 - Planets AnalysisBase on Planets Analysis on EURUSD,it must touch 1.12557 in this week. So if you get a short position in this symbol, you can set your target on 1.12557.
DO NOT FORGET YOUR MONEY MANAGEMENT!!!
Good Luck...
