Is Platinum About to Explode? Imminent Rally!Platinum (PL1!) is currently in a technically and macroeconomically compelling setup. After a prolonged consolidation between 872–921, price has reacted strongly, forming a clear accumulation pattern supported by institutional positioning and favorable seasonality.
📈 1. Technical Analysis: Accumulation and Potential Breakout
The weekly chart shows a strong demand zone that has been defended multiple times over the past year. Following a deep pullback in April, price has formed a harmonic compression structure and broke to the upside with conviction. The area between 1010 and 1040 stands out as the first major historical supply zone — previously rejected but now looking increasingly vulnerable.
📉 2. COT Report: Institutions Repositioning Long
The COT data as of April 22 shows a clear increase in long positions from commercial traders (+1,177 contracts), while non-commercials maintain a net long bias. Total open interest rose by over 1,500 contracts — a strong sign of renewed speculative interest in Platinum.
✅ Conclusion
Platinum is showing strong confluence across technicals, institutional positioning, and historical seasonal behavior. The probability of a bullish extension in Q2 2025 is high. This is a setup worth watching closely in the coming days.
Platinum
XPT/USD "The Platinum" Metals Market Heist Plan (Swing/Day)🌟Hi! Hola! Ola! Bonjour! Hallo! Marhaba!🌟
Dear Money Makers & Robbers, 🤑 💰💸✈️
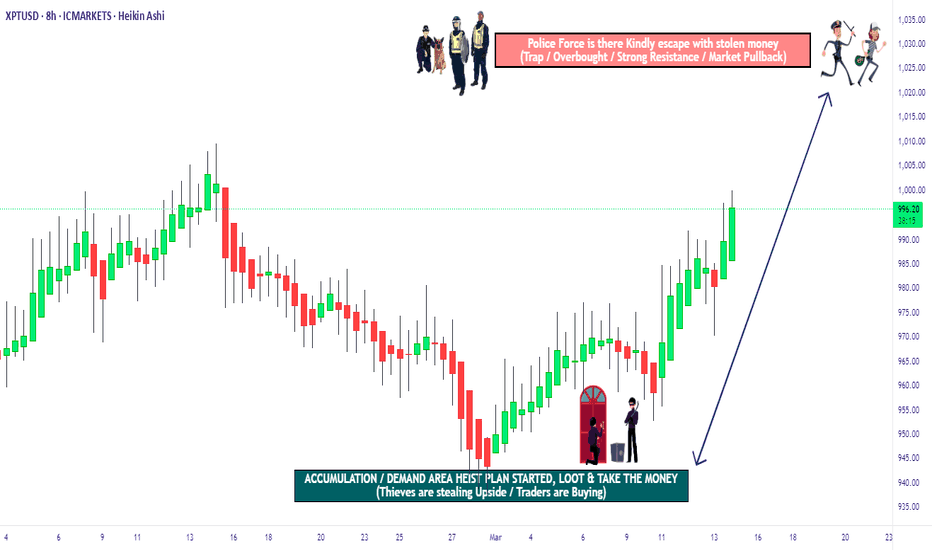
Based on 🔥Thief Trading style technical and fundamental analysis🔥, here is our master plan to heist the XPT/USD "The Platinum" Metals Market. Please adhere to the strategy I've outlined in the chart, which emphasizes long entry. Our aim is to escape near the high-risk ATR Zone. Risky level, overbought market, consolidation, trend reversal, trap at the level where traders and bearish robbers are stronger. 🏆💸"Take profit and treat yourself, traders. You deserve it!💪🏆🎉
Entry 📈 : "The heist is on! Wait for the MA breakout (975.000) then make your move - Bullish profits await!"
however I advise to Place Buy stop orders above the Moving average (or) Place buy limit orders within a 15 or 30 minute timeframe most recent or swing, low or high level for Pullback entries.
📌I strongly advise you to set an "alert (Alarm)" on your chart so you can see when the breakout entry occurs.
Stop Loss 🛑: "🔊 Yo, listen up! 🗣️ If you're lookin' to get in on a buy stop order, don't even think about settin' that stop loss till after the breakout 🚀. You feel me? Now, if you're smart, you'll place that stop loss where I told you to 📍, but if you're a rebel, you can put it wherever you like 🤪 - just don't say I didn't warn you ⚠️. You're playin' with fire 🔥, and it's your risk, not mine 👊."
📍 Thief SL placed at the recent/swing low level Using the 2H timeframe (945.000) Day/Swing trade basis.
📍 SL is based on your risk of the trade, lot size and how many multiple orders you have to take.
🏴☠️Target 🎯: 1004.000 (or) Escape Before the Target
🧲Scalpers, take note 👀 : only scalp on the Long side. If you have a lot of money, you can go straight away; if not, you can join swing traders and carry out the robbery plan. Use trailing SL to safeguard your money 💰.
💰💵💴💸XPT/USD "The Platinum" Metals Market Heist Plan (Day / Swing Trade) is currently experiencing a bullishness🐂.., driven by several key factors.☝☝☝
📰🗞️Get & Read the Fundamental, Macro, COT Report, Quantitative Analysis, Sentimental Outlook, Intermarket Analysis, Future trend targets... go ahead to check 👉👉👉🔗🔗
⚠️Trading Alert : News Releases and Position Management 📰 🗞️ 🚫🚏
As a reminder, news releases can have a significant impact on market prices and volatility. To minimize potential losses and protect your running positions,
we recommend the following:
Avoid taking new trades during news releases
Use trailing stop-loss orders to protect your running positions and lock in profits
💖Supporting our robbery plan 💥Hit the Boost Button💥 will enable us to effortlessly make and steal money 💰💵. Boost the strength of our robbery team. Every day in this market make money with ease by using the Thief Trading Style.🏆💪🤝❤️🎉🚀
I'll see you soon with another heist plan, so stay tuned 🤑🐱👤🤗🤩
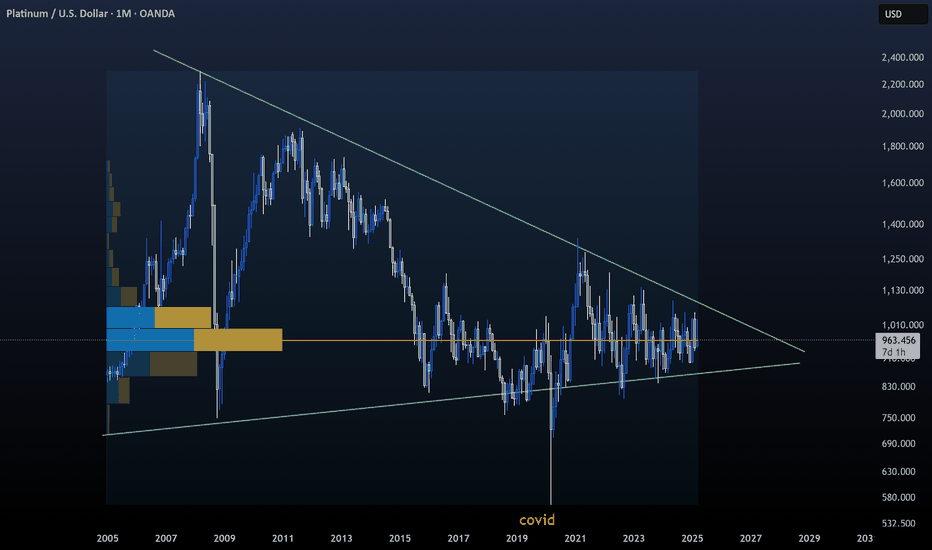
Long Term BUY PlatinumThis is a long-term accumulation and trade for Platinum. In the short term, we can continue to see the range price action.
The previous cycle lasted approximately 3100 days (8.5 years)
I believe we will see a Platinum price of $4000-5000 by 2037.
The next platinum cycle is around the corner. A trendline break will spark the next platinum bull market. For now, I will be accumulating as much platinum as possible. This opportunity can lead to a 4-5x.
If you believe in the fundamentals and idea of this setup, feel free to use and follow it.
Not financial advice.
PLATINUM Strong Triangle buy opportunityLast time we looked at Platinum (XPTUSD) was more than 2 months ago (January 30, see chart below) getting our expected rise and hitting the 999.50 Target:
This time the price is at the bottom (Support Zone) of the 11-month Descending Triangle pattern, which is a technical buy opportunity. The last Bullish Leg hit the 0.618 Fibonacci retracement level, while the one before the 0.786.
As a result we have a minimum 985.00 Target on this emerging Bullish Leg.
-------------------------------------------------------------------------------
** Please LIKE 👍, FOLLOW ✅, SHARE 🙌 and COMMENT ✍ if you enjoy this idea! Also share your ideas and charts in the comments section below! This is best way to keep it relevant, support us, keep the content here free and allow the idea to reach as many people as possible. **
-------------------------------------------------------------------------------
💸💸💸💸💸💸
👇 👇 👇 👇 👇 👇
Platinum Portfolios: A Bullish Signal for Future Gains!Yesterday, as markets slept, a shadow flickered across Platinum’s charts. Portfolios materialized like cryptic clues—hours before prices erupted in a 3% vertical rally. But here’s the twist: the official CME report won’t land until tomorrow. By the time most traders react, the first wave will already be history.
The Setup: Why This Move Matters
1️⃣ "The Insiders Always Whisper First"
Last times, a similar pattern in Platinum’s options market foreshadowed a 150$ surge. History doesn’t repeat, but it rhymes.
These portfolios? They’re not random. They’re telegraphs from players who trade with one eye on the horizon.
The Bottom Line
This isn’t just about Platinum. It’s about trade pattern recognition. The market rewards those who connect dots before they’re obvious.
So, ask yourself:
Are you watching the right data?
Will you be ready when the next domino falls?
Stay sharp. Stay curious. And never underestimate the whispers. 🧠💥
Bullish winds are blowing. Will you sail with them? 🌪️🚀
Do your own research or follow along with us! Two minds are preferable to one!
Mid-Week Analysis March 27-28: USD FX Majors Stock Indices, ...In this video, we look back on the forecasts from this past weekend, and check how they are playing out to this point in the week.
USD Index, S&P500, Nasdaq ,Dow Jones, Gold, Silver, Platinum, Copper, EUR, GBP, AUD, NZD, CAD, CHF, JPY.
Enjoy!
May profits be upon you.
Leave any questions or comments in the comment section.
I appreciate any feedback from my viewers!
Like and/or subscribe if you want more accurate analysis.
Thank you so much!
Disclaimer:
I do not provide personal investment advice and I am not a qualified licensed investment advisor.
All information found here, including any ideas, opinions, views, predictions, forecasts, commentaries, suggestions, expressed or implied herein, are for informational, entertainment or educational purposes only and should not be construed as personal investment advice. While the information provided is believed to be accurate, it may include errors or inaccuracies.
I will not and cannot be held liable for any actions you take as a result of anything you read here.
Conduct your own due diligence, or consult a licensed financial advisor or broker before making any and all investment decisions. Any investments, trades, speculations, or decisions made on the basis of any information found on this channel, expressed or implied herein, are committed at your own risk, financial or otherwise.
Platinum- While everyone is chasing Gold’s rally, I’ve got my eyes on Platinum.
- That doesn’t mean Gold is a bad investment, it just means it’s already had its moment.
- Platinum feels “delayed,” but its time is coming.
- Observe closely, this simple graph reveals a tightening triangle.
Remember my first rule: Buy the blood, not the moon.
Stay sharp. Diversify. Never go all in.
Happy Tr4Ding
XPT/USD "The Platinum" Metals Market Heist Plan🌟Hi! Hola! Ola! Bonjour! Hallo! Marhaba!🌟
Dear Money Makers & Robbers, 🤑 💰💸✈️
Based on 🔥Thief Trading style technical and fundamental analysis🔥, here is our master plan to heist the XPT/USD "The Platinum" Metals market. Please adhere to the strategy I've outlined in the chart, which emphasizes long entry. Our aim is the high-risk Red Zone. Risky level, overbought market, consolidation, trend reversal, trap at the level where traders and bearish robbers are stronger. 🏆💸Book Profits Be wealthy and safe trade.💪🏆🎉
Entry 📈 : "The vault is wide open! Swipe the Bullish loot at any price - the heist is on!
however I advise to Place buy limit orders within a 15 or 30 minute timeframe most recent or swing, low or high level. I Highly recommended you to put alert in your chart.
Stop Loss 🛑:
Thief SL placed at the recent / nearest low level Using the 4H timeframe (970.00) swing trade basis.
SL is based on your risk of the trade, lot size and how many multiple orders you have to take.
Target 🎯: 1025.00 (or) Escape Before the Target
🧲Scalpers, take note 👀 : only scalp on the Long side. If you have a lot of money, you can go straight away; if not, you can join swing traders and carry out the robbery plan. Use trailing SL to safeguard your money 💰.
XPT/USD "The Platinum" Metals Market is currently experiencing a bullish trend,., driven by several key factors.
📰🗞️Read the Fundamental, Macro Economics, COT Report, Seasonal Factors, Intermarket Analysis, Sentimental Outlook, Future trend predict.
Before start the heist plan read it.👉👉👉
📌Keep in mind that these factors can change rapidly, and it's essential to stay up-to-date with market developments and adjust your analysis accordingly.
⚠️Trading Alert : News Releases and Position Management 📰 🗞️ 🚫🚏
As a reminder, news releases can have a significant impact on market prices and volatility. To minimize potential losses and protect your running positions,
we recommend the following:
Avoid taking new trades during news releases
Use trailing stop-loss orders to protect your running positions and lock in profits
💖Supporting our robbery plan 💥Hit the Boost Button💥 will enable us to effortlessly make and steal money 💰💵. Boost the strength of our robbery team. Every day in this market make money with ease by using the Thief Trading Style.🏆💪🤝❤️🎉🚀
I'll see you soon with another heist plan, so stay tuned 🤑🐱👤🤗🤩
PLATINUM IS COMPLETELY UNDERVALUED, BUY NOW!TVC:PLATINUM CAPITALCOM:PLATINUM
Platinum is absolutely undervalued and is currently trading at only $975 USD.
The Gold to Platinum Ratio just hit a new all time high with the Current Ratio being 3,09 even though Platinum has traded since the 1970s till 2016 at a consistent average of 1:1. Gold's all time low against Platinum was at 0,42 in June 2008; AKA the 'Great Financial Crisis'.
Every single indicator shows that right now is the perfect time to buy Platinum especially because the 'Gold rush' is in its absolute final stages.
Keep in mind that Platinum is around 15 times rarer than Gold on Planet Earth.
May fortune favor the bold, and as always - DYOR NFA ! ;)
CYANE
Platinum at Key Support Zone – Will Buyers Step In?OANDA:XPTUSD is approaching a significant support zone, marked by prior price reactions and strong buying interest. This area has previously acted as a key demand zone, increasing the likelihood of a bullish bounce if buyers step in.
If the price confirms support within this zone through bullish price action—such as long lower wicks or bullish engulfing candles—we could see a reversal toward 978.700, a logical target based on previous market structure and price behavior.
However, if the price breaks below this support zone and sustains, the bullish outlook would be invalidated, potentially leading to further downside.
Just my take on support and resistance zones—not financial advice. Always confirm your setups and trade with solid risk management.
Best of luck!
Platinum Prices Poised for Decline as Seasonality & Supply ZonePlatinum prices are currently approaching a key Supply zone as the Futures contract PL1! retraces following an initial bearish impulse. This price action suggests that the market may be poised for further downside movement.
Analyzing seasonal trends reveals a potential for bearish behavior, consistent with patterns observed over the past decade. Historically, this time of year has often been associated with a decline in platinum prices, making the current setup particularly noteworthy.
With these indicators in mind, we are actively monitoring the market for short setups. The convergence of the price approaching the Supply zone and historical seasonality trends reinforces the possibility of a downward move in platinum. As the market unfolds, we aim to position ourselves accordingly to take advantage of any shorting opportunities.
✅ Please share your thoughts about Platinum in the comments section below and HIT LIKE if you appreciate my analysis. Don't forget to FOLLOW ME; you will help us a lot with this small contribution.
PLATINUM - Sell Setup at Key Resistance ZoneOANDA:XPTUSD is approaching a significant resistance zone, an area where sellers have previously stepped in to drive prices lower. This area has previously acted as a key supply zone, making it a level to watch for potential rejection.
If price struggles to break above and we see bearish confirmation, I anticipate a pullback toward the $1,021 level.
However, a strong breakout and hold above resistance could invalidate the bearish outlook, potentially leading to further upside.
This is not financial advice but rather how I approach support/resistance zones. Remember, always wait for confirmation before jumping in.
I’d love to hear your perspective in the comments.
Best of luck , TrendDiva
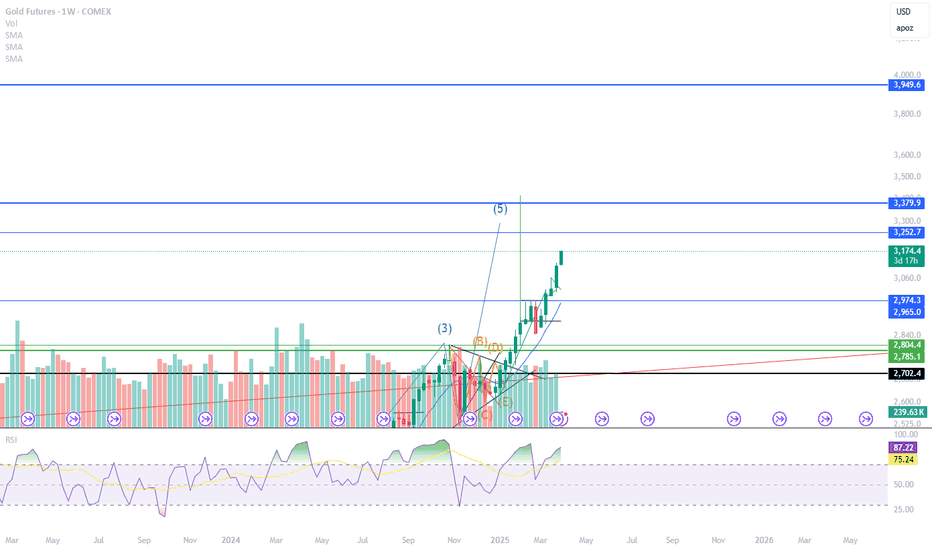
Gold and Silver Out of Sync-Extreme Sentiment and Runaway Movesgold and silver futures chart analysis and why gold may no longer predictably be used to time the silver moves at this period in time; though there are several ways for silver to reach 37-43 and ultimately 50, as gold is likely set to overshoot 3000.
Weekly Market Forecast: PLATINUM Is a BUY!This forecast is for the week of Feb 10-14th.
As the Monthly and Weekly timeframes show, this market is in a ranging consolidation. So the strategy is to buy at the lows and sell at the highs until there is a definitive breakout on either side.
With price having swept the lows of the consolidation, it makes sense price will be heading to the buyside liquidity next.
Enjoy!
May profits be upon you.
Leave any questions or comments in the comment section.
I appreciate any feedback from my viewers!
Like and/or subscribe if you want more accurate analysis.
Thank you so much!
Disclaimer:
I do not provide personal investment advice and I am not a qualified licensed investment advisor.
All information found here, including any ideas, opinions, views, predictions, forecasts, commentaries, suggestions, expressed or implied herein, are for informational, entertainment or educational purposes only and should not be construed as personal investment advice. While the information provided is believed to be accurate, it may include errors or inaccuracies.
I will not and cannot be held liable for any actions you take as a result of anything you read here.
Conduct your own due diligence, or consult a licensed financial advisor or broker before making any and all investment decisions. Any investments, trades, speculations, or decisions made on the basis of any information found on this channel, expressed or implied herein, are committed at your own risk, financial or otherwise.


