Platinum towards Key Resistance. Watch Closely for Confirmation OANDA:XPTUSD is approaching a significant resistance zone, an area where sellers have previously stepped in to drive prices lower. This area is a great zone to watch for potential rejection.
If price struggles to break above and we see bearish confirmation, I anticipate a pullback toward the $1,010 level at least. In this recording I will be explaining in more detail why I think this is a possibility and what to look for.
This is not financial advice but rather how I approach support/resistance zones. Remember, always wait for confirmation before jumping in.
Platinum

Weekly Market Forecast Feb 2-7thThis is an outlook for the week of Feb 2-7th.
In this video, we will analyze the following FX markets:
ES \ S&P 500
NQ | NASDAQ 100
YM | Dow Jones 30
GC |Gold
SiI | Silver
PL | Platinum
HG | Copper
The indices were not easy to trade last week, as there were plenty of fundamentals at play. However, they are relatively still strong, and I am looking for further gains next week.
NFP week, imo, is best traded Mon-Wed. Thurs will likely see consolidation until the NFP news announcement Friday morning. I will look to fade the news release on Friday for NY Session.
Enjoy!
May profits be upon you.
Leave any questions or comments in the comment section.
I appreciate any feedback from my viewers!
Like and/or subscribe if you want more accurate analysis.
Thank you so much!
Disclaimer:
I do not provide personal investment advice and I am not a qualified licensed investment advisor.
All information found here, including any ideas, opinions, views, predictions, forecasts, commentaries, suggestions, expressed or implied herein, are for informational, entertainment or educational purposes only and should not be construed as personal investment advice. While the information provided is believed to be accurate, it may include errors or inaccuracies.
I will not and cannot be held liable for any actions you take as a result of anything you read here.
Conduct your own due diligence, or consult a licensed financial advisor or broker before making any and all investment decisions. Any investments, trades, speculations, or decisions made on the basis of any information found on this channel, expressed or implied herein, are committed at your own risk, financial or otherwise.

Platinum Approaching Key Resistance — Will It Drop to 1,010$?OANDA:XPTUSD is approaching a significant resistance zone, an area where sellers have previously stepped in to drive prices lower. This area has historically acted as a supply zone, making it a key level to watch for potential rejection.
If price struggles to break above and we see bearish confirmation—such as rejection wicks, a bearish engulfing candle, or weakening bullish momentum—I anticipate a pullback toward the $1,010 level. However, a strong breakout and hold above resistance could invalidate the bearish outlook, potentially opening the door for further upside.
This is not financial advice but rather how I approach support/resistance zones. Remember, always wait for confirmation, like a rejection candle or volume spike before jumping in.
Please boost this post, every like and comment drives me to bring you more ideas! I’d love to hear your perspective in the comments.
Best of luck , TrendDiva

Platinum Testing Key Resistance - Reversal Ahead?OANDA:XPTUSD has reached a major resistance zone, where sellers have previously taken control. The current rally has been strong, but this level could act as a turning point if buyers start losing momentum.
If we see bearish confirmation—such as rejection wicks, bearish engulfing candles, or a drop in volume—I anticipate a move toward $971.78 level. A clear rejection here could fuel selling momentum, leading to further downside. However, if price breaks and holds above the zone, the bullish trend could extend higher.
This is not financial advice but rather how I approach support/resistance zones. Remember, always wait for confirmation, like a rejection candle or volume spike before jumping in.
Please boost this post, every like and comment drives me to bring you more ideas! I’d love to hear your perspective in the comments.
Best of luck , TrendDiva

PLATINUM Buy signal on the 1D MA50.Platinum (XPTUSD) is ranged lately within the 1D MA50 (blue trend-line) and 1D MA200 (orange trend-line) but with its 1D RSI rising steadily since the December 30 2024 Low. That was the technical bottom of the Falling Wedge pattern that broke upwards.
As you can see, this has been a very common pattern since September 2023, with all Falling Wedges eventually breaking to the upside to hit at least the 1.618 Fibonacci extension. As a result, our current short-term Target is $999.50.
-------------------------------------------------------------------------------
** Please LIKE 👍, FOLLOW ✅, SHARE 🙌 and COMMENT ✍ if you enjoy this idea! Also share your ideas and charts in the comments section below! This is best way to keep it relevant, support us, keep the content here free and allow the idea to reach as many people as possible. **
-------------------------------------------------------------------------------
💸💸💸💸💸💸
👇 👇 👇 👇 👇 👇

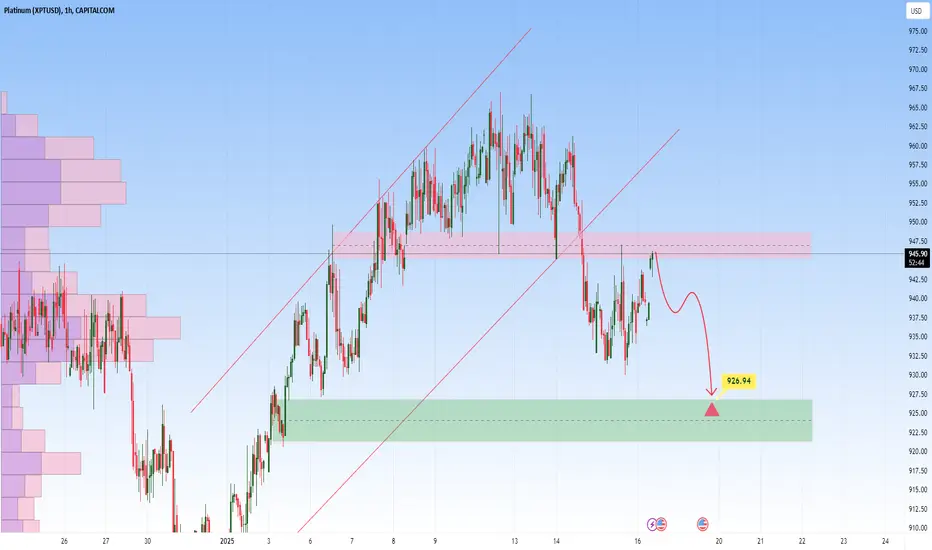
Platinum – Potential Short Setup with RetestPlatinum is currently trading below a key resistance zone, following a breakdown from the ascending channel. The recent bearish momentum indicates the potential for a continuation lower if the price fails to reclaim the resistance zone.
If the price retests this zone and shows rejection signals—such as bearish wicks, engulfing candles, or decreased buying pressure—it would strengthen the case for a short trade. In this scenario, the next target for sellers would be the $926.94 support zone, where buying interest may re-emerge.
This setup aligns with the broader bearish structure following the channel breakdown. Traders should monitor price action closely at the resistance level for confirmation of rejection before entering short positions.
Market Forecast UPDATES! Jan 20 MondayIn this video, we will update the forecasts for the following markets:
ES \ S&P 500
NQ | NASDAQ 100
YM | Dow Jones 30
GC |Gold
SiI | Silver
PL | Platinum
HG | Copper
Enjoy!
May profits be upon you.
Leave any questions or comments in the comment section.
I appreciate any feedback from my viewers!
Like and/or subscribe if you want more accurate analysis.
Thank you so much!
Disclaimer:
I do not provide personal investment advice and I am not a qualified licensed investment advisor.
All information found here, including any ideas, opinions, views, predictions, forecasts, commentaries, suggestions, expressed or implied herein, are for informational, entertainment or educational purposes only and should not be construed as personal investment advice. While the information provided is believed to be accurate, it may include errors or inaccuracies.
I will not and cannot be held liable for any actions you take as a result of anything you read here.
Conduct your own due diligence, or consult a licensed financial advisor or broker before making any and all investment decisions. Any investments, trades, speculations, or decisions made on the basis of any information found on this channel, expressed or implied herein, are committed at your own risk, financial or otherwise.

LUCMF Asymmetric Trade PossibilityLuca Mining Corporation high reward:ratio — multi-month swing trade Here we have an asymmetric trade potential on LUCMF. Price has broken a long term downtrend and seems to have been creating a reversal pattern in the form of an inverse head and shoulders, as many silver miners are currently doing. This same pattern is not only present on most miners, but on the silver futures or spot charts themselves, in which silver has already broken out of; seemingly following the exact pattern of gold, in the handle portion of its cup and handle In this sense, it is safe to assume the miners are lagging silver in such a way that silver has been lagging gold — same exact pattern just slightly late to the party — this gives traders a “second chance” at catching the move in which silver is currently completing — in the miners
Long term target: $1.65.
Speculative entry point — any price above .45 in case of a false breakout
Conservative entry point — any price above the neckline breakout level (you can adjust this lower according to your risk tolerance as many smaller cap miners often produce false breakdowns)
I suspect there will be a false breakdown after seemingly confirming the breakout, which may warrant a liberal stop loss according to your personal risk preference

Weekly Market Forecast Jan 13, 2025This is an outlook for the week of Jan 13-17th.
In this video, we will analyze the following FX markets:
ES \ S&P 500
NQ | NASDAQ 100
YM | Dow Jones 30
GC |Gold
SiI | Silver
PL | Platinum
HG | Copper
The indices look set to move lower this week, with the possible exception of the DOW.
The metals are rallied on Friday, and may continue upward this week, despite a relatively strong USD.
Enjoy!
May profits be upon you.
Leave any questions or comments in the comment section.
I appreciate any feedback from my viewers!
Like and/or subscribe if you want more accurate analysis.
Thank you so much!
Disclaimer:
I do not provide personal investment advice and I am not a qualified licensed investment advisor.
All information found here, including any ideas, opinions, views, predictions, forecasts, commentaries, suggestions, expressed or implied herein, are for informational, entertainment or educational purposes only and should not be construed as personal investment advice. While the information provided is believed to be accurate, it may include errors or inaccuracies.
I will not and cannot be held liable for any actions you take as a result of anything you read here.
Conduct your own due diligence, or consult a licensed financial advisor or broker before making any and all investment decisions. Any investments, trades, speculations, or decisions made on the basis of any information found on this channel, expressed or implied herein, are committed at your own risk, financial or otherwise.

A Little Indicator is Flashing-One that few Know ofI discuss the GP ratio and how t predicts changes in the market environment and consequent downturns

Levrage During this Metals Bull - finding the next Newmount?Relatively safe ways to gain exposure to leveraged plays in the form of mining companies.
Many established miners are way too unbelievably low with current metals prices. Here we look at the technical perspective on why I am bullish on these cyclical mining stocks and why they could yield outstanding returns - which is to say now may be the time to scale in before they catch up to precious metals prices.
FSM
ASM
SBSW

A case for silver.Silver is currently under significant regulatory constraints, and its prevailing market price does not incentivize the allocation of capital toward ventures focused on increasing its supply. This creates a supply constraint for the asset.
Beyond its role as an inflation hedge, a characteristic shared by most commodities, silver possesses unique properties that are particularly valuable for industrial applications. As we stand on the brink of a new wave of industrial expansion, silver's conductivity and reflectivity make it indispensable in various technologies, such as solar panels (where China leads in production), antifreeze formulations, and numerous other applications.
Recently, President Putin announced that Russia will include silver in its strategic reserves. Meanwhile, China has been engaging in confidential agreements with miners and refiners to secure prices over extended periods. Due to China's relatively loose regulatory framework, these transactions are not publicly disclosed, and as a result, they are not reflected in silver's market price. This can be said for African, Latin-American, or other Asian countries with loose regulation for these kinds of markets. Silver pricing predominantly occurs on the futures market, which underscores cases where a disconnect arises between market prices and underlying realities, leading to potential distortions in valuation.
Case 1: JP Morgan commodities trading desk scandal.
" A federal jury in the Northern District of Illinois convicted a former trader at JPMorgan Chase and Credit Suisse today of fraud in connection with a spoofing scheme in the gold and silver futures markets.
According to court documents and evidence presented at trial, Christopher Jordan, 51, of Mountainside, New Jersey, was an executive director and trader on JPMorgan’s precious metals desk in New York from 2006 to 2009, and on Credit Suisse’s precious metals desk in New York in 2010. Between 2008 and 2010, Jordan placed thousands of spoof orders, i.e., orders that he intended to cancel before execution, to drive prices in a direction more favorable to orders he intended to execute on the opposite side of the market. Jordan engaged in this deceptive spoofing strategy while trading gold and silver futures contracts on the Commodity Exchange (COMEX), which is a commodities exchange operated by the CME Group. These deceptive orders were intended to inject false and misleading information about the genuine supply and demand for gold and silver futures contracts into the markets... Four other former JPMorgan precious metals traders were previously convicted in related cases. In August 2022, Gregg Smith and Michael Nowak... spoofing... In October 2018, John Edmonds pleaded guilty in the District of Connecticut... wire fraud, commodities fraud, price manipulation, and spoofing... In August 2019, Christian Trunz pleaded guilty in the Eastern District of New York to one count of conspiracy to engage in spoofing and one count of spoofing... "
This is the article if you'd like to read more: www.justice.gov
My thoughts; This type of practice is an example of how there always a disconnect with real life and markets. One must also remember how information travels and the infrastructure and systems in place that runs our financial system. I believe JP Morgan's swift settlement shows to me there was not much accountability addressed.
Case 2: Silver Thursday, Hunts Brothers, 1970s
" Nelson Bunker Hunt and William Herbert Hunt — oil company executives, investors and brothers — first began purchasing silver in the early 1970s at a price of less than $2 per ounce. The Hunt brothers’ fervor for silver accelerated dramatically following the death of their father in 1974, a Texas oil tycoon known as H.L. Hunt. His passing released a $5 billion fortune to members of the Hunt family.
Fueled by an enormous amount of capital, the Hunt brothers continued stockpiling silver and purchasing silver futures contracts. By early 1979, the price of silver had risen to about $6 per ounce. The Hunt brothers acquired roughly 195 million ounces of silver, about a third of the world’s total supply. They facilitated their silver purchases in part by investing in futures contracts through several brokers, including Bache Halsey Stuart Shields, Prudential-Bache Securities, and Prudential Securities. By December 1979, the market price for silver fluctuated between $20 and $25 per ounce.
Silver had become exorbitantly expensive even for practical uses. Doctors struggled to afford X-ray film for patients, families melted down their heirloom silver flatware, silver burglaries skyrocketed, and Tiffany’s & Co. was forced to drastically raise its jewelry prices. Tiffany’s even took out a full-page ad in the New York Times criticizing the Hunt brothers, writing, “We think it is unconscionable for anyone to hoard several billion, yes billion, dollars’ worth of silver and thus drive the price up so high that others must pay artificially high prices for articles made of silver.”
Silver reached a record high of $48.70 per ounce on Jan. 18, 1980. By some estimates, the Hunt brothers’ entire silver fortune peaked at a value of $10 billion.
Thursday, March 27, 1980
Facing out-of-control silver prices, COMEX (Commodity Exchange, Inc.), a division of the New York Mercantile Exchange (NYMEX), acted against the Hunt brothers. On Jan. 7, 1980, COMEX introduced Silver Rule 7, which placed heavy restrictions on the purchase of commodities on the margin.
Following its peak price of $48.70 per ounce, silver began its decline and the Hunt family’s silver fortune began to shrink.
On March 27, 1980, known as Silver Thursday, the price of silver dropped 50% in a single day, from $21.62 to $10.80 per ounce. The Hunt brothers failed to meet several margin calls and about $7 billion in paper assets suddenly turned into a $1.7 billion debt.
The sudden price drop threatened to collapse several investment firms and banks. To prevent widespread financial chaos, multiple banks joined together to issue the Hunt brothers a $1.1 billion line of credit..."
The original article: learn.apmex.com
My thoughts: Now you see that one entity can have huge influence on the market. Your once dusty silver mirror can become valuable enough for you to go and find it and clean it and sell it.
One actionable step you can take today is to capitalize on silver's current low valuation. There's clearly a lag between what's happening in the physical market and how that information gets reflected in exchange prices. Interestingly, we've seen noticeable price increases and premiums when buying physical silver, but there hasn’t been much movement in the more liquid instruments like the GLD or SLV ETFs—which, by the way, JPM vaults silver for. This disconnect exists because the market takes time to catch up to reality. What’s your take on this?
More articles:
marketsanity.com
www.justice.gov
www.reuters.com
www.investing.com
seekingalpha.com
investingnews.com
metalsedge.com
www.moneymetals.com

PLATINUM Weekly Forecast: Bearish! Look for SHORTS!Keep an eye on this one, as it makes its way down to 911.7.
I'm looking for the highlighted lows to be swept this week.
Enjoy!
May profits be upon you.
Leave any questions or comments in the comment section.
I appreciate any feedback from my viewers!
Like and/or subscribe if you want more accurate analysis.
Thank you so much!
Disclaimer:
I do not provide personal investment advice and I am not a qualified licensed investment advisor.
All information found here, including any ideas, opinions, views, predictions, forecasts, commentaries, suggestions, expressed or implied herein, are for informational, entertainment or educational purposes only and should not be construed as personal investment advice. While the information provided is believed to be accurate, it may include errors or inaccuracies.
I will not and cannot be held liable for any actions you take as a result of anything you read here.
Conduct your own due diligence, or consult a licensed financial advisor or broker before making any and all investment decisions. Any investments, trades, speculations, or decisions made on the basis of any information found on this channel, expressed or implied herein, are committed at your own risk, financial or otherwise.

XPT/ USD "PLATINUM" Metals Market Heist PlanHola! Ola! My Dear Robbers / Money Makers & Losers, 🤑 💰
This is our master plan to Heist XPT/ USD "PLATINUM" Metals Market based on Thief Trading style Technical Analysis.. kindly please follow the plan I have mentioned in the chart focus on Long entry. Our target is Red Zone that is High risk Dangerous level, market is overbought / Consolidation / Trend Reversal / Trap at the level Bearish Robbers / Traders gain the strength. Be safe and be careful and Be rich.
Entry 📈 : Can be taken Anywhere, What I suggest you to Place Buy Limit Orders in 15mins Timeframe Recent / Nearest Low Point take entry should be in pullback.
Stop Loss 🛑 : Recent Swing Low using 2H timeframe
Attention for Scalpers : Focus to scalp only on Long side, If you've got a lot of money you can get out right away otherwise you can join with a swing trade robbers and continue the heist plan, Use Trailing SL to protect our money 💰.
Warning : Fundamental Analysis news 📰 🗞️ comes against our robbery plan. our plan will be ruined smash the Stop Loss 🚫🚏. Don't Enter the market at the news update.
Loot and escape on the target 🎯 Swing Traders Plz Book the partial sum of money and wait for next breakout of dynamic level / Order block, Once it is cleared we can continue our heist plan to next new target.
💖Support our Robbery plan we can easily make money & take money 💰💵 Follow, Like & Share with your friends and Lovers. Make our Robbery Team Very Strong Join Ur hands with US. Loot Everything in this market everyday make money easily with Thief Trading Style.
Stay tuned with me and see you again with another Heist Plan..... 🫂

PLATINUM Huge buy opportunity at the bottom of the Channel Up.Platinum (XPTUSD) has been trading within a Channel Up for almost 1.5 year and currently it is testing the pattern's bottom. This process is similar to the Lower Lows bottom sequence of February 12 2024.
As you can see, even the 1D MACD fractals are the same and we are about to post the decisive Bullish Cross that signals the buy. As long as the price remains below the 1D MA50 (blue trend-line), it is a huge long-term buy opportunity.
The previous Bullish Leg hit the 1.236 Fibonacci extension within the Channel Up and peaked above it on the 1.5 Fib ext. As a result, our technical Target is on the modest 1.236 Fib at 1090.
-------------------------------------------------------------------------------
** Please LIKE 👍, FOLLOW ✅, SHARE 🙌 and COMMENT ✍ if you enjoy this idea! Also share your ideas and charts in the comments section below! This is best way to keep it relevant, support us, keep the content here free and allow the idea to reach as many people as possible. **
-------------------------------------------------------------------------------
💸💸💸💸💸💸
👇 👇 👇 👇 👇 👇

FORECAST UPDATES! Silver / Platinum / Copper /Crude OilTuesday Nov. 19
Price has tipped its hand, and traded through the -FVGs on all of the metals. The bullish rallies
give us a bias to base our buy setups on!
Check the comments section below for updates regarding this analysis throughout the week.
Enjoy!
May profits be upon you.
Leave any questions or comments in the comment section.
I appreciate any feedback from my viewers!
Like and/or subscribe if you want more accurate analysis.
Thank you so much!
Disclaimer:
I do not provide personal investment advice and I am not a qualified licensed investment advisor.
All information found here, including any ideas, opinions, views, predictions, forecasts, commentaries, suggestions, expressed or implied herein, are for informational, entertainment or educational purposes only and should not be construed as personal investment advice. While the information provided is believed to be accurate, it may include errors or inaccuracies.
I will not and cannot be held liable for any actions you take as a result of anything you read here.
Conduct your own due diligence, or consult a licensed financial advisor or broker before making any and all investment decisions. Any investments, trades, speculations, or decisions made on the basis of any information found on this channel, expressed or implied herein, are committed at your own risk, financial or otherwise.

GOLD, SILVER, PLATINUM & COPPER Weekly Forecast Nov. 11thThe Metals are at areas of supportive discount arrays, but will they move higher.
The latest COT Report indicates the institutional traders are betting on higher prices, even when the assets seem to be in consolidation.
Monday is a US bank holiday, and Tuesday may start slow, but I suspect the price action will be clearer come Wednesday.
Check the comments section below for updates regarding this analysis throughout the week.
Enjoy!
May profits be upon you.
Leave any questions or comments in the comment section.
I appreciate any feedback from my viewers!
Like and/or subscribe if you want more accurate analysis.
Thank you so much!
Disclaimer:
I do not provide personal investment advice and I am not a qualified licensed investment advisor.
All information found here, including any ideas, opinions, views, predictions, forecasts, commentaries, suggestions, expressed or implied herein, are for informational, entertainment or educational purposes only and should not be construed as personal investment advice. While the information provided is believed to be accurate, it may include errors or inaccuracies.
I will not and cannot be held liable for any actions you take as a result of anything you read here.
Conduct your own due diligence, or consult a licensed financial advisor or broker before making any and all investment decisions. Any investments, trades, speculations, or decisions made on the basis of any information found on this channel, expressed or implied herein, are committed at your own risk, financial or otherwise.

Chart Idea - PL Swing Long SetupEntry: 990
SL: 950
TP: 1185
RR: 5:1
Not a Financial Advice!!!
----- DYOR ------

Gold & Silver Enter Phase #3 of the Excess Phase Peak PatternGet ready. Both Gold & Silver have moved into Phase #3 of the Excess Phase Peak Pattern - suggesting Gold & Silver will consolidate briefly before either attempting to break downward toward an ultimate low or revert higher, trying to take out the recent highs.
I estimate that Gold and Silver will break downward as fear and panic settle into the market ahead of the US elections.
If you've been following my research for the past 4+ weeks, you already know I predicted this move nearly a month ago, and now we are seeing Gold and Silver roll strongly to the downside.
What is interesting is that they both set up excess phase peak patterns. Gold set up a very quick Phase #1 & #2 (flagging) pattern, whereas Silver's #1 & #2 setup took much longer.
I believe Silver is leading the markets a bit right now throughout this Excess Phase Peak pattern.
If my research is correct, Gold and Silver will break downward over the next 4+ days to identify a substantially lower low - the Ultimate low.
After that, Gold and Silver will base/bottom and move into a very strong recovery phase.
Are you ready for market opportunities over the next 5+ years? Follow my research/videos to learn how you can capitalize on these big moves.
Get some.
#trading #research #investing #tradingalgos #tradingsignals #cycles #fibonacci #elliotwave #modelingsystems #stocks #bitcoin #btcusd #cryptos #spy #es #nq #gold

PLATINUM: Best sell signal of the past 30 days.Platinum is heavily bullish on its 1D technical outlook (RSI = 65.879, MACD = 18.220, ADX = 36.308) as it trades on the bullish wave of the 2 month Channel Up. With the support of the 4H MA50, the price is very close to the top of the pattern. The bullish wave before that, topped upon a +12.17% rise and then pulled back almost to the 0.5 Fibonacci level and the 4H MA200. The current level is already great for a sell entry (if you want you can wait until the RSI gets overbought) and out target (TP = 1,020) is above the 0.5 Fib as the 4H MA200 this time is rising more aggressively than on the previous bullish wave.
## If you like our free content follow our profile to get more daily ideas. ##
## Comments and likes are greatly appreciated. ##

Palladium Rebounds at Key Demand Zone: A Bullish ReversalPalladium has recently experienced a significant rebound at a key demand area around $913, which could mark the beginning of a potential reversal. This price level has historically served as strong support, and its recent behavior suggests a shift in market sentiment.
In addition to this technical observation, our analysis of the Commitment of Traders (COT) report indicates that large speculators and commercial traders might be adjusting their positions in a way that supports a bullish outlook. The emergence of a Double Bottom pattern further strengthens the case for a potential upward move. This pattern, often seen as a reliable reversal signal, indicates that the market has tested a low twice and failed to break lower, which could be a precursor to a significant rally.
Given these factors—the rebound at the demand zone, supportive signals from the COT report, and the formation of the Double Bottom pattern—we are closely monitoring Palladium for a long position. The convergence of these technical and fundamental indicators provides a compelling case for entering the market with a bullish stance, as it suggests that the price of Palladium could be poised for a notable upward movement in the near future.
✅ Please share your thoughts about Platinum in the comments section below and HIT LIKE if you appreciate my analysis. Don't forget to FOLLOW ME; you will help us a lot with this small contribution.

Platinum the trend leader for metalsPlatinum, the trend Queen.
Platinum this session has led the trend for metals so far.
PL has broke it's long uptrend with force. Generally PL likes to trend for several days.
Short intraday pops might happen, but I am watching for possible continuation.
Consolidation or ranging may also be possible short term.
Careful eyes to see if support is made and will hold.
SI looks to be setting up a classic head and shoulders, with Platinum being the warning.
This is NOT trade advice, simply observation.
Have a nice weekend

PLATINUM | XPTUSD Weekly Outlook Oct. 21st: BULLISH Bias!This weekly forecast is for Oct 21 - 25th.
Platinum is heading towards the Swing High with good momentum.
Target should be achieved this week.
Enjoy!
May profits be upon you.
Leave any questions or comments in the comment section.
I appreciate any feedback from my viewers, and I respond to every comment.
Like and/or subscribe if you like the video and want to receive updates directly.
Thank you so much!
Disclaimer:
I do not provide personal investment advice and I am not a qualified licensed investment advisor.
All information found here, including any ideas, opinions, views, predictions, forecasts, commentaries, suggestions, expressed or implied herein, are for informational, entertainment or educational purposes only and should not be construed as personal investment advice. While the information provided is believed to be accurate, it may include errors or inaccuracies.
I will not and cannot be held liable for any actions you take as a result of anything you read here.
Conduct your own due diligence, or consult a licensed financial advisor or broker before making any and all investment decisions. Any investments, trades, speculations, or decisions made on the basis of any information found on this channel, expressed or implied herein, are committed at your own risk, financial or otherwise.
