Pln
CHFPLN: Long opportunity within a 1D Rectangle.The pair has been trading sideways within the 3.94000 1D Support and the 4.05500 1D Resistance since early August, forming a Rectangle pattern on 1D (RSI = 42.228, MACD = -0.007, Highs/Lows = -0.0314, ADX = 25.098).
At the moment it is near the 1D Support, hence on optimal buy levels, even though the RSI shows there is still a minor potential for a lower pull (if the previous bottom is repeated). Our Target Zone is 4.04000 - 4.05500.
** If you like our free content follow our profile (www.tradingview.com) to get more daily ideas. **
Comments and likes are greatly appreciated.
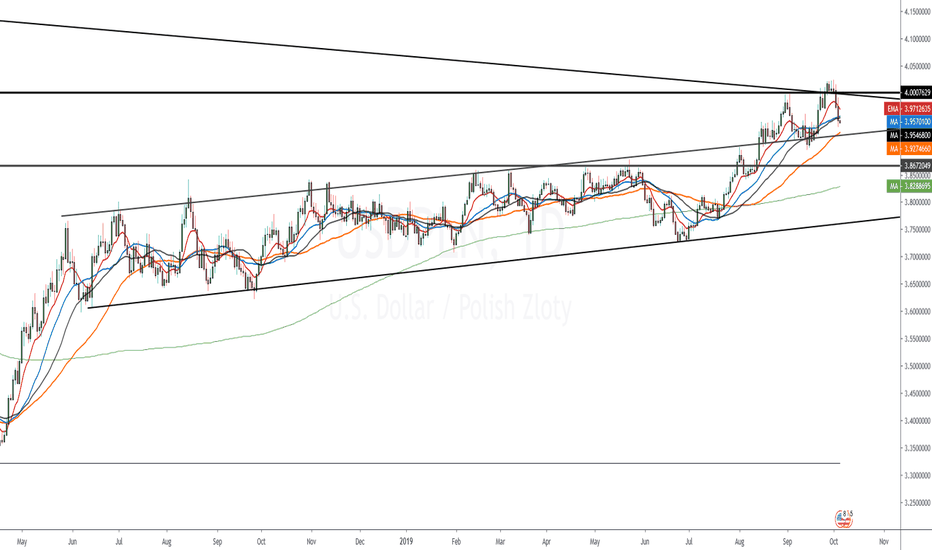
USDPLN: Long opportunity within a 1D Megaphone.The pair is trading within a 1D Bullish Megaphone pattern (RSI = 63.428, MACD = 0.027, Highs/Lows = 0.0246) since the late June bottom. On September 13th it even tested and held the 3.90000 1D Support which is more than enough (along with the 1D MA50) to sustain this uptrend. Our goal is the 4.10000 1M Resistance which has been holding since the Lower High in March 2017.
** If you like our free content follow our profile (www.tradingview.com) to get more daily ideas. **
Comments and likes are greatly appreciated.
EURPLN: Short opportunity within a 1D Rectangle.The pair has discontinued its uptrend (RSI = 61.957, MACD = 0.014, Highs/Lows = 0.0151) this week having been rejected near the 4.4000 1D Resistance. This creates ideal conditions for a reversal towards the 4.31460 1D Support, essentially aiming to trade within a Rectangle pattern. We are short on this formation with 4.33200 - 4.31460 as the Target Zone.
** If you like our free content follow our profile (www.tradingview.com) to get more daily ideas. **
Comments and likes are greatly appreciated.
EURPLN shortTrading these odd pairings can be tough but with the ECB set to destroy the value of the Euro further in about a week and the algo triggering a short signal, might be worth a small play.
Volume is starting to pick up, and momentum to the downside has plenty of room to run even if it's flattening out a bit today.
USD/PLN Two Possible Scenarios by ThinkingAntsOkDaily Chart Explanation:
On the daily chart, price broke the Channel that has been forming since October '18. After that, consolidated on a triangle pattern and now it is facing the Resistance Zone. In the Short term, we expect a bounce at this level.
Weekly Chart:
Short Analysis Explained on USD/PLN by ThinkingAntsOk4H CHART EXPLANATION:
Price is trying to get inside the broken Daily Ascending Wedge, but now is facing the Daily Resistance Zone. We consider it may bounce here and get outside the wedge again. If that happen, then price has a strong bearish potential towards the multiple support zones. It would be necessary for the Ascending Trendline to be broken to confirm the downwards move.
MULTI TIMEFRAME ANALYSIS:
-Daily:
-Weekly:
Short Trade and Full Analysis on USD/PLN by ThinkingAntsOk4H CHART EXPLANATION:
In the 4h chart, we observe that price bounced at the Resistance Zone, breaking down the Ascending Trendline. At this moment it is on a corrective structure pullbacking the broken trendline. We expect a breakout from here, and the bearish movement has potential to reach the next Support Zone.
MULTI TIMEFRAME ANALYSIS:
-Daily:
-Weekly:
"Top and Bottom Analysis" USD/PLN by ThinkingAntsOk4H CHART EXPLANATION:
We observe that price broke down the Ascending Wedge Pattern, so, we expect a corrective movement since it did not correct after the breakout. It would be an optimal point to place an entry, looking for a downside move towards the support zone.
MULTI TIMEFRAME ANALYSIS:
- Daily:
- Weekly:
USDPLN SHORT Sorry for this markup. I feel so comfortable.
No comments required. All description on the chart. Do not forget to look at the chart when closing each bar. All transactions are at your own risk. This is my personal opinion, it may differ from yours.
!!!You make money, not someone instead of you!!!


