$SPY Daily Chart Taz Plan - May 2025 into June-July Breakdown📉 SPY Daily Chart Trading Plan — May 2025
Thesis:
Price has returned to the exact level ($594.20) where the February impulse breakdown began. This zone is acting as a Lower High rejection within a broader bearish structure. A clean rejection here opens the door to multiple inefficiency fills below.
🔍 Structure Breakdown:
Feb High (ATH): $613.23
Feb Open: $592.67
Feb Close (last green candle before impulse): $594.20
Current Price: $594.20
Marked LH: $592.50
This is a rally back into rejection, not strength.
📉 Key Zones & Gaps:
🔺 Gap Supply: $566.48 – $578.50
🔺 Wick Gap: $558 – $566 → Needs a full-body candle to initiate fill
🟥 FVG (4/22): $528 – $541.52
🧱 Major Support: $481.80
🧠 Trade Plan:
Short Entry 1 (Confirmation-Based):
🔻 Red candle rejection under $592.50 = starter short
🔻 Watch RSI and MACD for momentum fade
Short Entry 2 (Gap Breach):
🔻 If $578 is broken and retested → scale in
🔻 Gap fill expected quickly once triggered
Short Entry 3 (Wick Gap):
🔻 Body close through $558 = last add
🔻 Sets up for final flush to FVG
🎯 Targets:
$578.50 → $566.48 (Gap Fill)
$558 → $541.52 (Wick Gap & FVG Top)
$528 – $530 (FVG Close)
$481.80 (Long-Term Panic Target)
❌ Invalidation:
Daily close > $595.50 = Pause thesis
Weekly close > $600 = Structural shift, short squeeze zone
🧠 Final Thoughts:
This isn’t just a gap fill play — it’s a structural fade from a lower high back into memory. The Feb impulse wave left behind layers of inefficiency, and price just tapped the origin of the breakdown.
Momentum is peaking. If this is a trap, the downside should begin immediately.
Let the chart prove it.
PLTR

US Downgrade, 3-5-10% Pullbacks But Still Bullish on S&PHappy Sunday!!!
US Futures open lower after Friday's close and Moody's downgrade.
Last time this occurred in 2011, the S&P dropped around 10% from the "news."
This is all interesting timing but I'm still liking pullbacks for opportunities to position
bullish in the US indexes (S&P, Nasdaq, Dow)
Because the melt-up continues to run (US/China gap last week and drift higher), I'm trying to stay patient for a pause or pullback
Trump and Bessent are still chirping about Tariffs and a government "detox" so a round of trade war related news may help calm the market's red hot advance post April 7 lows
I'm selling calls on owned positions for income. I'm waiting for more favorable levels to add new positions, but within 3-4% of all time highs for the S&P and Nasdaq I don't think anybody will be surprised to see the all-time highs revisited in the near to medium-term
Let's have a great week - thanks for watching!!!
-Chris Pulver

$MSTR Monthly Top Form: “Backwards 4” + Multi-TF RSI DivergenceBefore we begin... trading view is restricting my post for an indicator.. maybe someone reported it... not sure... doesn't seem like a problem... it's a TD Sequential ...
🔍 The Setup — Monthly “Backwards 4” Pattern + Multi-Timeframe Breakdown
We’re now forming the 5th candle in what I call the “Backwards 4” formation, or the upside-down lowercase ‘h’ — a recurring reversal structure I’ve tracked at macro tops.
Structure breakdown:
✅ Strong monthly green candle
2–3. 🔻 Two red candles that retrace the body but don’t break it
✅ A second green candle that re-tests the highs and baits breakout buyers
❌ Final candle closes red → confirms exhaustion → multi-month drawdown begins
We saw this exact setup in early 2021 before MSTR collapsed from $1,000+ to $134. The pattern is now repeating — but this time it’s backed by RSI + MACD divergences on all major timeframes.
📊 Multi-Timeframe Technical Breakdown
📆 Monthly
Inside the “Backwards 4” zone now (candle 5)
RSI Bear Divergence: price made new highs but RSI keeps printing lower highs
MACD flattening after extended expansion
Volume fading for 3 months straight
📌 Momentum is dying while price floats. That’s not strength — that’s late-cycle distribution.
📆 Weekly
TD9 printed this week at the top of a tight 5-month box
RSI rejected at 63.61 — exact same rejection level as last cycle highs
MACD histogram curling while price stayed flat
Range: ~$338–$430 → energy has been spent
📌 This isn’t breakout behavior — it’s a liquidity trap.
📆 Daily
Double top attempt failed at $406
MACD crossed bearish, histogram turning red
RSI Bear Divergence Confirmed:
Price made higher highs from April to May
RSI made lower highs, tagging 66.90 vs. 74.70 earlier this year
📌 Daily has now logged 3 bearish RSI divergence peaks since February.
📋 Trading Plan (as of May 17, 2025)
Position: No current short — stalking ideal entry
Entry Zone: $406–$410 rejection zone (upper box resistance)
Trigger: Daily close under $390 confirms failed breakout
Add Confirmation: Weekly close under $375 = trend shift
Stop: Above $430 monthly high (invalidates breakout fade)
Target 1: $320–$290 (May red close zone)
Target 2: $262 (range midpoint / fib retrace)
Target 3: $240 (prior base support)
Stretch Targets: $175 and $102 if macro breaks down
Waiting for clean structure breakdown before initiating core position. This is a setup worth being early but precise on.
🧠 Final Thoughts:
This is one of my highest conviction macro top setups.
The “Backwards 4” is showing up again with RSI and MACD fading across the board. Price is floating under resistance on weakening momentum, and volume confirms it.
If May closes red, we likely begin a multi-month correction.
I’m watching for the breakdown trigger under $390 to begin building short exposure, targeting sub-$300 by month-end and lower into summer if momentum continues to unwind.
📉📦 Let’s see how it finishes.

$QQQ Over $523.5 for a retest of Highs. Lower High Setup?As you can see on the notes in the chart, several 5 counts lead to sell offs in the last Quarter. Will this trend continue or will we run it to a 9 Count again? 3 Days left. Watch these levels as I have a possible selloff to May open Price. This would effectively follow my 10D chart forecast of new lows in the next 30-40 trading days, if not 20 for significant damage either way. I will continue to update as we go.

$PLTR - Bullish Cup and Handle Pattern on the Weekly ChartNYSE:PLTR Hello everyone! I've been analyzing the weekly chart and noticed a bullish cup and handle pattern that I think is worth sharing with you. This pattern suggests a potential price target of $130 for next year if it follows through as expected. I find this pattern quite interesting and will keep a close eye on it for potential trading opportunities.

Put sale on PLTRNice drop on earnings. Appears to be a double Bottom on a daily chart. Strong up trend.
This is a nice buy low, sell high opportunity.

PLTR – Flat Top Breakout + Earnings Gap ReversalNASDAQ:PLTR – Flat Top Breakout with Earnings Gap Reversal
Palantir ( NASDAQ:PLTR ) is setting up for a potential explosive move, combining two of my favorite setups:
🔹 Flat Top Breakout (ATH Setup)
Price is pressing against the $126 resistance, a clear flat top breakout level.
A clean move above this triggers a breakout to new all-time highs (ATH).
🔹 Earnings Gap Down Reversal (Bullish Signal)
Recently, PLTR gapped down on earnings — but bulls stepped in fast, pushing it back up.
This is a classic gap down reversal setup, a strong signal of bullish momentum.
We saw the same setup play out on NYSE:SPOT , which reversed after earnings and broke out to ATH.
🔹 My Trading Plan:
1️⃣ Anticipatory Entry: Looking to buy dips into the shaded cloud zone (dynamic support).
2️⃣ Breakout Confirmation: Add size on a clean breakout above $126.
3️⃣ Stop Loss: Tight stop below the cloud zone to protect capital.
🔹 Why I Love This Setup:
Gap reversals signal aggressive buying even after bad news — a sign of a strong market.
Flat top breakouts tend to have explosive follow-through, especially with earnings momentum.

$SPX Urgent! My <3 & My Soul: Slow Bleed Crash to 3k by Q4 26' Do be warned. Very important post here. I put my heart and soul into this. I made a video earlier and then it got deleted by accident, so I made a less happy one right after. I've got news for all the bulls and investors out there that feel they will be able to continue buying every single dip out there. Get ready for the dip that keeps dipping. Big names already cracking heavy. NASDAQ:META NASDAQ:TSLA NASDAQ:AMD NASDAQ:NVDA to name a few. Big tech is getting cleaned out and layoffs are on the rise. Tariffs create huge amounts of uncertainty. I don't feel like this is rocket science. Buffet is all cash. 89% of Hedge Fund managers believe the US market is the most expensive its ever been and Tutes have been selling at the highest rate ever before. I think it's time the US finally gets a shake down. Bullish conditioning has been running rampant, and I've seen Social Media Accounts discourage charting and only paying attention to price action? Price action involves the entire collective, not just one Timeframe. Anyways, here's an overlay from 01' ... the only one I could find that matches. Says short 560 around May 7th and then take profits around 500 again. Let's make this a nice one. Calls till 560 into May then flip to Puts into June. From then short 530 every time you can. $450 is My first target after we break previous lows. I will update as we go. Have a good one yall.

Chapter 3: “The Skyveil @$116 Shattered” (Buy until $124)The smoke still clung to the air as the dust settled atop $113. Behind them, the battlefield lay littered with broken resistance. But NASDAQ:PLTR did not stop to rest.
No… the warrior lifted its gaze, and there it was:
The green dotted line.
A spectral threshold, shimmering above the plains at $116–$117, a boundary etched by the hands of past momentum. For many, it was a ceiling. For PLTR, it was a dare.
“Cross me,” the line seemed to whisper.
“If you can.”
And so… they marched.
With each step higher, the volume beneath them rumbled like war drums.
Every tick upward: a shield raised, a sword drawn.
$114… $115… $116…
And then — the clash.
The green line wasn’t just a price level.
It was a fortress in the sky.
As PLTR’s price struck its surface, a shockwave rippled through the chart.
Red candles flared, sellers firing their volleys from the ramparts.
The price staggered backward, briefly retreating toward $115.75… $115.50…
But this wasn’t retreat.
This was the drawing back of an arrow before the release.
Suddenly —
A surge of volume.
A roar of momentum.
A candle forged in fire.
A towering green candle burst forth, piercing the green dotted veil, splitting it like thunder cleaving the night.
Stop-losses ignited.
Shorts fled.
Momentum traders piled in, shouting like an army unleashed.
PLTR didn’t just break the green line.
It obliterated it.
The price flew higher: $117… $118… $119.85.
Every level above was no longer resistance —
it was acceleration.
And now, standing tall at $119.85, up +8.5%, the warrior looked beyond.
Ahead shimmered new battlements:
$120… $121… $122.
The final walls before reclaiming the higher kingdom.
The market watched in awe.
“It was never about breaking resistance,” whispered the charts.
“It was about proving the sky was never the limit.”
PLTR stood, sword raised, armor shining in the glow of its momentum.
The green line broken beneath its feet.
The wind at its back.
And as the candles flickered forward, every tick toward $124 felt inevitable.
The battle wasn’t over....
...The conquest had only just begun.

PALANTIR Channel Up intact. Eyeing $185 on this rally.Palantir (PLTR) has been trading within a 2.5-year Channel Up and is currently on its most recent Bullish Leg following the approach f the 1W MA50 (blue trend-line).
Having also rebounded on its long-term RSI Support Zone, the buying pressure is the strongest we've seen inside this pattern, having recovered all loses in just 4 weeks.
Given that the most usual rally was +183.03%, we expect this Leg to reach at least $185.
-------------------------------------------------------------------------------
** Please LIKE 👍, FOLLOW ✅, SHARE 🙌 and COMMENT ✍ if you enjoy this idea! Also share your ideas and charts in the comments section below! This is best way to keep it relevant, support us, keep the content here free and allow the idea to reach as many people as possible. **
-------------------------------------------------------------------------------
💸💸💸💸💸💸
👇 👇 👇 👇 👇 👇

$PLTR momentum is heating up - ATH's INBOUND!🔥 NASDAQ:PLTR momentum is heating up!
All-time highs on the horizon! 🎯
✅ Indicators curling bullish
✅ Volume Shelf ready to launch 🚀
✅ Wr% pendulum swinging in favor
Big move incoming—are you in? 👀
Not Financial Advice

$PLTR Trade: Buy $90.86 , Target $101.35Beep Beep. Hope everyone is taking care of their trading accounts during this volatile phase in the markets. I noticed an identical setup on the weekly from back in August 24' and I'm looking to take advantage. We have a trend reversal on the Tom Demark sequential that helps identify trend exhaustion through a 9 Count. Currently on a 2 Count, we're testing the gap while simultaneously testing the 10WMA at 90.86.There is also a weekly gap at 101.35 ... Entry would be the 10WMA. Target the weekly Gap. Trade is as follows:
Trade Idea - Swing NASDAQ:PLTR $95 Calls 4/25
Entry - 10 WMA @ $90.86
Target - Gap on Weekly at $101.35

$PLTR 50%+ decline ahead, $39-56 targetNASDAQ:PLTR looks like it's topping here and that it has a long road to the bottom.
If we continue to reject at this resistance, then it's likely that we'll at least see the $56 target on the downside, but I think the $44 target is the most likely area to see a bounce.
Bulls should enjoy a 50%+ drop from here. You've been warned.

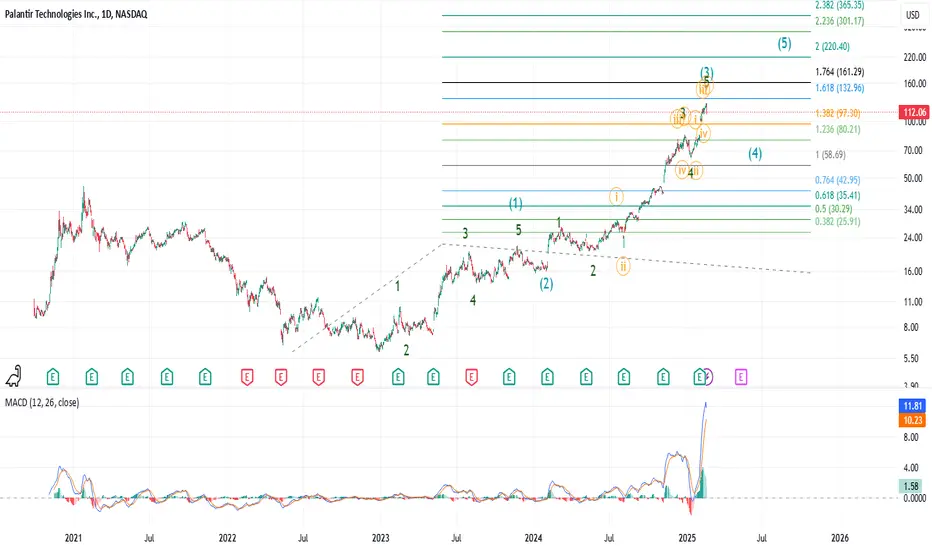
PLTR: Won't be surprised by a 30-40% dipPLTR has been on a rip, but not without periodical 20-30% dips along the way. The way MACD is extended, it will not be surprising to see a somewhat meaningful pullback to start the wave 4 correction. Wave 2 was around 30% and lasted around a couple of months. Wave 4 can be quick and deep or can be a triangle that will take some time to resolve. Either way, I will be looking for $100 - $80 for support.
When You Bought the Farm: PLTR, BRB, CALM, ROBLOX, ADMA, PLMRI am not in a market for super stocks in this environment at the moment. Also, I am looking beyond the trade war and into quality companies:
Fundamentals:
Warren Buffet says, "When you bought the farm, you looked at what the farm would produce".... "...the potential of the farm"..."You don't need a quote on it."
PLTR's May 14, 2024 Investment Update for April 21, 2025:
See the following chart. Fundamentals are still good:
(BellRing Brands, Inc.) BRBR - think protein bars and shakes: A recent investment:
Cal-Maine Foods (CALM): Speaking of farms and chicken eggs! Cal-Maine Foods is "the largest producer and distributor of fresh shell eggs in the United States, committed to offering our customers a wide range of quality egg and egg product choices produced in a safe, cost-effective and sustainable manner." (www.calmainefoods.com). It has good ROE and the quality of institutional investment has steadily grown legs into this company. It meets basic parameters of an investment.
ROBLOX (RBLX): I did my own personally survey and contacted several hundred of family and friends from the globe, and not only are Gen-Z playing ROBLOX, but even young adults are into it. It is true that with its immersive platform, "every day, millions of people come to Roblox to create, play, and connect with each other in experiences built by our global community of creators." Another company that I mentioned is Take-Two (TTWO) with Grand Theft Auto 6 coming out around August or September 2025 this year, I think it also will continue to surprise and do well. I shall invest in both; however, I like ROBLOX better.
I mentioned other companies in the video that are minor investments and the technical aspects of entry: Marex Group (MRX), Palomar Holdings (PLMR) and ADMA.

Can AI Forge America's Next Shield?Palantir Technologies finds itself strategically positioned at the forefront of a potentially transformative U.S. defense initiative, the "Golden Dome" missile defense system. As a crucial partner in a consortium reportedly led by SpaceX and including Anduril Industries, Palantir is a leading contender for significant involvement in this multi-billion-dollar project. Golden Dome aims to establish a next-generation, networked shield against advanced missile threats, emphasizing rapid development and integration of space-based sensors and diverse defensive capabilities, moving beyond traditional procurement timelines.
Within this ambitious framework, Palantir's role leverages its core expertise in AI and large-scale data analytics. The company is anticipated to provide the essential software platform required to process and interpret data from potentially hundreds or thousands of tracking satellites, creating real-time situational awareness and enabling coordinated responses across the complex defense network. This involvement could also benefit from innovative procurement approaches, such as SpaceX's proposed subscription model, potentially securing stable, long-term revenue streams for Palantir.
Recent successes underscore Palantir's readiness for such a demanding role. The rapid adoption of its Maven Smart System by NATO validates its AI capabilities in high-stakes military environments, while its partnership with Vatn Systems demonstrates the utility of its platform in scaling and modernizing defense manufacturing. Securing a key position in the Golden Dome would represent a major strategic victory, solidifying Palantir's ascent as a disruptive force in the defense technology sector and signaling significant growth potential as it helps shape the future of national security.

PLTR: Testing Key ResistancePrice has reached a meaningful resistance area near the March highs, which may trigger renewed selling pressure. If confirmed, this could open the path toward a deeper move into the macro support zone around 60–50.
Until price is closing bellow 100, my operative scenario is one more wave down to a macro support.
Thanks for your attention and best of luck with your trading!

PLTR Weekly Options Trade Plan 2025-04-16NASDAQ:PLTR PLTR Weekly Analysis Summary (2025-04-16)
Below is the integrated analysis of all the model reports:
──────────────────────────────
SUMMARY OF EACH MODEL’S KEY POINTS
• Grok/xAI Report
– Technical indicators on both short‐term (5‑minute) and daily charts are bullish.
– The price is trading above all key EMAs and has recently made higher highs/lows.
– Although the 5‑minute RSI is overbought and MACD shows a slight negative reading, the daily chart is strongly bullish with a bullish MACD crossover.
– Options data shows a max pain at $92.00 (well below the current price), and Grok recommends buying a naked call at the $99 strike for the weekly expiration at an estimated premium of $0.55.
• Llama/Meta Report
– The short-term chart reveals a near-term consolidation: recent closes are mixed with a cooling RSI and a negative MACD histogram, hinting at possible short-term pullbacks.
– The daily picture remains upward with bullish trend indicators, though the report notes conflicting evidence about overbought conditions.
– Their overall bias is “moderately bullish” but they tilt toward caution by suggesting—in an alternate scenario—a naked put near $95 if the price reverses.
• Gemini/Google Report
– The daily trend is strongly bullish with price well above moving averages and positive MACD/histogram readings.
– The 5‑minute chart, while bullish, shows signs of consolidation near current highs (observed in Bollinger Band touches and slight RSI cooling).
– Despite the max pain level ($92.00) that could impose later headwinds, Gemini remains moderately bullish and recommends a naked call strategy at the $100 strike — with the plan to enter at the open but with strict risk measures.
• DeepSeek Report
– On short-term charts, DeepSeek notes bullish fundamentals but also flags very high recent gains (+27% in five days) and the pressure from a max pain level far below current levels.
– The s
hort-term indicators (MACD on the 5‑minute chart) even hint at a near-term pullback, making the overall picture mixed.
– Their conclusion is to hold off (“no trade”) given the conflicting signals; if forced, they would consider a bearish put (again near $95) rather than a call.
──────────────────────────────
AREAS OF AGREEMENT AND DISAGREEMENT
• Agreement
– All models agree that PLTR has been on a strong recent rally; technicals on the daily chart show a marked upward bias.
– Every analysis notes potential near-term caution: the fast rise, signals of consolidation on shorter timeframes, and the fact that the max pain level ($92.00) is far below the current price.
– There is consensus that if a trade is to be attempted, one must trade with a strict, short‑term (weekly) setup and disciplined risk management.
• Disagreement
– Grok and Gemini lean toward an intraday bullish play with a naked call, while Llama (and DeepSeek’s alternative scenario) bring up the possibility of a trade in the bearish direction (naked put) due to short-term pullback indicators.
– DeepSeek ultimately suggests sitting out rather than initiating a trade given the asymmetry between a bullish trend and the potential risk imposed by max pain; meanwhile, Grok and Gemini are prepared to buy call options if conditions hold at the open.
──────────────────────────────
CONCLUSION
Overall Market Direction Consensus:
While the daily trend is clearly bullish, all models signal that the stock is now extended and vulnerable to a short-term consolidation or pullback. In our integrated view, the directional bias is moderately bullish but not without risk.
Recommended Trade:
Based on the majority—especially the Grok and Gemini reports—and provided that the market opens in line with recent momentum, a cautious bullish play is recommended. We will trade weekly options only and use a naked call strategy. To keep our premium in the ideal range, we choose a strike that is close to t
he current price yet slightly out‐of‐the‐money.
• Trade: Buy a naked call option
• Strike: $99.00 (as recommended by Grok, and a reasonable compromise between the $99 and $100 levels)
• Expiration: Weekly options expiring on 2025‑04‑17
• Premium: Approximately $0.55 per contract (within our target range)
• Entry Timing: At the open
Risk & Considerations:
– There is a significant risk that—given the recent 27% rally and short‐term consolidation indicators—the stock could pause or pull back toward the max pain near $92.00.
– In the event of a sudden intraday reversal (for example, a move below key M5 support levels around $98.16–$98.29), the position should be exited promptly.
– The intraday volatility remains high (VIX around 30 but falling), so close monitoring is essential.
• Confidence Level: Approximately 75% based on the integrated view
──────────────────────────────
TRADE_DETAILS (JSON Format)
{
"instrument": "PLTR",
"direction": "call",
"strike": 99.0,
"expiry": "2025-04-17",
"confidence": 0.75,
"profit_target": 0.83,
"stop_loss": 0.37,
"size": 1,
"entry_price": 0.55,
"entry_timing": "open"
}

PLTR - Beginning Cup and HandlePrice has finished forming the full cup pattern and is now looking to move downwards to begin the formation of the handle
This downward move is supported by the trend line in white dotted
Daily timeframe

PALANTIR. THE STOCK THAT BEATS S&P 500 INDEX, 11 MONTHS IN A ROWSomewhere in another Galaxy, in late December, 2024 (yet before The Second Coming of Trump), @TradingView asked at it awesome Giveaway: Happy Holidays & Merry Christmas!
1️⃣ What was your best trade this year?
2️⃣ What is your trading goal for 2025?
Here's what we answered:
1️⃣ What was your best trade this year?
- Surely Palantir NASDAQ:PLTR 💖
I followed Palantir all the year since January, 2024, from $16 per share, watch here.
Current result is 5X, to $80 per share.
Also I added more Palantir after SP500 Index inclusion in September 2024 watch here.
Current result is 2.6X, from $30 to $80 per share.
2️⃣ What is your trading goal for 2025?
- Once again, surely Palantir NASDAQ:PLTR 💖
It's gone three months and a half or so... (Duh..? Haha.. 3 months, really? 😸😸😸)
Let see what's happened next at the main graph PLTR/SPX
First of all, let me explain in a few words what does this graph mean.
Rising (Blue) candle means Palantir NASDAQ:PLTR monthly return is better vs SP:SPX
Falling (Red) candle means Palantir NASDAQ:PLTR monthly return is worse then SP:SPX
Conclusion
👌 PALANTIR. THE STOCK THAT OUTPERFORMS S&P 500, 11 MONTHS IN A ROW.
👌 WERE WE RIGHT ON CONTEST AND WON IT? EXACTLY!
--
Best wishes,
Your Beloved @PandorraResearch Team 😎

Opening (IRA): PLTR May 17th 100 Covered Call... for a 86.55 debit.
Comments: After closing out my long-dated covered call for a realized gain, re-upping with a shorter duration setup with a max profit potential of greater than 11.18, which is what I'm net down on this underlying YTD.
Metrics:
Buying Power Effect/Break Even: 86.55
Max Profit: 13.45
Will look to roll out the short call at 50% max to reduce my break even.

Investment of the year!NASDAQ:COIN is following the price action of palantir. After making a cup it is retesting the 0.618 for months now and is showing some strength. After previous ATH gets broken it will teleport out of the handle to the 1.272

Pullback Continuation PLTR After hit first target 97, now has offereda a pullback to the key 90 level
Indicators showing good potential, momentum, sttregnt, directional.
Part of a market idea
