Covering all the Plays made a month ago to about a week agoThis is a video I made to cover all the plays made about a month ago up until about two weeks ago. I cut off half way through and honestly I thought it didn't record any of it. So I am posting it now. and I will pick up where it left off probably tomorrow.
If these have helped you trade please like and follow.
by iCantw84it
05.26.2021
PLTR

We are doing great, but I have good and bad news for you.Ok, my dear traders, we have good and bad news. Let's start with the bad one.
PLTR has what looks like an advanced breakdown, as the RSI is losing its support, while the price don't yet. Also, we are right at the 22, the most difficult price level for PLTR to break in the near future.
Now, the good news. We have a bull trend, and PLTR is going up, after it touched the 20ma, as we expected. Nothing here makes me believe it'll reverse this momentum.
PLTR has more upside ahead, but I would not be amazed if it suddenly drops to the 20ma again. The advanced breakdown would be the first indicator of a correction of this magnetide.
But the trend is still bullish, and PLTR keeps going up. I'll keep saying, the 24 is the target.
If you liked this trading idea, remember to click on the “Follow” button to get more trading ideas like this, and if you agree with me, click on the “Agree” button 😉.
See you soon,
Melissa.

PLTR: Trying to reverse the trend!Hello traders and investors! Let’s see how PLTR is doing today!
We have a solid bull trend in the 1h chart, as we have higher highs/lows , and a trendline connecting the previous bottoms. What’s more, PLTR defeated every single of its resistances, showing some strength. This is good, and it reinforces our bullish thesis, since our last analysis, last week (link to it below).
Pullbacks to its support levels, like the trendline, 21 ema, or any of the black lines would be just opportunities to buy . This bull trend is spreading to the daily chart as well:
There are two good things here. First, it defeated the $ 21.60, which was a pivot point . Second, it is trading above the 21 ema again. Yes, PLTR had similar patterns in the past, and it failed, so, why would this time be different?
Because PLTR did a false breakout from the $ 20.18, and the volume increased a lot over there. This means that there are people aggressively buying PLTR near support levels, and the more it drops the better. It is almost reversing the trend for good in the daily chart, it seems we just need more conviction.
Now, the volume is normal, which is fine, but it feels that it needs to increase a little bit more. Either way, we do have some bullish signs around, and several resistances that could work as targets for us. Also, we have an open gap around $ 31.34, which might work as a magnet in the next few weeks.
Let’s follow PLTR closely, and if you liked this analysis, remember to support it ! And follow me to keep in touch with my daily updates.
Thank you very much.

TSLA ROLLERCOASTER AHEADIt's clear TSLA is correcting after a historic run. things dont go vertical forever. Are you new here?
I have it in wave 4 of C
Anticipating a complex correction by the rule of alternation, so wave 4 still has some time to play out completely.
It's clear wave B of the larger ABC is complete. wave C projected to the 1:1 of A to B.
given that wave 1 of C projection went REALLY deep, like almost to the 2.618, we can expect a deep wave 5 as well.
This will establish bullish divergence on the larger TFs as well.
By VPVR there's targets near the 3.618. I really dont like doing fibs this far out, but im giving it a relative zone that fits the evidence mentioned above.

PLTR Broke the resistance? not yet (buy at 22.60)i found one more trend line and I would want pltr to break it in order for me to buy.
A safest buy for me would be AFTER that 22.56 one way or another we have big targets ahead if it breaks that.
NYSE:PLTR


PLTR ready to break channelI see possibility for a channel break in either way, imho UP, wait for confirmation

$PLTR Update - Monster Momentum Ahead PLTR working out beautifully as it broke out of its downward channel, now that the reversal is clear, we can watch this bounce off the 100 and 50 Day moving averages, giving this room to move exponentially towards previous ATH's.


It hit the 20ma as we expected. Now what?Yes, PLTR is sitting at the 20ma as we expected it would in our last analysis, and tomorrow we'll see if it'll fly again, or keep the correction!
The bias is clearly bullish, and I think this movement is not done yet! Yes, it hit the 22 today, the target we've been aiming, but if you look at the 4h chart, there's still some upside left!
The problem: The 22 is the 61.8% fibs retracement, and was a nice support level in the past, so, in theory, it shouldn't be easy to break it.
But given the bull trend in the 30min, it is possible to see a breakout here, and in this case, the next stop is the 24 area. The RSI is not overbought at all, and it could go higher before a correction in the 4h chart.
So far, we doing amazingly well here. I'll keep you guys updated every day :)
If you liked this trading idea, remember to click on the “Follow” button to get more trading ideas like this, and if you agree with me, click on the “Agree” button 😉.
See you soon,
Melissa.

$GME Broken Downtrend, To The Moon? video update on $GME as we near earnings. alot of things will pump before earnings just to dump so i am curious on how that call will play out.

PLTR Q1=20.16, Q2= 19.24, Q3= 17.04NYSE:PLTR
Really want PLTR to succeed but for now, I think it got rejected. If it does cross the resistance will redo the chart with nicer targets.

PALANTIR is on a good wayIn the chart you can still see a breakout (attempt), which is now considered as "confirmed" for me.
I see a real bullish reversal trend if we see the scenario that I have represented with the yellow arrow. I am very positive about the future of palantir.

$PLTR Breaking out with a green close today - Target $27Palantir looking strong breaking from its downward channel, a solid green candle to complete todays close gives me full confidence for a move back towards $27.

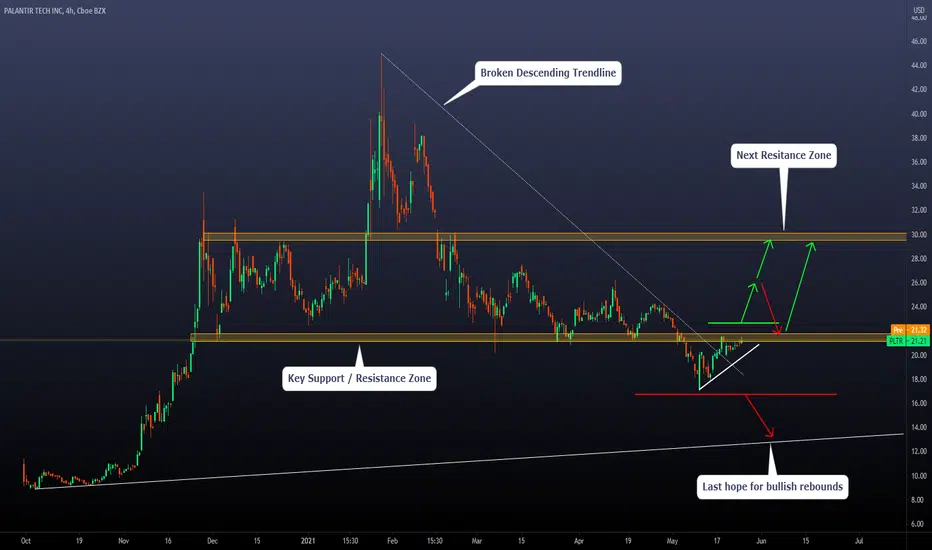
PLTR mapping the current situation. What can we expect?Today, we will take a look at the 4HS chart on PLTR
Current situation: The price is below a Massive support zone now working as a resistance. This is a key level because we can deduce major directions if the price stays above or below the key level.
Bearish Scenario: If the price reaches the red line, we can expect a continuation of the bearish movement towards the next trendline, which is not something clear but, if we have to create a possible level to see some bullish pressure, we think that would be one.
Bullish Scenario: If the price breaks the key support/resistance zone and reaches the green line, we can expect either a direct continuation of the bullish movement towards the next resistance zone OR a throwback (retest of a key level after being broken) and a continuation movement towards the next resistance zone.
Thanks for reading!
We are doing well, but the moment is complex! What to expect?Ok, PLTR did a bullish harami today, just above the 20.80, and this confirms our main idea. Now PLTR is bullish again, and it is supposed to seek the 22 one more time.
If PLTR will break this resistance we don’t know yet, but I’ll keep you guys informed about the next steps. Therefore, remember to follow me!
Right now, we may see a correction, but the 21 is a support level, as it is the 20ma area.
The 4h chart indicates that we could see PLTR breaking the 22 in the next days, and it could seek the 24 next. Meanwhile, everything is going well with PLTR, and our trades are doing just great so far.
If you liked this trading idea, remember to click on the “Follow” button to get more trading ideas like this, and if you agree with me, click on the “Agree” button 😉.
See you soon,
Melissa.

When you forget to update your trading strategies..!One of the most common problems in trading is having a single strategy!
If one strategy works for a while it is very good, but you should be ready for different markets.
We have at least 3 different types of markets! Bullish, Bearish, Correction.
If anyone tries the very same strategy during different types of markets, the result will be disastrous!
It seems ARK Invest still tries the same strategy they used in the past years. But in the past 3 months, they are more than 35% down and they keep ignoring money outflow and profit booking from their funds!
look at the result:
-1 PLTR
2- NASDAQ:VUZI
3- AMEX:ARKK
4- AMEX:ARKF
5- AMEX:ARKG
6- AMEX:ARKW
If you find these chart following the same pattern it is because:
Cathie forgot to ask Brett to update the trading algorithms!
Moshkelgosha

$PLTR Insider Selling. Should You Be Worried?Taking a look at the numbers, as well as breaking down the chart on $PLTR ! Have a great week everyone!


What to look for on PLTR next week?Ok, PLTR broke the 20.80 as the advanced breakout told us it would, but the movement was too weak, and it closed at 20.75 (it dropped even more post market).
This shows that the bulls are as weak as the bears, but there's still hope for PLTR. If it does a good bullish candlestick next Monday, and close above the 20.80 in the 30min or 4h chart, it could trigger a buy.
The 4h chart has no relevant information, other than the resistance around the 22, that we are already aware of. In my reading, if it breaks the 20.80 for good, we'll see it breaking the 22 too. I'll monitor PLTR closely next Monday!
If you liked this trading idea, remember to click on the “Follow” button to get more trading ideas like this, and if you agree with me, click on the “Agree” button 😉.
See you soon,
Melissa.

Moving according to the plan! What should we do now?As we expected, PLTR did a lateral movement today. We identified this thanks to the RSI divergence, but right now we have some hopes that PLTR will do something good next.
We nailed the purple area, and right now it has a chance to hit it again. We have an advanced breakout on the RSI, and if PLTR breaks the 20.80 it'll confirm our bullish idea.
The 4h chart shows how strong the purple area is, as it was a previous top at 22, and it is the 61.8% fibs retracement. If PLTR breaks this resistance, the 24 is the next stop for us. Let's watch the 20.80 in the 30min chart, as this will be our lead.
If you liked this trading idea, remember to click on the “Follow” button to get more trading ideas like this, and if you agree with me, click on the “Agree” button 😉.
See you soon,
Melissa.

PLRT LongWe see a bullish wedge formed, which will soon start working out. For the report for the 2nd quarter, I assume the price in the region of 30-32$
