Palantir: Successful!PLTR effectively initiated a directional change within our now-gray Target Zone, and potential long trades opened within this range should already be significantly in the black. We locate the price in the corrective movement of the green wave , which should develop through the magenta waves (A) to (E) within a pink triangle formation. Ideally, the stock should remain above the low of wave (A), which has just been settled in our Target Zone. Only after the corrective movement has concluded do we expect the transition into the green wave , which should lead the stock to new highs. A premature breakout above the $125.40 mark is possible in our alternative scenario, but it is only rated with a 33% probability.
PLTR

Opening (IRA): PLTR May 16th 90 Covered Call... for a 76.56 debit.
Comments: After taking off my iron condor for a loss, structuring a covered call such that the max profit potential is greater than the loss experienced by the nondirectional of 13.11.
Metrics:
Buying Power Effect/Break Even: 76.56
Max Profit: 13.44
ROC at Max: 17.55%
Will generally look to roll out the short call out and/or down and out at intervals to increase profit potential and/or reduce downside break even ... .

PALANTiR PLTR: $26.00 | 6 months of Accumulation is over and now the sitting begins for the Digital Fortress of the US of A
should be a nice ride towards $100 only for those who got volume ..
--
this is the only stock i own...
unloaded UBER TWTTR at $30
unloaded FB at $30..
-
time to sit tighter

PLTR if it breaks trend it will be an interesting junctureIf PLTR breaks the trend will reach 45. But at that point it
1) Fills the gap of Nov 24
2) will be 2021 high
When a (strong) trendline is broken, the market will fall equal distance or more from the trendline as from the peak to the breakpoint. I have shown multiple example on Nasdaq from the past.

$META CRASH in PROGRESS !! $600 incomingWowzers... I'm not sure what to say but ... good money is going to be made here for sure... would love to see this play out to the Tee... Take care yall ... DAILY BAR PATTERN from the Box of June 24' - Aug 24' .... I must say... let's make it happen..

10D Chart shows Falling 3 , Pullback to 3/18!! $SPYAMEX:SPY shows 10D trend very clear. It is my hidden gem. We, by my charting, Should pullback until 3/18 ... not sure how far but I have plenty of targets on the way down to my ultimate target at 5200... I think we could flush to $560.. Good Luck yall. Gems I tell ya... sorry I'm so bad at explaining things..

$SPY $SPX OLD CHART BAR PATTERN COVID CRASH NOW!!!!Holy crap.... I just came across an old chart and literally in the nick of timeI tell you. All I'm going to say is... I'm a pattern chart trader and this is the COVID bar pattern attached to our daily from like a year ago almost and I loaded up an old layout to do work and boom... here we are... Good LUCK ... Not sure what the trigger will be but we are here.

$QQQ Dead Cat to 10 WMA, then lower. Buy $496, Sell $514 What I see here is a double top on the weekly just like 2022. I can see our last 9 count in 2022 produced a 30% rally to the top. After the rally several months of sideways movement until we break trend. If we are Indeed Repeating the 2022 TOP. Then we have a harsh year ahead of us. As I said in previous posts, we should close February at the low of January. I have KRE falling out next week so I'm skeptical about what's going on. We've got DOGE checks and what not, who knows. I'm extremely bearish and I do believe we will bounce into a rejection this next week, then fall even further the week of 3/14. I will update day by day. For now, $496 will be my Buy. and $514 will be the Sell. Take Care Yall.

$SPY I know this is crazy, but $576 is my number, Call me maybe?$576 Gap fill on the way? Time will tell that's for sure. My expecation is that we sell into the beginning of March Covid style in a way. $576 seems good for right now. Will update as we go.

PLTR market favourite- price prediction based on VP $45Everybody loves PLTR and wants a bite of it. I dont love any stocks. I only love market profile tool which keeps me sane. Good news is, you maybe able to buy PLTR at 45. No, this is not me saying, I am just an interpreter of Volume profile. Act at your own risk

PALANTIR: It's a buy but don't expect a rally any time soon.Palantir is bearish on its 1D technical outlook (RSI = 41.509, MACD = -1.570, ADX = 35.869) as it's trading under the 1D MA50. The long term pattern is a Channel Up that gives a strong buy signal every time it hits its 1D MA100. As a matter of fact, the February 19th High has been a HH for the pattern and last time the price hit that top (July 31st 2023), it entered a lengthy Accumulation period. As in today, the 1D RSI was again on a similar Bearish Divergence. Consequently we believe that every 1D MA100 test is a buy opportunity, but the breakout rally will probably take another 4-5 months to happen. Aim for the 1.786 Fibonacci extension (TP = 200.00).
See how our prior idea has worked out:
## If you like our free content follow our profile to get more daily ideas. ##
## Comments and likes are greatly appreciated. ##

The Palantir of tradingA Palantir, if you did not know, is otherwise known as a crystal ball; a seeing stone. It was what Saruman used in Lord of the Rings to "see" and that ultimately led to his corruption by Sauron. I've seen this stock corrupt the career of aspiring traders...
I was asked my advice on Palantir NASDAQ:PLTR . I don't like to give "advice" on what for other traders to do... but I will say what I have done, what I am doing, and tell you a story that hopefully help traders be better.
I bought PLTR at an average price of about $9/share. Great! Not really, it was July 2022, and I bagheld all the way down to $6: a -33% unrealized loss over about a year of time. But what I had done was only purchased 200 shares. My position was relatively small; it didn't bother me. I slept just fine.
I was encouraged to buy PLTR by a good trading buddy. We would talk and trade every day for years since the pandemic. He was super bullish on this stock and I really bought it and held it in solidarity with my friend.
Then in May 2023 the stock finally took off. I had my shares and my friend traded PLTR options. However, they were short duration options. In the May - August rally he multiplied his account many times. More money than he had ever had in his young life. Things were going great. He was finally RIGHT! But then...
The stock stopped moving. Unfortunately, my friend had taken his success and tried to repeat it. Options need movement. PLTR did not move enough. He lost it all. He left our group and quit trading altogether...
...just before the August 2024 rally.
If you like the company, OWN THE SHARES
Since the pandemic I have tried my best to educate traders that the short term, gambler's mentality inherent in options is a path to disaster for the vast majority of traders. Patience. It's hard but it pays.
I still have my shares. They are up big. They are pulling back, sure. But I don't care. I was small, I have a very low buy price, and I can just wait.
Now that PLTR has moved though... inevitably people want it. Since the start of the year I've been asked repeatedly about buying it. What I tell people is that any tech or volatile stock like this WILL have AT LEAST a -50% (usually more) pullback. Be patient. I do not get interested until that happens. Even then it still may get even cheaper.
Be patient.
Trade wisely.

Opening (IRA): PLTR February 21st 62/68/94/100 Iron Condor... for a 2.16 credit.
Comments: High IVR/IV earnings announcement volatility contraction play.
Metrics:
Max Profit: 2.16
Buying Power Effect: 3.84
ROC at Max: 56.3%
50% Max: 1.08
ROC at 50% Max: 28.2%

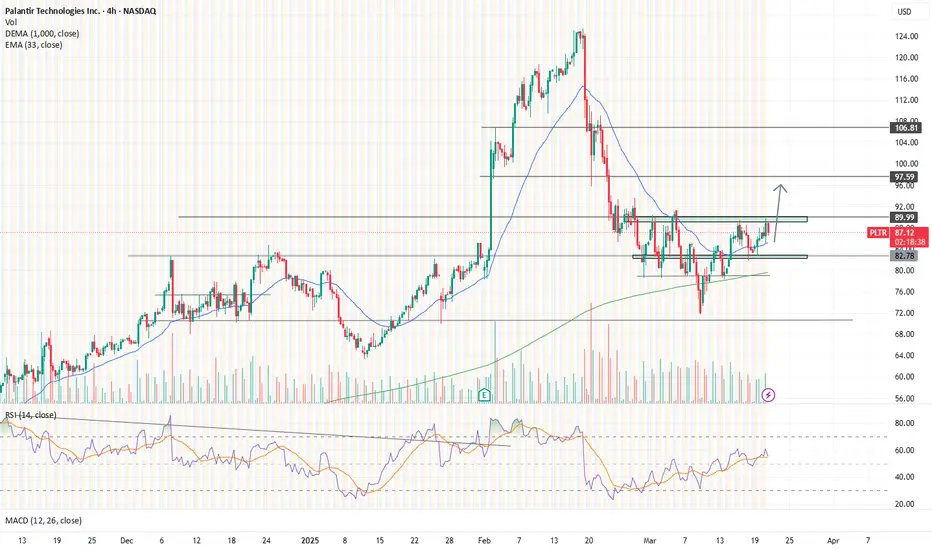
What’s Driving PLTR’s Recent Rally, and What’s Next?What’s Driving PLTR’s Recent Rally, and What’s Next?
Palantir Technologies (PLTR) has delivered a remarkable performance, surprising many investors and traders with its rapid ascent.
The stock surged from approximately $64 on December 20, 2024, to a peak of around $118 on February 11, 2025—an impressive 89% gain in less than two months.
This substantial rally raises an important question: Is PLTR at a critical turning point?
A key technical consideration is whether the stock will retrace to fill the $15 gap visible on the chart. Historically, gaps often get filled, but strong momentum can sometimes defy this pattern.
Traders and investors should closely monitor price action, volume trends, and any fundamental catalysts that could either sustain the uptrend or trigger a pullback.
As always, exercise caution and apply sound risk management strategies when trading.
📊 My chart analysis tells the story—trade wisely.

Bullish Opportunity: Palantir Technologies (PLTR) Current Price: $83.00
TP1: $90 (Analyst target)
TP2: $100 (Psychological resistance)
TP3: $120 (Upper channel target)
🚀 Why Palantir is a Bullish Opportunity
1️⃣ Strong Q4 Earnings Outlook 📊
Earnings Report Due: February 3, 2025 – Analysts expect another strong quarter.
405% Growth Over the Past Year – Palantir was the best-performing S&P 500 stock in 2024.
Wedbush Analyst Dan Ives Calls Palantir’s Q3 a "Masterpiece" – Revenue surged 30% YoY to $726M, driven by AI demand.
2️⃣ AI Leadership & Competitive Edge 🤖
AIP Named Best AI Platform by Forrester Research – Ranked ahead of Google Cloud, AWS, and Microsoft Azure.
AIP Growth Driving Revenue – U.S. commercial revenue is expanding rapidly, with unprecedented demand for AIP solutions.
Dan Ives Sees Palantir as the Next Oracle – If true, this would mean 185% upside from current valuation.
3️⃣ Institutional Confidence & Price Upgrades 💡
Wedbush Raised Price Target to $90 – Signaling continued AI-driven momentum.
Strong Hedge Fund Interest – Institutional investors remain bullish on Palantir’s AI expansion.
Market Cap Nears $185B – With 81.1% gross margins, Palantir is positioned as a high-growth AI leader.
4️⃣ Government & Commercial Expansion 📈
$400M+ Partnership with U.S. Army – Reinforcing Palantir’s role in defense & AI applications.
Strong Commercial Growth – Demand for AIP is driving both new customer conversions and existing client expansions.
The Biden Administration’s AI Push – Government spending on AI infrastructure directly benefits Palantir.
🔎 Conclusion
Palantir is positioned as a leading AI company, with institutional backing, strong earnings momentum, and government contracts fueling growth. With analyst upgrades and AI adoption surging, PLTR could see a breakout toward $100+ in the coming months.

Whole market drops but our strategy makes profitWhile the rest of the market drops our strategy delivers profitable day once again 👏
Buy Alerts were on NASDAQ:BCG NASDAQ:ESGL NASDAQ:MLGO
❌ No holding and hoping
✅ In and out at safest spots, exiting after pre-planned prices are reached 🎯
Nicely profitable day while NASDAQ:NVDA NASDAQ:TSLA NASDAQ:PLTR NASDAQ:META and even MARKETSCOM:BITCOIN end in deep red 🔻

Magnificent Seven & Hot Stocks: A Technical OverviewHello,
The past few days and weeks have brought a lot of movement in the stock market, and things seem a bit more redish than before. However, these kinds of moments also bring good opportunities—if you know where to look.
That’s why I decided to take a closer look at the some stocks from Magnificent Seven, scan some of the top market cap stocks, and give a short overview of what’s happening and what to watch.
Since technical analysis helps bring clarity in uncertain times, I will go over some key levels and liquidity zones that could present good opportunities. I will also cover a few stocks that are currently making headlines and generating a lot of interest in the investment world—such as Robinhood (HOOD) and Palantir (PLTR).
Let’s see what the market has to offer.
Microsoft (MSFT)
Microsoft has not made any major moves in the past few weeks, but selling pressure has started to build up, and the stock is now trading at its lowest levels in the past six months.
The most interesting and strongest support area is between $290 and $300. This is a level worth keeping an eye on.
--------------
Amazon (AMZN)
Yesterday, I got an alert from TradingView that AMZN has dropped into an interesting price zone after a small correction. If you don’t already use alerts, I highly recommend setting them up—keeping track of every stock manually is nearly impossible.
The $175–$210 zone is technically solid. Yes, it’s a wide range but there are different strategies you can use here.
Amazon (AMZN) – What to do?
If you don’t own AMZN yet, this could be a good spot to start building a position slowly. Buy a little in the upper part, a little in the middle, and a little in the lower part of this zone to get a balanced entry.
If you already own AMZN, I’d rather wait and aim for the middle of the range if you want to add more. If the stock takes off from here, you already have a position, so there’s no real FOMO. No need to rush.
Of course, this is just a technical view—you should still analyze the fundamentals and your investment thesis. The technicals have spoken and now it’s time to listen to the fundamentals. That way, you get the full picture and can react accordingly.
--------------
Alphabet (GOOG)
GOOG failed to break through the psychological $200 level. It has tested this level multiple times since the start of the year, but the result has been red candles.
If you already own the stock and are considering adding more, or if you are thinking about an entry, the $140–$160 zone is worth watching. At the moment, I don’t see a more logical technical entry.
--------------
Meta Platforms (META)
META has dropped 12% from its all-time high in just a few weeks. The stock has now slowly come to, what I call, a "picking zone" (if you have a better name for it, let me know! :D)—meaning a price range where those who make regular buys might want to pay attention.
Right now, the key levels to watch are ~$612 and ~$500, with $500 being the stronger level. The price has consolidated there a bit longer than around $612, and it also acts as a psychological support level.
--------------
Berkshire Hathaway (BRK.B)
Berkshire has reached what I consider a profit-taking zone. If your fingers are itching and your wallet is waiting for a top-up, then why not? This doesn’t mean selling everything, but it could be a good spot for a partial exit—especially if you need capital for something else.
Why is this a logical profit-taking point?
Looking at previous price behavior around round numbers, we can see a pattern that works every time and your money can be “stuck” for years.
When a stock approaches a big round number for the first time, it tends to:
Consolidate – move sideways for a long time.
Get a strong correction – like Berkshire has done before.
Let’s make the round number concept clearer.
Imagine a stock price starts moving up from $30 and eventually reaches $1000.
Within this range, the key round numbers for me are: $50, $100, $200, $500, and $1000. These are levels where major market reactions often occur or levels that I trust the most as a criterion.
Let’s take Berkshire for example, touching these numbers for the first time:
$50 → 50% drop, took 5 years to recover.
$100 → Another 50% drop, also took 5 years to break higher.
$200 → Multi-year consolidation, 20% drop.
$500 → And now we’re here—your choice!
In a long-term portfolio, there are essentially two types of sales:
The investment thesis is no longer valid
Capital is needed for another purpose
If neither of these conditions is met, there’s no real reason to sell. However, if you need capital within the next six months, this could be a good point to do so. Historically, we’ve seen a pattern where the stock either undergoes a correction or remains stagnant for an extended period.
That makes it a perfect candidate for profit-taking—and if a correction does happen, there’s always the opportunity to buy back at lower prices.
At the moment, buying this stock could mean it stays within this price range for a few years, so I wouldn’t rush into new purchases.
--------------
Tesla (TSLA)
Historically, Tesla has followed technical analysis well due to its high volatility. It reflects market psychology very clearly, leaving visible footprints on the chart...
-----
I also cover these topics in-depth over on my Substack channel, where I break down the full picture and share my insights on the rest. If you want the complete breakdown and my take on what’s next, head over to my Substack (ENG).
🔗 Find the link in my BIO under the Website icon or simply copy and paste it directly.
See you there! 👀
Cheers,
Vaido

$SPY $SPX Pullback to Gap Fill? I've been waiting for a rocket to AMEX:SPY $630 but my monthly tells me that February wants to close red. Here is my daily with a fib that we cant seem to hold above although today we did close above once I have been waiting patiently in this box unlike others, I have constantly reiterated, don't try to be a hero inside of the box. Now that the Box seems to be pushing towards the upside, I can't help but notice we continue printing bearish candles regardless of direction. Today we closed with a Hangman, which begs the question, could we perhaps lean bearish for two of the most bearish weeks of the year in comparison? I'd like to think I'm not wrong here and we will get a spill before anyone gets an expected blow off top. Be careful out there, volatility remains present and the VIX was above the 50DMA last time I checked. If we can get this gap fill and start moving back up, I will be confident in the gap fill being bottom. Seeing as $593 AMEX:SPY alert for bottom never filled, I will have to assume it's still a possibility. Taz out.

$PLTR 4h RSI, Vol. Bearish Divergence4H chart showing divergence and may not necessarily be a top but could be pulling back for a test of support. Watch 10DMA for potential support.

394% Biggest gainer of the day $ONVOPerfect dip buy with minimum risk before the pop back to highs for easy money 🎯
All that while the rest of the market ends the day in deep red
+17.0% realized profit on the day while NASDAQ:TSLA NASDAQ:AAPL NASDAQ:NVDA NASDAQ:PLTR and the rest of the market all 🔻

$SPY $SPX OLD CHART BAR PATTERN COVID CRASH NOW!!!!Holy crap.... I just came across an old chart and literally in the nick of timeI tell you. All I'm going to say is... I'm a pattern chart trader and this is the COVID bar pattern attached to our daily from like a year ago almost and I loaded up an old layout to do work and boom... here we are... Good LUCK ... Not sure what the trigger will be but we are here.
Tempus Ai is not done yet! 70% UpsideNASDAQ:TEM
Called the DIP, Now calling the RIP!
$115 Inbound! 🎯
- Volume Shelf
- Retesting previous highs to flip into support
- WCB Creating support and bottom
- H5 is GREEN with BUY SIGNAL
- Down on market weakness
Not financial advice
