$PLTR WILL RETEST $112-115 PIVOT POINTAn overreaction in financial markets occurs when securities are excessively overbought or oversold, driven more by psychological factors than by underlying fundamentals.
The last two-day dip was excessively sold off.
BUY NASDAQ:PLTR NOW TO GET THE DEAD CAT BOUNCE OR RESTEST OF $112-115.
From there, let's see if the market pushes NASDAQ:PLTR to $120 or higher.
Investing in Palantir Technologies Inc. ( NASDAQ:PLTR ) could be appealing for several reasons:
Strong Growth Potential: Analysts expect Palantir to experience significant business volume growth in the coming years, with high growth rates anticipated.
High Profit Margins: The company has particularly high margins before interest, taxes, depreciation, and amortization, contributing to strong profitability.
Financial Stability: Palantir has a sound financial situation, providing it with significant leeway for investment and expansion.
Positive Analyst Revisions: Over the past year, analysts have regularly revised their sales and earnings forecasts upwards, reflecting renewed optimism about the company's future performance
PLTR

Palantir (PLTR) – What’s the Play?Hi all,
I've received a lot of questions about PLTR, so here’s my take:
Initially, if it were to approach $100 for the first time, I’d have nothing to say—it would be extremely risky, especially after the strong rally we've seen in recent months. The first approach to $100 can make strong retracements.
However, after analyzing the chart about a few weeks later, we got a solid weekly close above $100, which started forming a more structured setup. Now, there's at least a decent technical case for making a decision.
The highlighted box could be a reasonable buying zone—but keep in mind, this is still risky. Technically, it's shaping up, but your fundamental conviction should be strong.
Fun fact: In my home country, a well-known investor, Investor Toomas, has added PLTR to his portfolio. While that’s an interesting signal, we don’t know his holding strategy or reaction to current market moves but still, we can take it as a small confirmation from fundamental analysis.
Final Thought: Do your own research - buy it, skip it, the choice is yours! I can confirm that technically there is at least something to consider.
Cheers,
Vaido
🚀 Stay Ahead of the Markets - Get high-quality technical analysis, real investment ideas, and key price levels—without the noise.
📩 Subscribe to my Substack for expert insights that help you trade smarter!
📱 On mobile: Just scroll down and select your preferred language.
💻 On desktop: Find the links in my BIO —copy & paste or click the Website icon to go directly to Substack ENG.

PALANTIR: PLTR Long The price will reach the marked area in short term.
My posts are not investment advises. Do your own analysis. I am not responsible for your losses.

$PLTR ready for a move (to the downside IMO)Clear squeeze setup forming at ATH after massive post-earnings momentum. Volume steadily declining over 5 days with significant volatility contraction. BB-KC squeeze (green bands compressing within Keltner) typically precedes major directional move.
Bearish thesis:
- Overbought conditions
- Volume decline
- Multiple timeframe squeeze potential
- Rich valuations
Trade plan if bearish break:
- Call credit spread above ATH wick
- Leveraged inverse ETF position
- Entries on volume confirmation + EMA breaks
- Stops: Above EMAs (if broken) or ATH (if holding)
Watching 4H/1D charts for squeeze alignment. Key trigger = strong red candle + volume spike.
⚠️ Risk management is critical here. Despite bearish setup, never underestimate bull market psychology on momentum names.
Position size accordingly. No trade is guaranteed.
#Trading #TechnicalAnalysis #PLTR
(Not financial advice - DYOR)

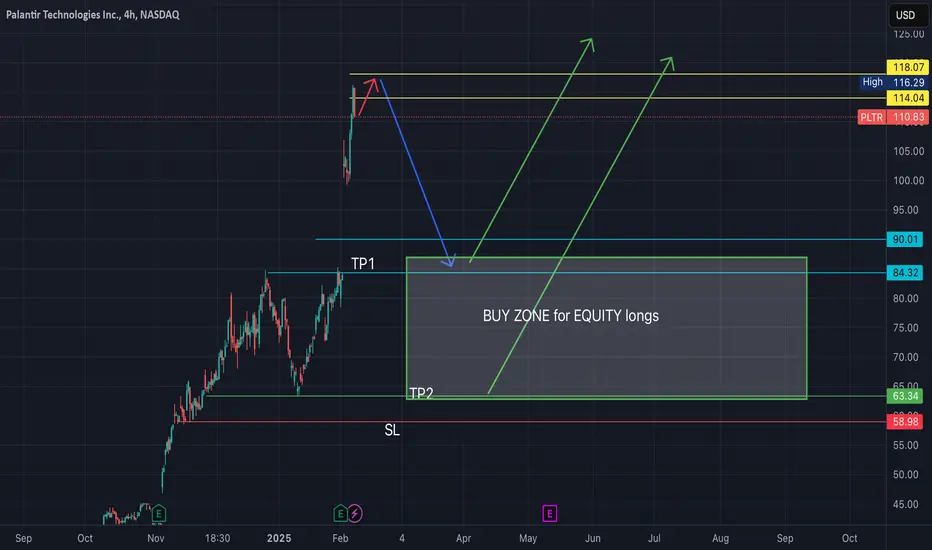
PLTR -- more volatility forecasted into MarchExpecting quick progression to 118$ level as final buy-side wave near term.
Looking for renewed significant selling action from that level to retrace price back to pre-earnings levels near 80-85$
Possibility exists (imho) that we fully retrace back to 63-64$ levels by April timeframe, depending on sentiment as we head into next FOMC meeting in mid-March.
After that, my cycles analysis indicates we will continue higher toward 120...Therefore, I will be planning on taking profits on put option contracts once underlying share price reaches below 85$, and will plan on scaling into long equity positions on discounts between 64-85$ for the projected subsequent buy wave to 120+
$QTUM Maybe Trying to break out of This Wedge (VCP)I have been long this name for a few months now in my investment account. I have added more today with a stop on the added position size just below today’s low. There are some very big names in this ETF, it invests in AI learning as well as Quantum Computing.
It looks to me to be in a Volatility Contraction Pattern (VCP), more popularly called a wedging pattern. I went long more shares as indicated above in anticipation of a break above the declining upper trendline. It also is supported by both the 8 and 20 EMAs and has consolidated to get more inline with the 50 DMA (red).
If you like it, make the trade your own and make sure it fits your trading plan.
Look at the fund holdings in “More About Fund” link supplied by TradingView. Here are some of the names you might recognize: NASDAQ:KLAC NYSE:IBM NASDAQ:PLTR NYSE:RTX NYSE:BABA
From Defiance ETF Website:
QTUM
Index Description: The BlueStar® Machine Learning and Quantum Computing Index (BQTUM) tracks liquid companies in the global quantum computing and machine learning industries, including products and services related to quantum computing or machine learning, such as the development or use of quantum computers or computing chips, superconducting materials, applications built on quantum computers, embedded artificial intelligence chips, or software specializing in the perception, collection, visualization, or management of big data.

Your Most Requested Stocks Are Here - 15 Stocks, 15 Analyses!Hello readers,
Just a few days ago, I ran a "poll" - huge thanks to everyone who participated in the comments! The response was amazing: 130 mentions, 80 different stocks, and 15 tickers that stood out with multiple mentions. Stay tuned as I break down the most requested ones!
I initially planned to let this run longer, but interest has cooled off a bit, so I’ve decided to wrap it up and start summarizing the results so you can analyze them through the weekend.
Now, let’s get to it:
✅ A technical breakdown of 15 stocks.
✅ Key price levels and volatility zones to watch.
✅ Possible scenarios and setups based on the charts.
Some charts tell a clear story, while others… well, let’s just say not all price action is tradable and I’ll explain why.
Which stocks made the list? Scroll down and let’s dive in!
15. Microsoft (MSFT)
Looking at Microsoft's price movements, I wouldn’t rush into a position just yet. The stock has been stuck in this price zone for more than a year. While buying at the current levels could work out, there is also a risk that it remains in this range for another year.
Instead, I see two scenarios that offer a better approach:
1. This scenario relies on waiting for a pullback. A better price = better future returns. If the price drops to $290–$355/360, I would be ready to buy. Lower price levels often offer new liquidity, providing stronger momentum in the years ahead.
2. Wait for confirmation instead of guessing. Let the market show that investors are willing to push MSFT to higher levels before entering. Over the past year, the price action has established a resistance zone at $450–$460. A monthly close above this level would provide confirmation. However, patience is still key because the round number $500 could act as an obstacle. After a breakout, you have another two options:
Buy immediately after the breakout is confirmed - monthly close needed - or wait for a rejection from $500 before entering. This could provide an opportunity to buy at a similar price but with more confirmation and a stronger support level. This approach increases the chances that investment starts working more efficiently and from a better technical position.
14. Robinhood Markets (HOOD)
There isn’t much to say, the stock is flying. However, to add an educational perspective, these small pauses in the movement can create liquidity zones after a pullback.
If the stock pulls back and you find yourself wondering “Where is the right spot to enter?”, these pause areas provide potential opportunities. While this isn’t necessarily a setup, using these pullbacks effectively can help scale up your position in the stock or initiate a new one.
Many traders hesitate, thinking, "It's too expensive, it's too expensive," suddenly the price pulls back to a pause area. When that happens, you already know what to do - set your alerts.
13. Salesforce (CRM)
Confirmed Breakout:
We have three clean previous yearly highs - we mark them.
As investors, not traders, we focus on the strongest zone - we connect them.
Within this zone, there is a minor round number at $300, and for me, the strongest retest area is currently at $270–$300.
This level could serve as a key support zone for potential future entries.
12. Intel Corporation (INTC)
This is quite a difficult chart with poor price action, making it challenging to navigate. Personally, I wouldn’t take any action until one of these two scenarios becomes valid.
Deeper pullback for liquidity – The drop has been strong and intense and we could see lower prices as in 1996. A move below the current support level could attract new liquidity and hopefully, make the stock more attractive to investors.
Break above the strongest resistance – This scenario is highly time-consuming. Right now, the stock is trading below a major resistance area, and recovering won’t be easy, especially after such a sharp drop from a 2023 positive price trend. A break above $28 would make it more attractive for me.
For those already holding INTC, selling could be a strategic move. You could potentially buy back at lower prices, reducing the risk of having your investment stuck for several years. Given the current price action, breaking back above resistance will be a difficult battle - there are much better opportunities.
11. Novo Nordisk (NOVO_B)
I mentioned this stock on TradingView a few months ago, as well as at a financial conference in Estonia. The price has moved a bit but here is the initial technical thesis:
The key area remains 500–600 DKK, with the following criteria:
- A small pause in price movement, similar to what I discussed in the HOOD analysis.
- 50% retracement from the all-time high—for large-gap stocks, this level can offer strong volatility, if the fundamentals, in general, remain stable.
- The round number at 500 DKK, which could act as a psychological support level.
10. Coinbase (COIN)
A year and a half ago, I posted an analysis on TradingView about COIN, currently up almost 300% , highlighting an Inverted Head and Shoulders pattern. That pattern is also present today but on a much larger scale. Hopefully, history repeats itself and the outcome will be the same ;)
Currently, we have a massive Inverted Head and Shoulders pattern. This pattern becomes valid only after a breakout from the neckline. Which has already happened! The price has also tested the neckline, but the movement has remained limited due to the strong resistance zone at $260–$290. Despite this, there has been a minor breakout above this level and from a technical standpoint, the price is currently trading within a potential buying zone for those interested.
Key criteria:
- A bullish Inverted Head and Shoulders pattern is in place.
- The neckline breakout has already occurred.
- A minor breakout above the strong $260–$290 zone suggests further potential.
9. Meta Platforms (META)
"Pause areas" – If someone randomly picks stocks each month, for example, Apple this month, Amazon or Meta next month, then these price levels can be extremely useful for deciding what to buy.
For META, the key picking areas are marked on the chart as reference points for potential pickers:
8. NIO (NIO)
Mentioned three times, and I feel sorry for those expecting a useful analysis on NIO - I don’t have one. Technically, there is nothing to work with here.
The price action is basically dead, moving randomly without any clear structure. Yes, I could draw lines and mark support levels but that would be misleading for both - you and me.
Volume has dropped significantly compared to previous movements. When volume declines this much, previous price levels become irrelevant. As I mentioned at the beginning, if there’s something to analyze, I’ll share it. Right now, there isn’t.
-------------
Closing Section (For TradingView Post), that wraps up the first eight stocks from the picks! I hope you found this analysis valuable but that's not all!
The remaining 7 stocks are now live on my Substack-ENG, including:
🔹 Tesla (TSLA) – Will history repeat itself?
🔹 Amazon (AMZN) – Smart entry levels instead of buying at all-time highs.
🔹 Palantir (PLTR) – The high-risk, high-reward case.
…and four more stocks that were highly requested!
Substack-ENG link is in my BIO (clicking the website icon), or you can find it by scrolling up - just below the main image.
See you there,
Vaido
Disclaimer:
This post is not investment advice, and the ideas presented are not recommendations to buy or sell any securities. It is intended for educational and analytical purposes, reflecting my personal view of the current market situation. Every investor should conduct their own independent analysis and consider the risks before making any decisions.

The Next Palantir is Snowflake! 183% UpsideNYSE:SNOW : The next NASDAQ:PLTR
Snowflake is breaking out of the same monthly setup as Palantir did before they rocketed higher!
Measured Move: $470 🎯
Data is King and The King of data is NYSE:SNOW
A 3x from here to catchup to Palantir Mkt Cap!
NASDAQ:PLTR Monthly Chart Comparison:
Not financial advice

Palantir Technologies Inc. (PLTR) Stock AnalysisPalantir Technologies Inc. (PLTR) has recently demonstrated strong financial performance, leading to a significant surge in its stock price. The stock currently trades at $103.32, reflecting a 22% increase, reaching an all-time high of $106.91.
Recent Financial Performance
In Q4 2024, Palantir reported revenue of $828 million, marking a 36% year-over-year increase and surpassing analyst expectations of $776 million. Adjusted earnings per share (EPS) increased by 75% to $0.14, beating the estimated $0.11 EPS. The company’s 2025 revenue outlook is highly optimistic, forecasting between $3.741 billion and $3.757 billion, well above the market’s expectations of $3.503 billion. For Q1 2025, Palantir expects revenue between $858 million and $862 million, again exceeding analysts' estimates of $799 million.
Analyst Ratings & Market Sentiment
Investment firms have taken note of Palantir's impressive performance:
Morgan Stanley upgraded its rating from "underweight" to "equal weight", raising its price target from $60 to $95, acknowledging the company’s strong AI-driven growth and optimistic outlook.
Wedbush Securities' Dan Ives increased the price target to $120, citing Palantir’s dominant position in the AI market and its continued expansion in both government and commercial sectors.
Stock Performance & Outlook
Palantir’s stock price has seen a sharp rise, fueled by strong AI-related growth, increased government contracts, and expanding enterprise adoption. The stock’s 22% surge reflects investor confidence, but some analysts remain cautious due to valuation concerns.
Conclusion
Palantir's strong earnings, aggressive revenue growth, and increasing adoption of its AI-driven platforms make it a promising investment opportunity. However, potential risks include high valuation and market volatility. Investors should conduct further research to assess whether Palantir fits their portfolio strategy.

PLTR stock: do you have the patience for 700% gain in a decade?Do you even patience bro?
do you have the patience to wait 10 years to let a stock work for you?
what if you were staring at a huge gain in your account? could avoid the urge to sell?
#peterlynch #growthstocks

Opening (IRA): PLTR Feb 28th 70/75/100/105 Iron Condor... for a 2.11 credit.
Comments: High IVR/IV at 89.1/81.3. Adding to my PLTR position as an earnings announcement volatility contraction play.
Metrics:
Max Profit: 2.11
Buying Power Effect: 2.89
ROC at Max: 73.01%
50% Max: 1.06
ROC at 50% Max: 36.51%
Will generally look to take profit at 50% max, immediately roll out to March if a side is tested.

Journal of exit decision on PLTR stock. PLTR’s revenue grew 29% year-over-year, and Alex projects 30% year-over-year growth in 2025. Shares jumped 25% premarket after earnings. I sold at $60 per share in Nov 2024 because Alex sold a significant amount of his shares after the Q3 earnings around that price. I assumed he believed the company was overvalued and used that as a gauge to exit.
However, this was not the best approach since I didn't research whether he was selling for liquidity reasons or due to fundamental/informational purposes. Going forward, I will only sell a portion of my shares in great companies if they seem to be trading at a huge premium and will carefully consider the reasons why the management team is selling.
Lessons:
Don't sell the entire position at once if the company is great and projected to grow. If you feel the need to sell due to high valuation of because of huge profits, then sell half of the position and do this over the course of 1-3 months. Chances are the company can grow during that time and your exit can capture more upside if that happens. In short, this may help get a better exit price.
Consider the reasons why mgmt are selling shares before making a decision to act on that.
Consider why the premium is so high, ask yourself if those reason are valid and still exist and look at the annual rev growth rate and margins of the business. If the company is at a premium this growth rate should remain in play.

PALANTIR Target $110 then wait for correction.Palantir Technologies (PLTR) is repeating the January pattern that has been seen in both 2024 and 2023, which has the price rising by +72.50% for a peak. This gives us a $110 immediate Target, which should be relatively easy to achieve after such Earnings.
Once the peaked on this mark, the 2024/ 2023 fractals pulled back to the 0.618 Fibonacci retracement level before turning into a long-term buy opportunity again in preparation for the next Bullish Leg. As a result, after $110 is hit, our next buy level will be near $80.
-------------------------------------------------------------------------------
** Please LIKE 👍, FOLLOW ✅, SHARE 🙌 and COMMENT ✍ if you enjoy this idea! Also share your ideas and charts in the comments section below! This is best way to keep it relevant, support us, keep the content here free and allow the idea to reach as many people as possible. **
-------------------------------------------------------------------------------
💸💸💸💸💸💸
👇 👇 👇 👇 👇 👇

Markets stabilize... for now. After another manic Monday pre-morning selloff, markets have found support. But for how long? Will the markets stabilize from here and move higher. Or does the atmosphere worsen slowly and markets selloff further? Only time (and Trump) will tell.

Palantir (NASDAQ: $PLTR) Soars 22% After Earnings BeatPalantir Technologies Inc. (NASDAQ: NASDAQ:PLTR ) has stunned the market once again, with its stock surging as much as 22% in extended trading following a blowout Q4 earnings report. The company not only exceeded analyst expectations but also provided an optimistic revenue outlook for 2025, further cementing its position as a dominant player in artificial intelligence and defense technology.
Strong Earnings and AI-Powered Growth
Palantir’s Q4 revenue came in at $828 million, significantly surpassing the estimated $776 million and reflecting a 36% year-over-year (YoY) growth from $608.4 million. The company also reported an adjusted earnings per share (EPS) of 14 cents, outperforming the expected 11 cents. Furthermore, adjusted income from operations stood at **$373 million**, representing an impressive **45% margin**.
These robust financial results were driven by increased demand for Palantir’s AI-powered software, particularly within its U.S. commercial and government sectors.
- U.S. Commercial Revenue: Up 64% YoY to $214 million.
- U.S. Government Revenue: Up 45% YoY to $343 million.
CEO Alex Karp highlighted Palantir’s early entry into the AI landscape, stating that the company’s vision for large language models has transitioned from theoretical to commercial reality. With AI adoption growing rapidly, Palantir’s position in the space continues to strengthen.
The company raised its Q1 2025 revenue forecast to between $858 million and $862 million, significantly above analysts’ estimates of $799 million. Additionally, Palantir now expects full-year revenue between $3.74 billion and $3.76 billion, outpacing the consensus projection of $3.52 billion.
Technical Analysis:
Palantir’s stock closed Monday’s extended session with a notable 22% surge, setting up a potential bullish momentum. As of Tuesday’s premarket trading, NASDAQ:PLTR was up 19%, signaling continued investor enthusiasm.
- Relative Strength Index (RSI): 65.49, indicating strong bullish momentum, though approaching overbought levels.
- Support Level: Immediate support lies at $77, aligning with the 38.2% Fibonacci retracement level. A drop to this level could present a buying opportunity.
- Resistance Level: A breakout above $97 could propel the stock toward $120, aligning with Palantir’s upward trajectory and bullish sentiment in AI stocks.
An important factor to note is the formation of an upside gap, which is a bullish signal but could eventually be filled over time. However, given Palantir’s strong fundamentals, the short-term technical outlook remains positive.
Analyst Upgrades: Bullish Targets Ahead
Several analysts have revised their price targets for Palantir following its strong earnings:
- BofA Securities raised its price target from $75 to $90, maintaining a Buy rating.
- DA Davidson increased its target from $47 to $105, while keeping a Neutral stance.
- Wedbush Securities’ Dan Ives compared Palantir to Oracle, predicting it could reach a trillion-dollar market cap in the coming years.
Conclusion:
With a massive earnings beat, strong revenue outlook, and AI-driven expansion, Palantir has reinforced its position as a market leader. Technically, the stock is experiencing a bullish breakout, and analysts remain optimistic about its long-term prospects. However, traders should be mindful of potential short-term pullbacks due to the recent gap-up in price.

Can AI Revolutionize Our World Beyond Data?Palantir Technologies has not merely emerged but soared in the financial markets, with shares rocketing 22% after an earnings report that surprised Wall Street. The company's fourth-quarter results for 2024 were a testament to its strategic placement at the heart of the AI revolution, exceeding expectations with revenue and earnings per share. This performance underscores the potential of AI not only to enhance but potentially redefine operational paradigms across industries, particularly in defense and governmental sectors where Palantir holds significant sway.
The growth trajectory of Palantir is not just a story of numbers; it's a narrative of how AI can be harnessed to transform complex data into actionable insights, thereby driving efficiency and innovation. CEO Alex Karp's vision of Palantir as a software juggernaut at the inception of a long-term revolution invites us to ponder the broader implications of AI. With a 64% growth in U.S. commercial revenue and a 45% increase in U.S. government revenue, Palantir demonstrates the power of AI to bridge the gap between raw data and strategic decision-making in real-world applications.
Yet, this success story also prompts critical reflection. How sustainable is this growth, especially considering Palantir's heavy reliance on government contracts? The company's future might hinge on its ability to diversify its clientele and continue innovating in a rapidly evolving tech landscape. As we stand at what Karp describes as the "beginning of the first act" of AI's influence, one must ask: Can Palantir maintain its momentum, or will it face challenges in a market increasingly crowded with AI contenders? This question challenges investors, technologists, and policymakers alike to consider the long-term trajectory of AI integration in our society.

Strategy 2025. Introducing Palantir, BTC Killer Of The Year 2024It's gone 3 months or so since Palantir stock has joined on Friday, September 20 Stock Top Club, also known as S&P 500 stock index SP:SPX .
Palantir was one of the strongest contenders for inclusion in the broad market S&P500 Index.
This inclusion, as well as Dell (DELL), came after tech companies Super Micro (SMCI) and Crowdstrike (CRWD) also joined the index earlier in this year 2024.
Since that, Palantir stock became the best (i.e. #1) S&P500 index performer this year, with current +375% YTD return in 2024, being highlighted at 80.55 USD per share - the new all the history peak reached last Friday, December, 19 at regular session close.
What is most important also, even recent Federal Reserve (The US Central Bank) hawkish projections on monetary policy in 2025 were not able to stop the only game in the city, or even make a pause on Palantir leadership.
Since Palantir stock is rallying 7th month in a row, the stalkers remain decently far away, swallowing the galactic dust of Palantir shares.
Judge for yourself.
One of the nearest pursuer, Nvidia Corporation NASDAQ:NVDA (# 4 out of all S&P500 index performers in 2024) is nearly to finish the year of 2024 with +170% return, i.e. lagging against Palantir behind twice.
The quite similar things happen with the most popular and heavy c-coin, also known as Bitcoin BITSTAMP:BTCUSD that is currently +130% YTD return in 2024.
What is most important also, Palantir stock outperforms both - S&P500 index, Nvidia Corp. and Bitcoin 7th straight month in a row.
In human words that means, Palantir stock monthly returns (every single month from May to December 2024) were better against each of mentioned above assets.
What is Behind this?
On November 4, 2024 Palantir Technologies has announced financial results for the third quarter ended September 30, 2024.
“We absolutely eviscerated this quarter, driven by unrelenting AI demand that won’t slow down. This is a U.S.-driven AI revolution that has taken full hold. The world will be divided between AI haves and have-nots. At Palantir, we plan to power the winners,” said Alexander C. Karp, Co-Founder and Chief Executive Officer of Palantir Technologies Inc.
Q3 2024 Highlights
• U.S. revenue grew 44% year-over-year and 14% quarter-over-quarter to $499 million
• U.S. commercial revenue grew 54% year-over-year and 13% quarter-over-quarter to $179 million
• U.S. government revenue grew 40% year-over-year and 15% quarter-over-quarter to $320 million
• Revenue grew 30% year-over-year and 7% quarter-over-quarter to $726 million
• Closed 104 deals over $1 million
• Customer count grew 39% year-over-year and 6% quarter-over-quarter
• GAAP net income of $144 million, representing a 20% margin
• GAAP income from operations of $113 million, representing a 16% margin
• Adjusted income from operations of $276 million, representing a 38% margin
• Rule of 40 score of 68%
• GAAP earnings per share (“EPS”) grew 100% year-over-year to $0.06
• Adjusted EPS grew 43% year-over-year to $0.10
• Cash, cash equivalents, and short-term U.S. Treasury securities of $4.6 billion
• Cash from operations of $420 million, representing a 58% margin and $995 million on a trailing twelve month basis
• Adjusted free cash flow of $435 million, representing a 60% margin and over $1 billion on a trailing twelve month basis.
Is the stock growth fundamentally deserved? Definitely, "Yes".
Palantir stock Alpha
What is Alpha?
Alpha (a) is a term used in investing to describe an investment's ability to beat (outperform) the market, or its “edge.” Alpha is thus also often referred to as excess return or the abnormal rate of return in relation to a benchmark, or any other asset (even against simple sitting in a cash) when adjusted for risk.
The main graph represents a comparison across Bitcoin and Palantir stocks. Since Palantir outperforms BTC twice over the past 12 months (watch lower "percent bar chart" subgraph), so why isn't to continue the play, by staying in a long with Palantir, and kill "the new oranges" respectively.

Palantir: Get ready for earnings tomorrow!NASDAQ:PLTR earnings are on Monday
EPS: .11c
Rev.: 776M
I believe if they come in with 35% or higher revenue growth we will see George Washington!
If we see less than 30% growth, we will see $50's
What say you?!
Not financial advice

$PLTR - As I said: On a warpath to $100!NASDAQ:PLTR
Up 5% since I posted the original setup! 😉
$85 inbound!! 🎯
Not financial advice

$BBAI - No hibernation for this BEAR!NYSE:BBAI
The next parabolic AI name?!
NASDAQ:TEM NASDAQ:SOUN NASDAQ:PLTR 2.0
Breakout = 🎯$5.20🎯$6.75🎯$8.80
Not financial advice

SPX new all time high. GE ripping today. GOLD, OIL, NGSPX puts in new all time high yesterday tags 6100$!! GE beats earnings this morning. NFLX rips higher yesterday as earnings blowout. ORCL, MSFT, PLTR all move higher due to TRUMP Stargate program news. Will the markets continue higher or sell off this week??? GOLD, OIL, NATGAS all making moves.

Palantir - 30% Earnings move Inbound?!NASDAQ:PLTR
Are they gearing up for another big earnings move or will the expectations be too high?!
A breakout of this bull flag sends them higher!
🎯$85 🎯$95
Not financial advice

PLTR BULLISH REVERSALPrice -25% correction, Failed breakdonw the previous ATH 64 resistance now support.
Can be interesting seen the price above the 70 and holdign for a swing trade coming the market momentum
