Can Gold Break 1979?Holding a buy from the resistance of 78-79. Im looking at EMA200 as 1Hr candles have closed above.
Again using kill zones in my strategy now. Waiting for more news at 3:30pm on USD pairs
PMI

Daily Market Analysis - THURSDAY JULY 06, 2023Key News:
USA - ADP Nonfarm Employment Change (Jun)
USA - Initial Jobless Claims
USA - Services PMI (Jun)
USA - ISM Non-Manufacturing PMI (Jun)
USA - JOLTs Job Openings (May)
USA - Crude Oil Inventories
During Wednesday's trading session, the Dow Jones Industrial Average concluded the day with a decline, driven by the release of the Federal Reserve's meeting minutes for June. The minutes indicated a growing interest among policymakers in resuming interest rate hikes. However, in the tech sector, major players showcased mostly positive performance. Notably, Meta (formerly known as Facebook) soared to a 52-week high as anticipation mounted for its upcoming Twitter competitor.
Specifically, the Dow Jones Industrial Average recorded a decrease of 0.38%, translating to a decline of 129 points. Similarly, both the Nasdaq and the S&P 500 experienced a modest 0.2% decrease during the trading session.
Dow Jones Industrial Average Index daily chart
The release of the Federal Reserve's meeting minutes from June, which occurred on Wednesday, shed light on the members' sentiment regarding future rate hikes. The minutes revealed that a significant majority of the members, described as "almost all," expressed support for the notion of resuming rate hikes. This position was motivated by concerns about persistently high inflation levels, which were deemed "unacceptably high."
Furthermore, the minutes indicated a hawkish stance among some members, with a preference for raising rates rather than pausing during the June meeting. These members highlighted their worries about a tight labor market, recognizing that such conditions could potentially drive up wages and inflation even further.
However, while the discussion expressed a general inclination towards resuming rate hikes, the decision to implement such actions in July will largely depend on upcoming data. Pantheon Macroeconomics suggests that the forthcoming data expected to be released this week and next will play a crucial role in shaping the Fed's decision-making process.
It is worth noting that approximately 90% of traders, as indicated by the Fed Rate Monitor Tool, anticipate that the Federal Reserve will indeed resume rate hikes in July.
Effective Fed Funds Rate
Investor concerns regarding a potential global economic slowdown were heightened due to underwhelming services data from China. However, the impact of these concerns on the broader market was somewhat mitigated by the strong performance of prominent technology companies. Notably, Meta (previously known as Facebook) experienced a significant surge of over 3%, reaching 52-week highs. This impressive performance came ahead of the launch of Meta's rival Twitter app, Threads, scheduled for Thursday. It is noteworthy that Twitter had recently announced its decision to temporarily restrict the number of posts users can read on its platform.
Meta Platforms stocks daily chart
Despite Apple's 0.6% decline, the company's market capitalization remains above $3 trillion, demonstrating its significant value in the market. In contrast, Microsoft experienced a slight increase in its stock price. Wedbush, a prominent research firm, predicts that Microsoft will also join the exclusive $3 trillion club alongside Apple by early 2024. This projection is based on the belief that advancements in artificial intelligence (AI) will be a major driver of Microsoft's growth and valuation. Wedbush noted in a statement on Wednesday that, considering the potential of AI and through a sum-of-the-parts valuation, Microsoft's overall value should propel it to the esteemed $3 trillion club within the next few years.
Microsoft stock daily chart
During the US Independence Day holiday, major currencies displayed a noticeable trend of trading within narrow ranges in relation to the US dollar. Among the G10 currencies, the New Zealand dollar (NZD) emerged as the top performer. This could be attributed to the unwinding of long positions in the Australian dollar/New Zealand dollar (AUD/NZD) pair, which likely contributed to the NZD's relative strength in the market.
AUD/NZD daily chart
Throughout this week, European markets have faced consistent declines, with yesterday's losses being notably significant. The downward trend in the markets is expected to persist today.
The market weakness witnessed yesterday was primarily fueled by concerns surrounding disappointing services Purchasing Managers' Index (PMI) data from both China and Europe. These underwhelming data releases have heightened worries about a potential global economic slowdown. Furthermore, the increasing risks related to interest rates have contributed to weakness in sectors such as basic resources, energy, and financials, amplifying the overall market downturn. These negative sentiments have had a spill-over effect on Asian markets as well, reflecting the widespread concerns about the global economic landscape.
Employed Usually Works Full time Chart
US Employed Persons status
Today's highly anticipated release of the ADP payrolls report is expected to show a robust figure of 225,000, slightly lower than the previous month's 278,000. Despite this slight decrease, it is important to note that the current level of job vacancies suggests that we are unlikely to see a weak jobs report in the upcoming months. Consequently, it is less probable that the labor market will serve as the catalyst for the Federal Reserve to signal a pause in its policies in the near future.
US Purchasing Managers Index (ISM)
The Federal Reserve has expressed concerns regarding the persistence of services inflation, highlighting its potential impact on the economy. Today's ISM services report is anticipated to reveal a modest uptick in headline activity, reaching around 51.3. However, special attention will be given to the prices paid component, which experienced a decline to 56.2 in May, marking a three-year low. This data will provide insights into the pricing pressures faced by service providers.
As for Independence Day, please note that trading hours may be affected due to the holiday in the United States.
The Unemployment Rate is a key economic indicator that measures the percentage of the labor force that is unemployed and actively seeking employment. It provides insights into the health of the labor market and is closely monitored by economists, policymakers, and market participants.

EURJPY ShortSelling EJ, Looks like a rejection of that strong resistance level ive mapped on my chart. With the Yen weakening, Im looking to short.
News today 2:45 PMI and 3:00 PMI to watch.

Gold Break The 1900's?With golds fall over the recent days, its clear to see its in a bearish channel. Im looking to sell now and target 1900, 1885 in the mid term.
Price below 1910 will cause an impulse to 1900, Sell entered at 1912, let the melt begin...

GBPCAD Will Move Higher?Aiming for a previous HH. will wait for confirmation of a rejection of daily support, and enter on a long.

Will Gold See 1958?Im longing gold from 1942 area. Its looking like a rejection at the 40 level, I believe gold will see a push back up to 1958 and beyond in time.

EURUSD | HIGHER PROBABILITY TO RISE TODAYPrice fell last Friday due to non-farm payroll results at noon to around 1.07000. Balance of Trade for Germany (Apr) is set to release in 30 mins and might push the price lower to the last order-block.
In 2hrs also, PMI is set to release with a consensus that is higher than 50. I expect the price to fall to around 1.06750 and rise to around 1.07400 before falling back again.
Let's hope for the best....

NQ Power Range Report with FIB Ext - 6/5/2023 SessionCME_MINI:NQM2023
- PR High: 14584.25
- PR Low: 14556.25
- NZ Spread: 62.5
Economic Events:
09:45 – Services PMI
10:00 – ISM Non-Manufacturing PMI
Relatively small weekend gap down.
- Yet to be filled
- Didn't take long to break into PR bear zone.
- Low volume to start Monday session.
Evening Stats (As of 12:15 AM)
- Weekend Gap: -0.08% (open > 14586)
- Session Open ATR: 207.47
- Volume: 28K
- Open Int: 286K
- Trend Grade: Neutral
- From ATH: -13.3% (Rounded)
Key Levels (Rounded - Think of these as ranges)
- Long: 14675
- Mid: 14103
- Short: 31531
Keep in mind this is not speculation or a prediction. Only a report of the Power Range with Fib extensions for target hunting. Do your DD! You determine your risk tolerance. You are fully capable of making your own decisions.

$QQQ Outlook 05/30 - 06/02The tech sector is on a tear. NASDAQ:NVDA earnings set the tone last week and the AI craze is on. NASDAQ:QQQ had a bullish week, closing up +3.53%, bringing it up +8.76% on the month. Strong earnings, job cuts, and developments in AI technology has sent the sector higher.
Technical Analysis: The last two weeks saw NASDAQ:QQQ break out of the rising wedge we were watching. Last week’s high signaled a test of a bullish channel. This channel uses the same uptrend support line we’ve been watching since the beginning of March. We are looking to see if this continues higher, or if the channel resistance is respected.
My general lean for this week is bullish, although after last week’s incredible run, I do expect a bit of a retrace before we head higher. A healthy pullback is due so we can continue to move up this channel. I would be bullish if price action can continue to hold above last week’s close of 348.40.
Bear case if we can break below last week’s open at 336.25. I’d expect a bounce here as it is in the golden pocket (0.618 retrace would be 337.08), but if we cannot hold this level, we could target the gap to fill below down to 332.91 which would invalidate the golden pocket.
Upside Targets: 348.40 → 349.25 → 350.72 → 352.46 → 354.43 Extended: 356.78
Downside Targets: 346.38 → 344.57 → 341.31 → 338.19 → 336.25 Extended: 334.35

$SPY Outlook 05/30 - 06/02With a tentative agreement to raise the debt ceiling reached over the weekend, we now look to see how the markets react when it is voted on later this week.
Technical Analysis: The megaphone pattern we’ve been watching all month is still in play. We also have the macro uptrend line that we have not tested since March.
My general lean for this week is bullish. Bulls will want AMEX:SPY to hold above last week’s open at 418.64. Barring any additional news, I’m expecting us to fill the gap above to 420.77 - 421.22 when markets open on Tuesday. I do see a 15 minute Fair Value Gap around last week’s open at 418.64 where we could potentially form a support base before we head higher into the 423-425 range.
Although I can see the market moving higher in the short term, I’d expect some corrective action in the coming weeks.
Bear case if we fail to hold the 418.64 level, we could potentially retrace to the 0.618 fib at 414.04. Should we invalidate a golden pocket bounce, our next support zone would be the daily gap under the 50 SMA from 409.87- 407.27.
Under this… megaphone plays out and we test the macro support trendline.
Upside Targets: 420.77 → 421.22 → 421.97 → 422.82 → 423.54 Extended: 425.26
Downside Targets: 418.64 → 417.30 → 416.25 → 414.94 → 414.15 Extended: 408.87

EURUSD Weekly Forecast | 22nd May 2023Fundamental Backdrop
This week watch out for notably the German Flash Manufacturing PMI and Flash Services PMI.
The German Flash Services PMI is expected to drop from 56 to 55. This can cause the EUR to weaken further
Technical Confluences
Resistance at 1.09900
Near-term support at 1.07550
Major support at 1.05340
Idea
We could possibly see price continue it's bearish momentum from last week into this week and head towards the major support at 1.05340.
NOT FINANCIAL ADVICE DISCLAIMER
The trading related ideas posted by OlympusLabs are for educational and informational purposes only and should not be considered as financial advice. Trading in financial markets involves a high degree of risk, and individuals should carefully consider their investment objectives, financial situation, and risk tolerance before making any trading decisions based on our ideas.
We are not a licensed financial advisor or professional, and the information we are providing is based on our personal experience and research. We make no guarantees or promises regarding the accuracy, completeness, or reliability of the information provided, and users should do their own research and analysis before making any trades.
Users should be aware that trading involves significant risk, and there is no guarantee of profit. Any trading strategy may result in losses, and individuals should be prepared to accept those risks.
OlympusLabs and its affiliates are not responsible for any losses or damages that may result from the use of our trading related ideas or the information provided on our platform. Users should seek the advice of a licensed financial advisor or professional if they have any doubts or concerns about their investment strategies.

DXY Weekly Forecast | 22nd May 2023Fundamental Backdrop
The Flash Manufacturing PMI is expected to decrease from 50.2 to 50.0 which shows contraction in economic health.
The Flash Services PMI is also expected to drop from 53.6 to 52.6.
The FOMC Meeting Minutes on Thursday. The FED will talk about future interest rates which was previously indicated to be on pause.
Technical Confluences
Near-term resistance at 103.500
Next resistance at 105.000
Minor support at 102.765
Major support at 102.200
Idea
With the Flash Manufacturing PMI and Flash Services PMI expected to drop, it could cause the DXY to drop further towards the 102.700 minor support.
If the FED chooses to pause or indicate pausing of interest rates, it can cause the DXY to drop even further towards the 102.200 major support level.
NOT FINANCIAL ADVICE DISCLAIMER
The trading related ideas posted by OlympusLabs are for educational and informational purposes only and should not be considered as financial advice. Trading in financial markets involves a high degree of risk, and individuals should carefully consider their investment objectives, financial situation, and risk tolerance before making any trading decisions based on our ideas.
We are not a licensed financial advisor or professional, and the information we are providing is based on our personal experience and research. We make no guarantees or promises regarding the accuracy, completeness, or reliability of the information provided, and users should do their own research and analysis before making any trades.
Users should be aware that trading involves significant risk, and there is no guarantee of profit. Any trading strategy may result in losses, and individuals should be prepared to accept those risks.
OlympusLabs and its affiliates are not responsible for any losses or damages that may result from the use of our trading related ideas or the information provided on our platform. Users should seek the advice of a licensed financial advisor or professional if they have any doubts or concerns about their investment strategies.

🔥 Using Manufacturing PMI To Trade Bitcoin CyclesWhat is the Manufacturing PMI (investopedia)?
The Purchasing Managers' Index (PMI) is an economic indicator that measures the direction of trends in manufacturing and service sectors through a diffusion index. The PMI provides information about current and future business conditions to decision-makers, analysts, and investors. The PMI is based on a monthly survey of supply chain managers across 19 industries, covering both upstream and downstream activity. The PMI affects economic decisions by helping managers in a variety of roles to make production, purchasing, and inventory decisions. Investors can also use the PMI to their advantage, as it is a leading indicator of economic conditions that can yield profitable foresight into developing trends in the overall economy.
To offer better readability, I added a 10-period simple moving average to the PMI.
As seen on the chart, we can derive quite a lot of forecasting power from the US PMI. Once it bottoms BTC tends to go up, and once it tops BTC tends to go down. Even easier: a downward sloping moving average is bad and an upward sloping moving average is good for the markets.
As seen on the chart, it appears that the PMI has bottomed in November of 2022. Since then, both crypto and stocks have not made new lows and are grinding upward.
In the future, I suggest you add the PMI indicator to your long-term market analysis to determine whether it's a favorable time to buy or not.

NQ Power Range Report with FIB Ext - 5/1/2023 SessionCME_MINI:NQM2023
- PR High: 13324.50
- PR Low: 13305.00
- NZ Spread: 43.5
Evening Stats (As of 12:15 AM)
- Weekend Gap: N/A
- Session Open ATR: 205.77
- Volume: 20K
- Open Int: 259K
- Trend Grade: Bear
- From ATH: -20.6% (Rounded)
Key Levels (Rounded - Think of these as ranges)
- Long: 13531
- Mid: 12959
- Short: 12392
Keep in mind this is not speculation or a prediction. Only a report of the Power Range with Fib extensions for target hunting. Do your DD! You determine your risk tolerance. You are fully capable of making your own decisions.

PMI Data & How it Effects DXYJust to summarise quickly what the ‘Purchasing Manager Index’ is, it’s a monthly data release by the ISM. PMI data is based on 5 survey areas: new orders, inventory levels, production, supplier delivery & employment.
PMI data ranges from 0-100. A PMI reading ABOVE 50 represents expansion in the economy. Whereas, a reading BELOW 50 represents contraction.
Below is the PMI data for March 2023, which came in at 47.7 which shows the economy is contracting. Now to show the importance of this, let me show you the last few times the PMI dropped below 50👇🏻
2008 - The Financial Market Crash🩸
Early 1980’s - Sky High Inflation🩸
Mid 1980’s - Recession which left unemployment at 7.5%. The recession was caused by tight monetary policy from the government , in an ‘effort’ to fight high inflation🩸

ISM PMI Long Term Chart - 04/08/23The ISM currently stands at 46.3%, signaling a contraction.
Business activity is implying that rising interest rates and growing recession fears are starting to weigh on businesses. The reading pointed to a fifth straight month of contraction in factory activity, as companies continue to slow outputs to better match demand for the first half of 2023 and prepare for growth in the late summer/early fall period.
Frequentist's will tell you that the market tends to bottom six months after the ISM drops below 50.00.
In the chart, I've drawn a channel with fib standard deviations.
This will be a good one to save and track

📈BTC analysis near release of PMI data📉BINANCE:BTCUSDT
COINBASE:BTCUSD
Bitcoin analytical series S01E09(UPDATE)
Hello traders, don't forget to risk-free your positions.
Long targets ----> above Green lines.
Short targets ----> below Green lines.
Please share ideas and leave a comment,
Let me know what's your idea.
CrazyS✌

Macro and crypto: What should traders and investors expect?Hello, everyone! Today we would like to discuss macro and crypto, what affects that, what depends on that and what to expect from the market and when the new bull cycle will start
A LITTLE BIT OF THEORY
1. US PMI (Purchasing Managers Index) – macroeconomic indicator that shows the level of business activity.
2. DGS 1&5 – average 1 and 5 year US Treasury yield.
3. FED Funds Rate – the interest rate at which U.S. banks lend their excess reserves for short terms to other banks.
Let’s figure out what's GOOD and what's BAD for the crypto market
1. PMI
Values above 50 are a good sign, the economy is growing, markets have more liquidity.
Values below 50 are a bad sign, the economy is shrinking, there is less and less liquidity in the market.
2. DGS 1/5
High rates are bad, people are used to investing where there is a clear yield and clear rules for receiving returns, where there is less risk.
Low rates are good, bonds do not bring profitability, people are forced to choose more profitable, and therefore risky instruments for the preservation and multiplication of capital
3. FED Funds Rate
High rates are bad, the interest on capital and liquidity is becoming more and more, the required level of profitability must be higher than the prime rate + the rate of the individual counterparty. Liquidity becomes less and less, access to it becomes more and more difficult.
Low rates are good, liquidity is available to everyone, everyone can take funds to realize their goals and objectives, the overall profitability of any business is quite low. Lots of free money in the market.
Which market can be called BULLISH?
1. US PMI values above 50
2. Low DGS values 1/5
3. Low FED Funds Rate
That's the kind of market we had from April 2020 until November-December 2021. At that point, many realized that the music was no longer playing. The FED hammered the last nail in the coffin of the bull market in February-March 2022, and that's when all the fun and the official bear cycle began.
How do we know if the market has flipped and we're growing up again? Recommendations for PATIENT TRADERS
1. US PMI will come out of the crisis – current values are ATL from May 2020
2. The FED will do a soft landing, beat inflation and start lowering rates – very bullish signal. The important thing is to beat inflation, otherwise our bull market will be very short-lived, or the next bear market will be super painful.
3. DGS 1/5 will fall to spring 2020 values
If you see all of this, then unpack your stackable piggy bank and get ready for a hot period, we will be back in the game and the market of universal profits. As practice shows, everyone will have 3 to 6 months to get into their positions and get ready to take off. Also, remember that the market can be irrational, the main thing for everyone is to let their strategy survive it. Markets are capable of being irrational longer than traders will be solvent.
What to do now?
We’ve tried to give an answer to the question in our previous article. And we still stick to this local position. This article will allow you to look at the crypto market within macro analysis and the overall picture. But then everything depends on you!
Tell us if you study the macroeconomics rates, which indicators you use and which topics you would like to discuss! Don't forget to check links below and check our trading terminal!
NFA & DYOR

NQ Power Range Report with FIB Ext - 3/3/2023 SessionCME_MINI:NQH2023
- PR High: 12050.75
- PR Low: 12031.25
- NZ Spread: 43.5
Evening Stats (As of 12:30 AM)
- Weekend Gap: N/A
- 8/19 Session Gap: -0.04% (open > 13237)
- Session Open ATR: 245.69
- Volume: 25K
- Open Int: 260K
- Trend Grade: Bear
- From ATH: -28.3% (Rounded)
Key Levels (Rounded - Think of these as ranges)
- Long: 12959
- Mid: 12392
- Short: 11820
Keep in mind this is not speculation or a prediction. Only a report of the Power Range with Fib extensions for target hunting. Do your DD! You determine your risk tolerance. You are fully capable of making your own decisions.

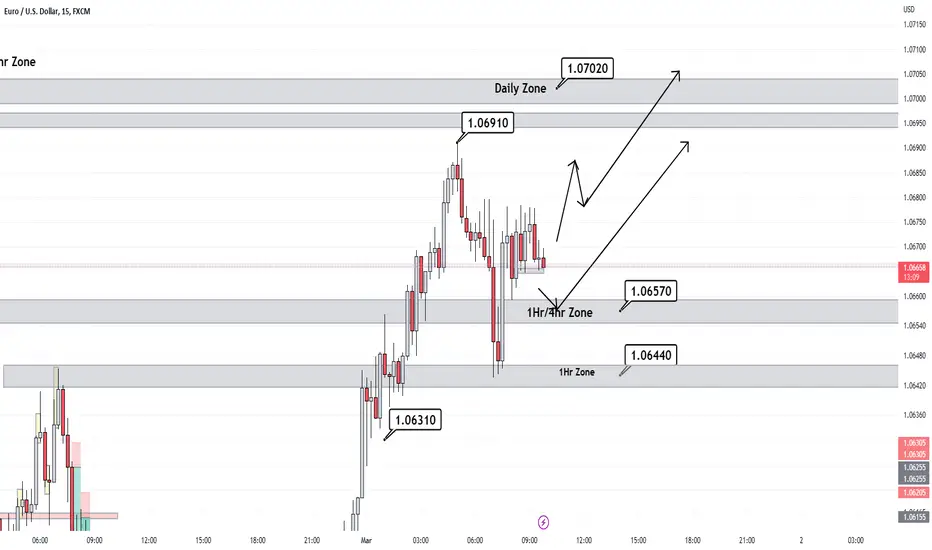
Eurusd could push further into Daily Zone at 1.07 Before SellersManufacturing data as anticpated, or missed slightly. Causing an initial decline in the EU Price. We are looking to close above 1.0657 on the 4hr for Buyers. Then I can observe it being possible for us to touch 1.07 and push deeper into the daily zone before we see sellers take over or range. If the Daily Candle closes like this, we will see a solid body candle.. and at the leasst expect a top wick on the next daily candle. Which, would be a nice intraday-move up.
Catching Up with the Markets U30 Post Analysis (Daily) Haven't posted on here lately since I have been doing lots of work behind the scenes. :-)
I wanted to share some of my Journal commentary on a trade I took this week around the S&P Global 500 PMI release. This was based on the daily timeframe, and trade was taken on the M5.

CADJPY PMI NEWS REALSED 96.666 INCOMING i do now expect CADJPY to really started moving. the Fundaments on CAD PMI news numbers have come out of its ranges therefore i do expect CADJPY to really start moving
TP 96.666
can see lows as 95.555 by end of week.

DXY Forecast ahead of Core PCE Price Index ReleaseHello guys,
Currently DXY is resting on a strong support area at 101.773.
Just a quick recap.
We had the advanced GDP news release which saw a 2.1% growth in 2022 despite challenges like recession fears and high prices. The job market remained strong and people were optimistic about the future.
If the Core PCE Price Index m/m data release yields are better than expected, price can possibly break the descending trend line before heading towards the overlap resistance at 102.821.
Alternatively, if the yields are below expectations, expect DXY to head towards the previous weekly swing low at 101.297.
Stay safe trading guys! :)
Regards,
Chen Yongjin
