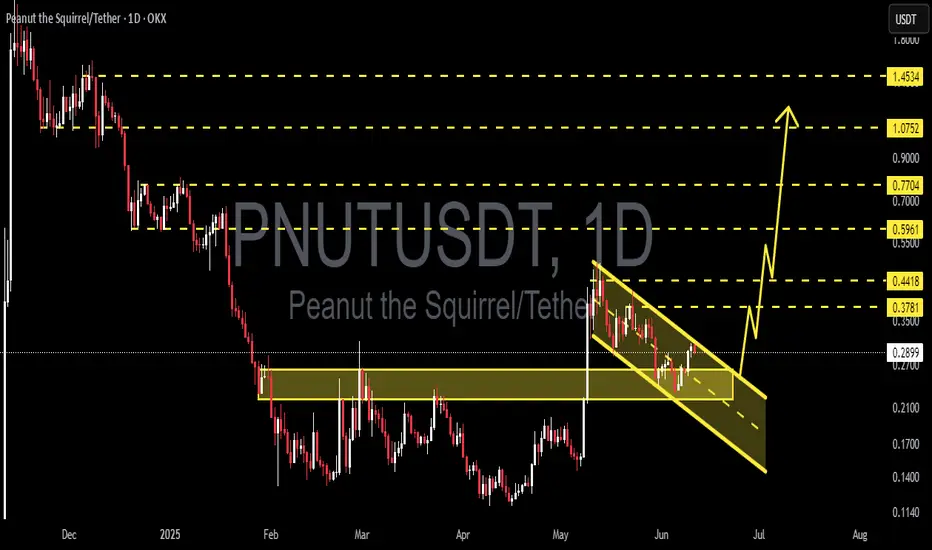
Falling Channel Breakout on PNUT/USDT – Next Stop: $0.76?📊 Pattern Analysis:
Falling Channel (Descending Channel): PNUT formed a clear falling channel from early May to late June 2025. This pattern typically signals a potential bullish reversal once a breakout occurs.
Confirmed Breakout: The price has successfully broken above the upper boundary of the falling channel, which is an early sign of a potential bullish trend.
Strong Support Zone: The horizontal zone around $0.20 – $0.26 USDT has acted as a solid demand base, as seen multiple times from March to June.
✅ Bullish Scenario:
If the breakout continues with momentum, the price could move upward gradually, aiming for the following resistance levels:
1. Target 1: $0.2986 – Minor resistance
2. Target 2: $0.3774 – Previous consolidation area
3. Target 3: $0.4403 – Major historical resistance
4. Target 4: $0.5951 to $0.7674 – Recovery zone from the falling channel
5. Extended Target (Long-Term): $1.0797 to $1.7957 (if a full rally occurs with strong bullish sentiment)
❌ Bearish Scenario:
If the price fails to hold the breakout and re-enters the channel:
Potential drop back to the support zone of $0.2000 - $0.1600
A breakdown below this range may lead to further downside toward $0.1300 to $0.1000 (previous historical low)
🔍 Summary:
The chart displays a classic bullish reversal pattern with a confirmed breakout from the falling channel.
The $0.26–$0.29 area now acts as a key confirmation zone. If the price holds above it and completes a successful retest, the bullish continuation is likely.
However, traders should stay cautious of false breakouts.
#PNUTUSDT #CryptoBreakout #AltcoinSeason #ChartAnalysis #BullishReversal #TechnicalAnalysis #BreakoutTrading #CryptoSignals #DescendingChannel
PNUTUSDC

PNUTUSDT 1D Analysis PNUT ~ 1D Analysis
#PNUT Buy when retesting this support block or buy after successfully breaking this resistance line with a short-term target of at least 15%++
PNUTUSDT 12H AnalysisPNUT ~ 12H Analysis
#PNUT Buy after breaking this resistance line with a short term target of at least 15%+ and a long term target of $1.07++

#PNUT/USDT#PNUT
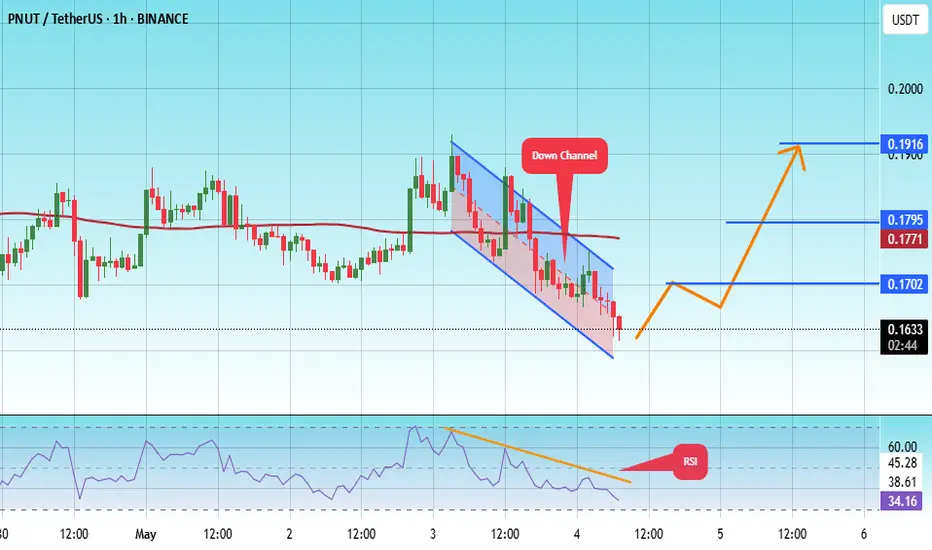
The price is moving within a descending channel on the 1-hour frame, adhering well to it, and is on its way to breaking it strongly upwards and retesting it.
We are seeing a bounce from the lower boundary of the descending channel, which is support at 0.1595.
We have a downtrend on the RSI indicator that is about to break and retest, supporting the upward trend.
We are looking for stability above the 100 Moving Average.
Entry price: 0.1633
First target: 0.1700
Second target: 0.1771
Third target: 0.1916
PNUTUSDT Ready to Rally!PNUTUSDT Technical analysis update
PNUTUSDT is breaking out of a wedge pattern on the daily chart after three months of formation. We also observed a bullish RSI divergence in the daily timeframe, along with a MACD bullish crossover a few days ago. A 50–100% move could be seen in the mid-term.

PNUTUSDT 1D AnalysisPNUT ~ 1D Analysis
#PNUT Buy gradually from here with a short -term target of at least 10%+ from here.

PNUT / USDT – Daily AnalysisBullish divergence spotted!
Price is printing lower lows, but RSI is making higher lows — a classic bullish divergence pattern. This signals potential trend exhaustion on the downside.
#PNUT is holding above a horizontal support level around 0.12–0.13 USDT, aligning with the divergence signal.
Volume is tapering off, indicating decreasing selling pressure.
RSI is currently around 37–38 and showing a higher low structure.
Key levels to watch:
Support: 0.1220–0.1300 USDT (current demand zone).
Resistance: 0.1650 USDT (local high), followed by stronger resistance at 0.2000–0.2200 USDT.
Scenario ideas:
If PNUT can hold above support and RSI continues climbing, we might see a relief rally towards the next resistance zones.
A breakdown below 0.1220 would invalidate this bullish setup and could lead to continuation of the downtrend. Still... bullish divergence then will become even more obvious....
Bias:
bullish short-term, watching for confirmation.
⚠️ Not financial advice. Always manage your risk!
#PNUT #Crypto #Altcoins #BullishDivergence #RSI #TradingView
