#PENGU #PENGUUSDT #PENGUINS #LONG #AMD #PO3 #Analysis #Eddy#PENGU #PENGUUSDT #PENGUINS #LONG #AMD #PO3 #Setup #Analysis #Eddy
PENGUUSDT.P Scalping Long Setup
This Setup & Analysis is based on a combination of different styles, including the volume style with the ict style. (( AMD SETUP )) "PO3"
Based on your strategy and style, get the necessary confirmations for this scalping setup to enter the trade.
Don't forget risk and capital management.
The entry point are indicated on the chart along with their amounts.
The responsibility for the transaction is yours and I have no responsibility for not observing your risk and capital management.
Note: The price can go much higher than the specified target and have a very good pump.
Be successful and profitable.
PO3

GOLD: A Week After Israel Bombs Iranmy view on where gold is going and how i caught the buy on friday after much accumulation

Mastering the ICT Power of 3 concept - How to use it in trading!The financial markets often appear chaotic and unpredictable, but behind the scenes, institutional players operate with clear strategies that shape price action. One such strategy is the ICT (Inner Circle Trader) "Power of 3" model, a framework used to understand and anticipate market cycles through three key phases: accumulation, manipulation, and distribution. This guide will break down each of these phases in detail, explaining how smart money operates and how retail traders can align themselves with the true direction of the market.
What will be discussed?
- The 3 phases
- Examples of the PO3
- How to trade the PO3
- Tips for trading the PO3
The 3 phases
Accumulation
The Accumulation Phase in the ICT "Power of 3" model refers to the initial stage of a market cycle where institutional or "smart money" participants quietly build their positions. During this time, price typically moves sideways within a tight range, often showing little to no clear direction. This is intentional. The market appears quiet or indecisive, which is designed to confuse retail traders and keep them out of alignment with the real intentions of the market's larger players.
In this phase, smart money is not looking to move the market dramatically. Instead, they are focused on accumulating long or short positions without drawing attention. They do this by keeping price contained within a consolidation zone. The idea is to gather enough liquidity, often from unsuspecting retail traders entering early breakout trades or trying to trade the range, before making a more aggressive move.
Manipulation
The Manipulation Phase in the ICT "Power of 3" model is the second stage that follows accumulation. This phase is where smart money deliberately moves the market in the opposite direction of their intended move to trigger retail stop losses, induce emotional decisions, and create liquidity.
After price has consolidated during accumulation, many retail traders are either already positioned or have orders waiting just outside the range, either stop losses from those trading the range or breakout orders from those anticipating a directional move. The manipulation phase exploits this positioning. Price will often break out of the accumulation range in one direction, appearing to confirm a new trend. This move is designed to look convincing, it might even come with a spike in volume or momentum to draw traders in.
However, this breakout is a false move. It doesn’t represent the true intention of smart money. Instead, it's meant to sweep liquidity, triggering stop losses above or below the range, and then reverse sharply. This stop run provides the liquidity needed for large players to finalize their positions at optimal prices. Once enough liquidity is collected, and retail traders are caught offside, the real move begins.
Distribution
The Distribution Phase in the ICT "Power of 3" model is the final stage of the cycle, following accumulation and manipulation. This is where the true intention of smart money is revealed, and the market makes a sustained, directional move, either bullish or bearish. Unlike the earlier phases, distribution is marked by clear price expansion, increased volatility, and decisive momentum.
After smart money has accumulated positions and shaken out retail traders through manipulation, they have the liquidity and positioning needed to drive the market in their desired direction. The distribution phase is where these positions are "distributed" into the broader market, meaning, institutions begin to offload their positions into the retail flow that is now chasing the move. Retail traders, seeing the strong trend, often jump in late, providing the liquidity for smart money to exit profitably.
This phase is typically what retail traders perceive as the real trend, and in a sense, it is. However, by the time the trend is obvious, smart money has already entered during accumulation and profited from the manipulation. What appears to be a breakout or trend continuation to most retail participants is actually the final leg of the smart money’s strategy. They are now unloading their positions while price continues to expand.
Examples of the Power of 3
How to trade the PO3?
Start by identifying a clear accumulation range. This typically happens during the Asian session or the early part of the London session. Price moves sideways, forming a consolidation zone. Your job here isn’t to trade, but to observe. Draw horizontal lines marking the high and low of the range. These become your key liquidity zones.
Next, anticipate the manipulation phase, which usually occurs during the London session or at the NY open. Price will often break out of the range, triggering stop losses above the high or below the low of the accumulation zone. This move is deceptive, it is not the real trend. Do not chase it. Instead, wait for signs of rejection, such as a sharp reversal after the liquidity grab, imbalance filling, or a shift in market structure on a lower timeframe (like a 1- or 5-minute chart).
Once manipulation has swept liquidity and price starts showing signs of reversing back inside the range or beyond, you now look for a confirmation of the true move, this begins the distribution phase. You enter in the direction opposite of the manipulation move, ideally once price breaks a structure level confirming that smart money has taken control.
For example, if price consolidates overnight, fakes a move to the downside (running sell stops), and then quickly reverses and breaks above a key swing high, that's your signal that the true move is likely up. Enter after the break and retest of structure, using a tight stop loss below the recent low. Your target should be based on liquidity pools, fair value gaps, or higher-timeframe imbalances.
The key to trading the Power of 3 is patience and precision. You're not trying to catch every move, but to wait for the market to complete its cycle of deception and then ride the clean expansion. Ideally, your entry comes just after manipulation, and you hold through the distribution/expansion phase, taking partials at key liquidity levels along the way.
Tips for trading the PO3
1. Learn price movements
Before you can effectively apply the ICT Power of 3 strategy, it’s crucial to have a deep understanding of how price behaves. This means being comfortable identifying market structure, recognizing trend direction, and interpreting candlestick dynamics. Since the Power of 3 is deeply rooted in how price moves in real time, a strong grasp of these basics will give you the confidence to read the market correctly as each phase develops.
2. Analyse multiple timeframes
Although the Power of 3 pattern shows up on lower timeframes, relying on just one can lead to misreads. You’ll gain a clearer picture when you align the short-term view with higher timeframe structure. For example, what appears to be accumulation on the 15-minute chart may simply be a retracement in a larger trend on the 1-hour or daily. By examining multiple timeframes together, you can better identify the true setup and avoid being tricked by noise.
3. Exercise patience
A key part of trading the Power of 3 is knowing when to act, and more importantly, when not to. It’s easy to get impatient during the accumulation or manipulation phases, but entering too early often leads to frustration or losses. True discipline comes from waiting for the expansion or distribution phase, when the market reveals its real direction. This is where the most favorable risk-to-reward setups occur.
Thanks for your support.
- Make sure to follow me so you don't miss out on the next analysis!
- Drop a like and leave a comment!

possible buyhigher time frame bullish, sitting at strong support and demand we can see a possible retest of highs, after either a London sell side liquidity sweep or both London and Asian low sweep waiting for this to take place in our entry zone new york

Quarterly Theory "QT"
Introduction to Quarterly Theory (QT)
Time must be divided into quarters for a proper interpretation of market cycles.
Combining QT (Quarterly Theory) concepts with basic ICT concepts leads to greater accuracy.
Understanding QT allows you to be flexible. It adapts to any trading style as it is universal across all time frames.
QT eliminates ambiguity by providing specific time-based reference points to look for when entering trades
.
THE CYCLE
Annual Cycle - 3 quarters each
Monthly Cycle - 1 week each
Weekly Cycle - 1 day each*
Daily Cycle - 6 hours each
Session Cycle - 90 minutes each
*Monday to Thursday, Friday has its own specific function .
Annual Cycle:
Q1 JANUARY - MARCH
Q2 APRIL - JUNE
Q3 JULY - SEPTEMBER
Q4 OCT - DECEMBER
Monthly Cycle**:
Q1 FIRST WEEK
Q2 SECOND WEEK
Q3 THIRD WEEK
Q4 FOURTH WEEK
Weekly Cycle*:
Q1 MONDAY
Q2 TUESDAY
Q3 WEDNESDAY
Q4 THURSDAY
Daily Cycle:
Q1 ASIA
Q2 LONDON
Q3 NEW YORK
Q4 AFTERNOON
**Monthly Cycle starts with the first full week of the month.
*Friday has its own cycle, which is why it is not listed.
Q1 indicates the quarters that follow.
If Q1 expands, Q2 is likely to consolidate.
If Q1 consolidates, Q2 is likely to expand.
TRUE OPENS
True price opens are the beginning of Q2 in each cycle. It validates key levels.
What are the true opens?
Yearly: First Monday of April (Q2)
Monthly: Second Monday of the month (Q2)
Weekly: Second daily candle of the week
Daily: Start of the London session (6 hours after the open of the daily candle)
Asia - London - NY - Evening: 90 minutes after the open of the 6-hour candle.
DIAGRAM:
Q1 (A) Accumulation - Consolidation.
Q2 (M) Manipulation - Judas Swing (Trade this).
Q3 (D) Distribution (Trade this).
Q4 (X) Continuation - Reversal of the previous quarter.
Q1 (X) Continuation - Reversal of the previous quarter.
Q2 (A) Accumulation - Consolidation.
Q3 (M) Manipulation - Judas Swing (Trade this).
Q4 (D) Distribution (Trade this).
ANNUAL CYCLE:
MONTHLY CYCLE:
WEEKLY CYCLE:
DAILY CYCLE:

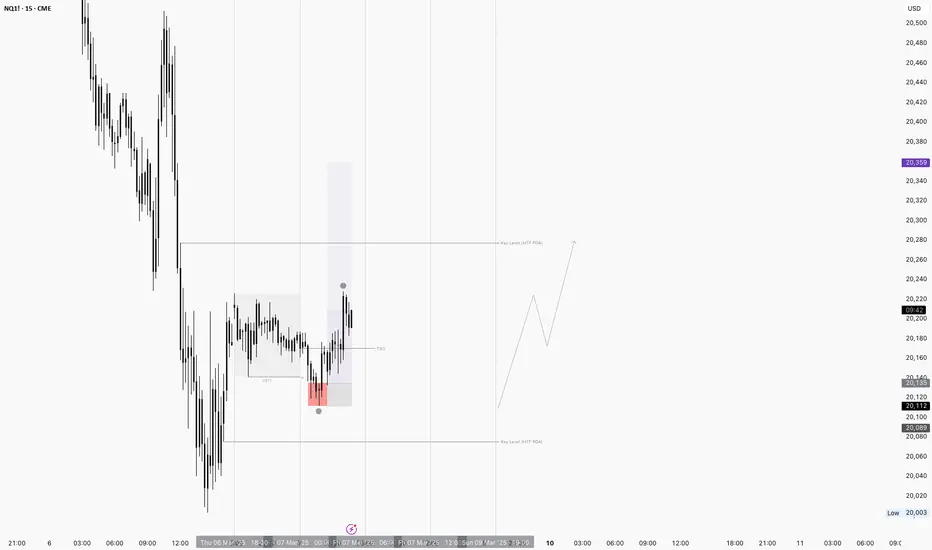
NQ! Long IdeaFollowing Chart presents my current long Idea on NQ following MXMM Quarterly Theory and PO3.
What Is ICT PO3, and How Do Traders Use It?What Is ICT PO3, and How Do Traders Use It?
The ICT Power of 3 is a strategic trading method that helps traders identify behaviour of ‘smart money.’ It dissects market movements into three distinct phases: accumulation, manipulation, and distribution. This article explores the intricacies of the Power of 3 strategy and its practical application in trading.
Understanding the ICT PO3 Trading Concept
The ICT Power of 3 (PO3), or the AMD setup, is a strategic trading framework developed by Michael J. Huddleston, better known as the Inner Circle Trader. This approach revolves around three critical phases: accumulation, manipulation, and distribution, which collectively help traders understand and anticipate market movements.
Accumulation Phase
During this phase, smart money or institutional investors accumulate positions within a price range, often leading to a period of low volatility and sideways movement. This stage sets the groundwork for future price movements by creating a base of support or resistance.
Manipulation Phase
The manipulation phase involves deliberate price moves by smart money to trigger stop losses and deceive retail traders. In a bullish scenario, prices may dip below the established range, while in a bearish market, prices might spike above the range. This phase is seen as being characterised by sharp, misleading price movements aimed at manipulating liquidity.
Distribution Phase
Following manipulation, the distribution phase sees smart money offloading their positions, leading to significant price movements in the intended direction. For bullish trends, this involves a strong upward move, whereas, in bearish conditions, it results in a sharp decline. This phase marks the realisation of the strategic positions built during the accumulation phase.
Understanding this ICT concept allows traders to align their strategies with the actions of institutional investors, potentially enhancing their ability to make informed trading decisions. The ICT PO3 strategy is versatile, applicable across different timeframes and financial instruments, making it a valuable tool for traders in various markets.
Below, we’ll discuss each of these three phases in more detail.
Accumulation Phase
The accumulation phase is a crucial initial stage within the Power of 3 trading strategy. It represents a period where institutional investors, often referred to as smart money, quietly build their positions in a particular asset. This phase is characterised by relatively low volatility and sideways price movement, typically near key support or resistance levels.
During accumulation, the market tends to range within a narrow band as large players gradually buy into the asset without significantly driving up its price. This steady acquisition reflects their confidence in the asset's future appreciation. Recognising the accumulation phase involves monitoring for signs such as low-volatile, ranging price action and potential increases in trading volume without major price changes.
Indicators of the accumulation phase include:
- Low Volatility: The asset trades within a tight range, showing little directional bias.
- Support Levels: Accumulation often occurs near historical support or resistance levels where the price is deemed under or overvalued by institutional investors.
- Increased Volume: There may be a gradual rise in volume as smart money accumulates positions, signalling their interest without causing sharp price movements.
Specifically, this range is also intended to trap retail traders on both sides of the market. In a bullish accumulation, for example, where the price will eventually break upwards, the range will trap bullish traders buying from the support level inside of the range. Given that these traders will most likely set their stop losses below the range, this paves the way for the next stage: manipulation of liquidity.
However, some traders will also take a short position in this range, anticipating that price will continue to break lower. These traders add fuel to the distribution leg discussed later.
The Manipulation Phase
The manipulation phase is a pivotal part of the ICT PO3 trading strategy. This stage is marked by deliberate actions from institutional investors to create market conditions that mislead and trap retail traders. It follows the accumulation phase, where positions are built, and precedes the distribution phase, where these positions are realised.
Characteristics of the Manipulation Phase:
- Deceptive Price Movements: During this phase, the price moves sharply in a direction opposite to the expected trend. In a bullish setup, prices might dip below the established range, while in a bearish setup, they might spike above the range. These moves are designed to trigger stop-loss orders, encourage breakout traders to enter positions and ultimately generate liquidity for the smart money’s large orders.
- Triggering Retail Traps: The primary goal is to shake out early traders by hitting their stop-loss levels. For instance, a sudden dip in a bullish market might make retail traders believe that the market is turning bearish, prompting them to close their positions.
- Creating Liquidity: By inducing these price movements, smart money creates liquidity that allows them to add to their positions at more favourable prices. This phase is crucial for building the necessary conditions for the subsequent distribution phase.
Recognising Manipulation:
- False Breakouts: Characterised by sharp, sudden moves that quickly reverse. These are often designed to lure traders into thinking a breakout has occurred.
- Price Action Signals: Price action that doesn’t align with the overall market structure or sentiment can be a sign of manipulation. This can be especially true after a long uptrend or downtrend, signalling potential exhaustion.
For example, in a bullish market, after a period of accumulation where prices have stabilised within a range, a sudden drop might occur. This drop triggers stop-loss orders and panics retail traders into selling. It also encourages some to trade what appears to be a bearish breakout. Smart money then buys these positions at lower prices, preparing for the distribution phase where they push the prices up sharply.
The Distribution Phase
The distribution phase is the final stage in the Power of 3 trading strategy, where smart money begins to offload their positions built during the accumulation phase. This phase follows the manipulation phase, and it is characterised by strong price movements in the direction opposite to the manipulation.
Key Characteristics of the Distribution Phase:
- Significant Price Movement: This phase involves substantial price changes as institutional investors begin to realise their positions. In a bullish scenario, this means a sharp upward movement; in a bearish scenario, a sharp decline.
- High Volume: The distribution phase is often accompanied by high trading volume, indicating that a large number of positions are being sold or bought back.
- Market Confirmation: During this phase, the true market trend that was obscured during the manipulation phase becomes evident. The price moves in the direction of the original accumulation, confirming the intent of the smart money.
- Retail Trader Participation: Many traders have been shaken out of their positions, including those who were wrong about the initial breakout’s direction and those who were correct but had their stop loss triggered by the manipulation phase. They now pile back into the trade, fueling this strong upward or downward leg.
Recognising the Distribution Phase:
- Price Action: Traders look for strong, sustained movements in price, often with large candles. For a bullish trend, this means a consistent upward movement; for a bearish trend, a consistent downward movement.
- Volume Analysis: Increased trading volume during these price movements indicates distribution.
- Breaking Market Structure: The high or low of the accumulation/manipulation phase will be traded through.
- Technical Indicators: Use of tools like moving averages and support/resistance levels can help confirm the transition into the distribution phase.
For example, in a bullish market, smart money begins to buy aggressively after the price has been manipulated downwards to create liquidity. This buying pressure pushes the price up sharply, signalling the start of the distribution phase. Traders can look for increased volume and price action breaking above previous resistance levels as confirmation.
Practical Application of ICT PO3
The ICT PO3 strategy can be effectively applied by traders through a structured approach involving higher timeframe analysis and keen observation of price movements. Here's how traders typically utilise this strategy:
Setting the Daily Bias
Traders often start by establishing their market bias for the day. This involves analysing higher timeframes to determine the overall market trend. Understanding whether the market is bullish or bearish sets the foundation for the day’s trading strategy.
Marking the Day's Open
After setting the bias, traders mark the opening price of the day. This price point is critical as it serves as a reference for potential manipulation and trading opportunities.
Identifying Manipulation
Traders look for price movements beyond the day's open and the established range boundaries. For a long bias, they observe for manipulation below the open, while for a short bias, they look above the open. This stage is crucial as it indicates where smart money is likely manipulating the market to create liquidity.
Entry Signals
While a trader can simply enter once price trades beyond the day’s open, many choose to confirm the trade. Using a 5-15 minute chart, they might look for signals such as:
- Price moving into a significant area of liquidity beyond a key swing high or low.
- A break of established market structure, such as price beginning to move above previous swing highs in a bullish setup (known as a change of character, or ChoCh).
- Chart patterns or candlestick patterns that indicate a reversal or continuation, such as a hammer/shooting star, wedge, quasimodo, etc.
- A moving average crossover that supports the expected price direction.
- Momentum indicators showing waning momentum in the manipulated direction.
Traders typically place stop losses beyond the manipulation high or low to potentially manage risk here.
Distribution Phase Opportunities
If an entry is missed during the manipulation phase, traders can look for opportunities during the distribution phase. Although this phase may offer a less favourable risk-to-reward ratio, it still provides potential trading opportunities. Traders might wait for a market structure break or ChoCh, followed by a pullback, setting stop losses either beyond a recent swing high/low or beyond the manipulation high or low.
ICT Power of 3 Example
On the GBPUSD 15m chart above, the day open acts as a support level, marking the accumulation phase. A candle wicks below the range, followed by a price break above the range, which then sharply reverses, indicating the manipulation phase. After taking liquidity, price rebounds sharply.
On the 5m chart, a break above the downtrend structure creates a change of character (ChoCh) before price pulls back and breaks above the manipulation high, signalling a bullish market shift. Subsequent pullbacks might be excellent entry points for traders who missed the manipulation phase entries before price marks up further.
The Bottom Line
Understanding and applying the ICT Power of 3 strategy can enhance a trader's ability to navigate market movements. By recognising the phases of accumulation, manipulation, and distribution, traders can better align their actions with institutional behaviours. To implement this strategy and optimise your trading experience, consider opening an FXOpen account for advanced trading tools and support of a broker you can trust.
FAQ
What Is PO3 in Trading?
The ICT Power of 3 (PO3) is a trading strategy developed by Michael J. Huddleston, known as the Inner Circle Trader. It involves three key phases: accumulation, manipulation, and distribution. These phases help traders understand market movements by aligning their strategies with institutional investors.
What Is the Power of 3 ICT Entry?
The Power of 3 ICT entry involves identifying optimal points to enter trades during the phases of accumulation, manipulation, and distribution. Traders typically look for signs of price manipulation, such as false breakouts, and then enter trades in the direction of the anticipated distribution phase.
How Does the Power of 3 Work?
The ICT Power of 3 can be an indicator of potential smart money involvement. It works by breaking down market movements into three phases:
1. Accumulation: Smart money builds positions.
2. Manipulation: Price moves are designed to deceive retail traders.
3. Distribution: Smart money offloads positions, leading to significant price movements in the intended direction.
How to Trade the Power of Three?
To begin Power of Three trading, traders first set their daily bias using higher timeframe analysis. They then mark the daily open and observe for price manipulation. Entry signals include breaks of market structure, liquidity grabs, and candlestick patterns. Traders set stop losses beyond manipulation highs or lows and can also look for entries during pullbacks in the distribution phase.
Trade on TradingView with FXOpen. Consider opening an account and access over 700 markets with tight spreads from 0.0 pips and low commissions from $1.50 per lot.
This article represents the opinion of the Companies operating under the FXOpen brand only. It is not to be construed as an offer, solicitation, or recommendation with respect to products and services provided by the Companies operating under the FXOpen brand, nor is it to be considered financial advice.

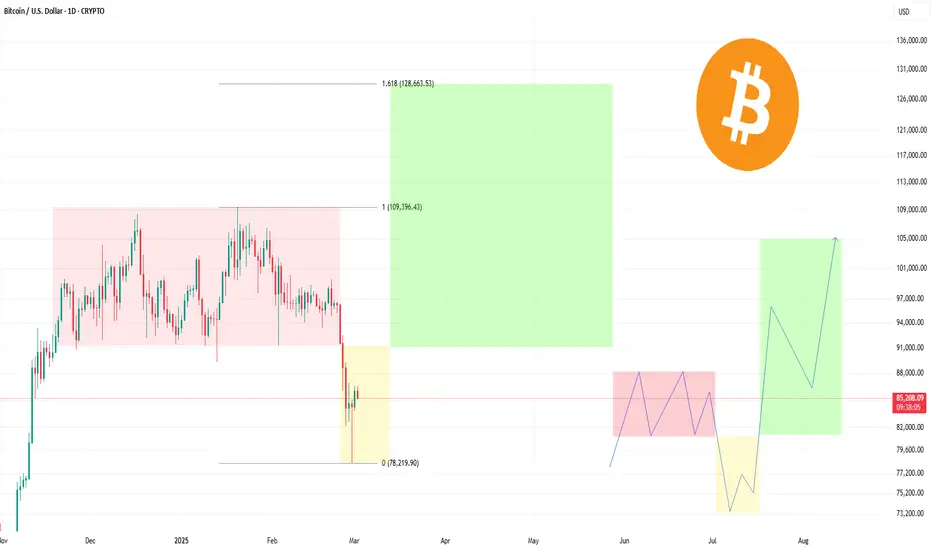
PO3 and Fibonacci: The Path to $128,000I've always been an advocate of analyzing data deeply and finding patterns where others see chaos. And today I want to share my perspective on one of the most exciting opportunities that are taking shape right now.
PO3 is not just an indicator, but a real key to understanding how the market shapes its moves. When you combine it with Fibonacci levels, a unique picture opens up in front of you that gives you a glimpse into the future. This is exactly the case when the data speaks for itself. Now, analyzing the current dynamics, I come to the conclusion that we can expect a significant rise in price to the level of 128,000 dollars. PO3 shows a clear direction and Fibonacci levels confirm the potential for such a move.
So, my prediction: $128,000 is not the limit of dreams, but a realistic goal that we can achieve. And those who understand this trend have a unique advantage.
Alex Kostenich,
Horban Brothers.
NQ Short Idea (MXMM | Quarterly Theory)Hello guys, I hope everyone is having a profitable day.
I present to you my todays short idea. I want the London highs to be swept and price to manipulate into my Key Level. I will enter short once this happens and we have ChoCh + retrace into any PD Array (OB, FVG,...)
Praise be to God.
-T-

ADAUSDT Market Maker Buy ModelMarket maker buy model framework 12h. We'll see what happens tomorrow with the NFP volatility injection.

NIFTY (PO3) A++ Bearish Setup Power of 3 Strategy (PO3) also know as AMD Strategy
This strategy has three primary phases
1. Accumulation
2. Manipulation
3. Distribution (Range Expansion)
Key elements
1. HTF PD Array
2. Daily Open
3. Fibonacci Price Projection Tool
4. Standard Deviation ( -2 to -2.5 )
Process
1. Accumulation is where big players accumulate large quantity of shares forming a range bound price consolidation.
2. Manipulation is where big players move price against their intended direction towards nearby HTF PD Array with a standard Deviation of -2 to -2.5 to sweep the liquidity to for order pairing.
3. Distribution is the real momentum where retail traders enter along with big players and ride the trend with range expansion.

Consolidation before the BOJ Policy Rate DecisionWe probably won't see much price action today even though rates were cut to 5% yesterday. Many market participants are bullish, but this feeling can quickly disappear if the Bank of Japan (BOJ) decides to raise rates again, creating a situation like the one on August 5th. We got some clusters of liquidation around ~$63k but we have alot more at <$58k to liquidate.

The only Range you need for BitcoinTake the high and take the low. We are about to approach the red line. The middle of the range, which I think will serve as resistance. We could move to $61.4k by Wednesday, but the FOMC will shake the markets a bit then. On Friday, it will also be interesting to see if the Bank of Japan decides to raise rates.

Quick pump on monday? BITCOINWe could see a rapid rally on Monday that will last until Wednesday when the CPI data is released. We are currently in a mean reversion as show with the arrow. We broke through the ema50 and are retesting it right now. The order books are also pointing to $56k as there is a lot of liquidity in the form of orders looking to be filled.

Gamestop (GME) local bottom?Look at this retest of this horizontal support at around $20.
GME has also retested and held the EMA50 on the weekly time frame, which looks quite promising, like a mean reversion and even more bullish because it is a higher time frame.

Solana Bull Market IdeaThis idea shows a scenario of a possible start of the bull market. Solana has been moving sideways for a long time. I expect a manipulative event in the red square, like the Fomc event or a war event that will shake the last bull, but all this is preparation for the bull market event. The target is anything above the all-time high.

4hr BITCOIN mean reversion rejection - Leave the rest for laterIn #Bitcoin's 4-hour chart scenario, we reject the EMA50 we are currently at and take the low at $56k in the next couple of days. We get a lot of economic data in the next few days until Friday, which could strengthen the US dollar and lead Bitcoin into a sell-off. Chart-wise, it looks like a rejection of the 4hr EMA50. The first target would be $56k and if things look really ugly, we should also consider $51k as a possible target.

Bear and bull scenario for today (MONDAY)We recovered the wick from Sunday with the move lower just before the close of the weekly candle. I could see some mean reversion here on the table and a possible break or rejection near the daily open (offset) at $58.4k. Like always $58k region is key. A possible rejection can happen at the psychological low at $58.2k. Right now we are still in the range of $58k - $61k. London Session starts in 8 min and will start the day. Let's go. Trade safe!

Long term bullmarket scenarioThis idea is a long-term bull market scenario. This idea could start on the day of the FED interest rate decision. The rate decision could lead price action into a bear trap by making traders think we are making a lower low. Well, we do, but this should be considered a bear trap as we have been moving sideways since March and a big event like the FED rate decision could lead to a trend change. Considering the fact that we are making lower lows, it seems like we are constantly liquidating the long positions and the market makers are keeping the short positions alive to sell on a late uptrend.

Potential PO3 in formed on BitcoinThis fundamental analysis shows the potential of a PO3 pattern forming. We went to the EMA50 on the 1 hour time frame which was the manipulative move in the Po3 pattern. At the moment we are back in the consolation area, but there is a chance to go back to older lows that were respected by the last decline, which could have its turn now. So $56k is the target for now.

Retrace and recover the CME Gap?We could rise to around $61.8k to close the CME GAP on Bitcoin. After filling it, we could fall further. Let's see how the price performs around 4pm. Economic data will be released today at around 2:30pm. Let's go! Safe trade.

Bearish trend continuation for the weekThat's my idea for the current downtrend if we continue it. Nvidia earnings today at 10pm could be a factor for volatile price action. I see the possibility of a move up to the 1hr EMA50 at around $61.2k if earnings come out well. This is a scenario where we continue the current downtrend. Check out my bear scenario for this week here on tradingview to see the bigger picture. The level to keep an eye on is the $56k level as the price could be interesting there due to pools of liquidity. I have also marked the current price levels where we are again. These are the levels of the consolidation range we were in last week.
