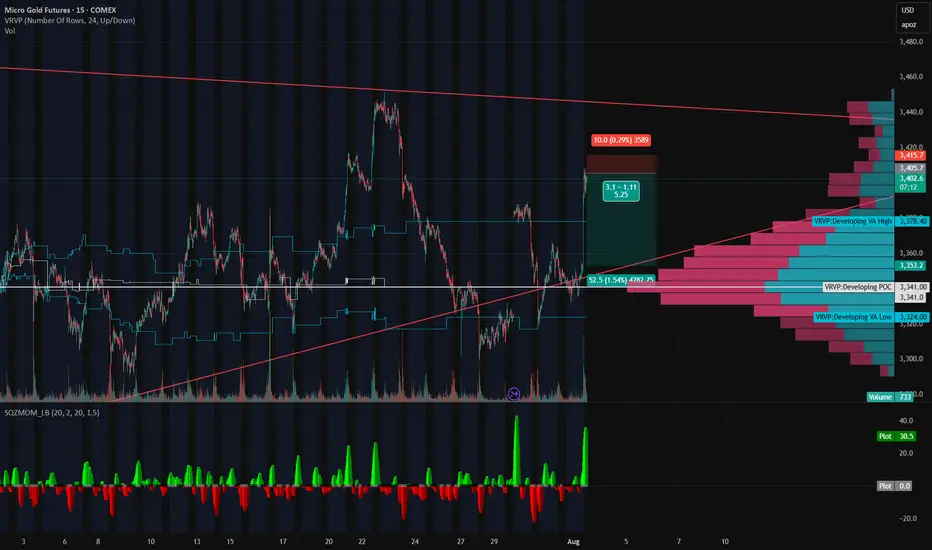
Gold’s on a Roller Coaster — and We’re Riding It Down🎢 Gold’s on a Roller Coaster — and We’re Riding It Down 🎢
Gold just snapped up like it saw Trump tweet “TARIFFS ARE BACK” — but the move smells like a knee-jerk algo pump, not real conviction. We just rejected right into a thin-volume imbalance zone and tagged the underside of a long-standing trendline.
📉 Short Setup Locked In:
💥 Entry: 3405
🛑 Stop: 3415
🎯 Target: 3353
💰 R:R ≈ 5:1
🔍 Why I'm In This Trade:
That rip? Total headline panic, not structural strength.
Low volume shelf above, with a massive POC magnet below at 3353.
We tapped the Developing VAH (3414) and got rejected — classic trap setup.
SQZMOM showing the energy is already fizzling. Green flash, no follow-through.
🧠 The Narrative:
Gold’s trying to price in volatility from every angle — Trump talk, tariffs, macro chaos — but under the hood, this pop looks unsustainable. If this is just a liquidity grab, we could see a flush back into the meat of value fast.
Grab your helmets — this roller coaster might just be heading downhill 🎢📉
POC
HBAR Game Plan: Short the Bounce, Long the Liquidity GrabHBAR has been moving strongly and is currently offering both short and long trade opportunities based on a clean potential ABC corrective pattern, key fib levels, volume profile, and anchored VWAP. Let’s break down the setup.
🧩 Technical Breakdown
Higher Timeframe Confluence:
0.618 fib retracement from the macro move
1.618 trend-based fib extension
1.272 VWAP band resistance
Point of Control (POC) from the visible range profile
This is marked as a major take profit/short opportunity zone.
For extra confluence, the negative fib extension golden pocket (-0.618 to -0.666) also aligns right at this resistance zone
Current Structure:
We’re potentially completing wave B of an ABC corrective move
Price has retraced into a high-probability short zone
🔴 Short Setup
Entry Zone:
Between the 0.702 and 0.786 fib retracement levels
Why Here?
0.702–0.786 fib retracement → short zone for reversals
Potential wave B top → setting up for a C leg down
Target (TP):
Around $0.25–$0.24, near the expected wave C completion
🟢 Long Setup
Entry Zone:
~$0.25–$0.24 area.
Why Here?
This zone is a strong confluence area:
➡️ 0.786 fib retracement
➡️ 1.0 trend-based fib extension of ABC
➡️ Anchored VWAP from the entire trend, offering dynamic support
➡️ Liquidity pool
➡️ Previous weekly Open
Plan:
Wait for price to complete wave C into this zone, then look for bullish reaction signs to enter long.
💡 Educational Insight
Why the 0.702–0.786 short zone?
These fib levels are often overlooked but are key “hidden” zones where wave B tops out before C waves.
Why anchored VWAP?
Anchored VWAP gives you dynamic institutional support/resistance, especially when aligned with fibs and liquidity.
Why wait for confirmation?
Blindly longing or shorting levels can trap you. Wait for SFPs, wick rejections, or lower timeframe structure flips to boost trade probability.
Final Thoughts
HBAR is in a highly interesting zone, offering both:
A short setup into the C wave,
And a long setup at the C wave completion, backed by multiple confluence factors.
Let the levels come to you and wait for confirmation!
_________________________________
💬 If you found this helpful, drop a like and comment!
Want breakdowns of other charts? Leave your requests below.

Using LuxAlgo SMC Free indicatorSometimes Indicators helps calculates the swing points without any effort especially during live trading.
POC is part of a tool called Volume Profile. In this case, Im using select Fixed Range VP to identify short term POC to see where PA can bounced from.
When markets moving sideways or in a Trading Range, PA tends to be choppy.
Nobody knows about the future, if they claimed to know, just run away. Here are some probabilities how PA would do next.
Bitcoin's Failed 60-Day Cycle: Relief Rally Before More DownsideBitcoin has officially failed its current 60-day cycle by breaking below the previous cycle low on June 5th, touching $100,000. This marks a key structural shift that traders should not ignore.
📉 What’s Next? Likely Scenario:
The highest probability setup now is a relief rally toward the Stoch RSI highs on the 1-Day and 3-Day timeframes, followed by a move downward into the 60-day cycle low, projected to form between late July and early August. This aligns with a potential retest of the Value Area Low from April, a key support zone to watch.
📈 Upside Target:
If we do see bullish continuation in the short term, the main upside target is $105,000. This level is significant as it clusters three Weekly Point of Control (POC) levels from May and June, making it a high-liquidity magnet for price. Historically, Bitcoin tends to gravitate toward these levels when several align closely.
💼 Current Positioning:
I’m currently long BTC and ETH, and I’m watching closely for Stoch RSI to top out on the 1-Day and 3-Day timeframes. I’ll look to reduce or exit those positions as we approach those cycle peaks.
🔔 Pro Tip: Price often seeks out stacked POC levels. If you’re a volume profile trader, keep $105K on your radar.
📌 P.S. For access to my custom indicators and deeper cycle analysis, check the description in my profile.

BTC targets.Last level was broken down and retested on 1H.
Now we are on last swing VAH.
If will not hold - next targets are on the way to POC magnet (green lines one the chart)
They are middles of 12H FVGs.

Panic Selling LINK? Here’s Your Master PlanBuckle up! LINK has been riding a relentless bearish trend for 113 days, ever since it kissed its peak of $30.94 back in December 2024. With economic uncertainty casting a shadow over the markets and fear gripping investors, the big questions loom: Is this the dip to buy while others panic-sell? Or is it wiser to sit on the sidelines? Let’s slice through the noise, dissect LINK’s chart like a seasoned pro, and uncover the setups that could turn this chaos into opportunity. Let’s dive in!
The Big Picture: LINK’s Bearish Blueprint
LINK is currently trading at $13, a far cry from its yearly open of $20. April has kicked off, and LINK has already surrendered the monthly open at $13.5, a critical level now acting as a brick wall overhead. Zooming out, the trend is unmistakably bearish: lower highs and lower lows dominate the chart. Adding fuel to the fire, LINK is languishing below the Point of Control (POC) at $14.32, derived from a 1.5-year trading range. This is a market screaming caution for bulls and whispering opportunity for bears, at least for now.
But charts don’t lie, and they’re packed with clues. Let’s map out the key levels, pinpoint trade setups, and arm ourselves with a plan that’d make even the most seasoned traders nod in approval.
Resistance Zones: Where Bears Sharpen Their Claws
1.) Resistance - The Golden Pocket ($13.6 - $13.7)
Using the Fibonacci retracement tool on the latest downward wave, the golden pocket (0.618 - 0.65 Fib) aligns beautifully with the monthly open at $13.5. Oh wait there’s more, this zone overlaps with a Fair Value Gap (FVG), making it a magnet for price action.
Trade Setup (Short):
Entry: ~$13.5 (if price tests and rejects this zone).
Stop Loss (SL): Above the recent swing high at $14.4.
Take Profit (TP): First target at $11.85 (swing low), with a stretch goal at $11.
Risk-to-Reward (R:R): A solid 2:1.
The Play: If LINK crawls up to this resistance and gets smacked down, bears can pounce. Watch for rejection candles (e.g., shooting star, bearish engulfing) to confirm the move.
2. Key Resistance - Cloud Edge & VWAP ($15.74 - $16.5)
The Cloud edge of my indicator sits at $15.74, while the anchored VWAP (from the $26.4 high) hovers at $16.5. A break above $16.5 would flip the script, snapping the bearish structure and signaling a potential trend reversal.
Bullish Scenario: If bulls reclaim $16.5 as support, it’s a green light for a long trade. Until then, this is a fortress for bears to defend.
The Play: No bullish setups here yet.
Support Zones: Where Bulls Build Their Base
1.) Support - Swing Low ($11.85)
This is the first line in the sand for bulls. A potential Swing Failure Pattern (SFP), where price dips below $11.85, sweeps liquidity, and reverses—could spark a long trade.
The Play: Watch for a bullish reversal candle or volume spike here.
2.) Major Support Cluster - The Golden Zone ($10 - $11.85)
This is where the chart sings a symphony of confluence:
Swing Low: $11.85.
POC: $11.33 (1.5-year trading range).
Monthly Level: $11.02.
Fib Retracement: 0.886 at $10.69 and 0.786 (log scale) at $10.77.
Psychological Level: $10.
Trade Setup (Long):
Entry: Dollar-Cost Average (DCA) between $11.85 and $10.
Stop Loss (SL): Below $10
Take Profit (TP): First target: $13.5 (monthly open), stretch goal: $20 (yearly open).
Risk-to-Reward (R:R): A monstrous 6:1 or better, depending on your average entry. This is the kind of trade we are looking for!
The Play: Patience is key. Wait for confirmation—think bullish engulfing candles, a surge in volume, or positive order-flow momentum. This isn’t a “hope and pray” trade; it’s a calculated ambush on the bears.
Market Structure: Bears Rule, But Bulls Lurk
Right now, LINK’s chart is a bear’s playground—lower highs, lower lows, and no bullish momentum to speak of. The $16.5 VWAP is the line in the sand for a trend shift, but until then, short trades take priority. That said, the $10 - $11.85 support zone is a coiled spring for bulls. If fear drives LINK into this range, it’s time to load the boat with longs—provided confirmation aligns.
Your Trading Edge
LINK’s 113-day bearish descent is a wild ride, but it’s not random chaos—it’s a roadmap. Bears can feast on rejections at $13.5 - $13.7 with a tidy 2:1 R:R short. Bulls, meanwhile, should stalk the $10 - $11.85 zone for a high-probability long with a 6:1+ R:R payoff. Whether you’re scalping the dips or swinging for the fences, these levels give you the edge to trade with confidence.
So, what’s it gonna be? Short the resistance and ride the wave down? Or stack bids at support and catch the reversal of a lifetime? The chart’s laid bare—now it’s your move. Drop your thoughts below, and let’s conquer this market together!
If you found this helpful, leave a like and comment below! Got requests for the next technical analysis? Let me know, I’m here to break down the charts you want to see.
Happy trading =)

$ZRO @LayerZero_Core Long & Short TradesCSE:ZRO @LayerZero_Core Long & Short Trades
#1 Long from TRP Blue Zone frontrun ☹️
#2 Long from Twin OB retest TP2 Hit ✅
#3 Short entry only if VAL is lost ⌛️
SHORT ENTRY = only if VAL is lost
SL = above old POC & Daily Open
------------
------------
As always, my play is:
✅ 50% out at TP1
✅ Move SL to entry
✅ Pre-set the rest of the position across remaining TPs
It's important to take profits along the way and not turn a winning trade into a losing trade.

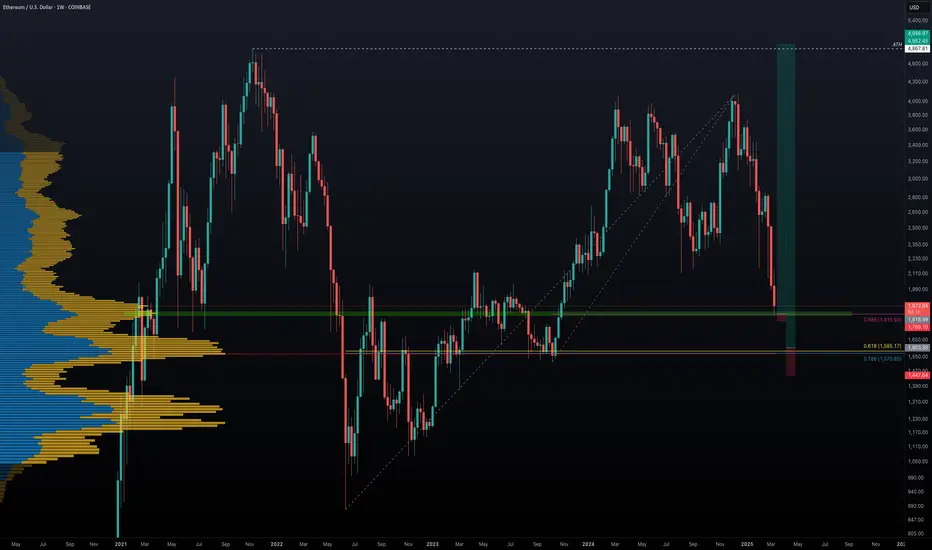
Ethereum's Potential Bottom: Could $5000 Be Next?Ethereum has experienced a significant 56% drop over the last 84 days. Has ETH found its bottom, or is more downside ahead? Let's break it down.
🔹 Fibonacci Retracement from October Low (2023) to December High (2024)
Starting with the Fibonacci retracement from the low of $1520.85 on 12th October 2023 to the high of $4109 on 16th December 2024, ETH recently hit the 0.886 Fib retracement at $1815.9 and saw a bounce. This area aligns with the Point of Control (POC) from previous price action, a potential signal that this could be a major support zone.
However, the real question is whether this is the final bottom, or if ETH will retest lower levels.
🔹 Further Fibonacci Retracement Analysis
Next, we take a larger Fibonacci retracement, from the low of $879.8 on 18th June 2022 to the high of $4109. The 0.786 Fib retracement at $1570.85 appears to be a critical support zone, as it also coincides with the POC in the volume profile of the entire market structure. This indicates that the $1570-$1600 region is a significant area of interest for buyers to step in.
🔹 Log Scale Fibonacci Confluence
To further strengthen this analysis, applying the same Fibonacci retracement on a log scale shows the 0.618 Fib retracement at $1585.17, very close to the POC and 0.786 Fib level, reinforcing this region as a major support zone.
🔹 High-Probability Long Setup
If ETH revisits the $1570-$1600 zone, this forms an ideal high-probability long setup with excellent risk/reward potential. A potential R:R ratio of more than 20:1 could materialise if this setup plays out and price targets $5000 as a take-profit level. The stop loss placement will determine the exact risk-to-reward, but the reward could be massive if this level holds.
💬 What are your thoughts? Will Ethereum find its bottom around these key levels? Excited to see how this develops! 🚀
JUP in Danger: Are We in for a Crash?JUP has been on a four-day downtrend, and it's starting to show its bearish side. The token has lost its yearly open, which was a major support level. Let’s break down the key support and resistance to see what the chart is telling us.
Support & Resistance
Resistance:
Yearly Open & Monthly Level: JUP has dropped below the yearly open at $0.8169 and the monthly level at $0.7427
Support:
Long-Term Range & Liquidity: JUP has been trading within a range for over 300 days, with a significant amount of liquidity below the low at $0.6328 from 5 July 2024.
POC: The volume profile shows the POC sitting at around $0.5, marking an attractive entry point for a long position.
Fibonacci Confluence: The 0.786 Fibonacci retracement level falls just below the key low at $0.431 (a level last seen on 12 February 2024), offering a great long trade setup.
Long Trade Opportunity:
Alarms are set, let's see if JUP drops to these key support levels. If it does, we could have a solid long setup on our hands.

#IPUSDT is gaining strength—expecting further upside!📈 LONG BYBIT:IPUSDT.P from $2.0510
🛡 Stop Loss: $2.0235
⏱ 15M Timeframe
✅ Overview:
➡️ BYBIT:IPUSDT.P is showing strong bullish momentum, trading near $2.0510, which could serve as a breakout entry point.
➡️ POC (Point of Control) at $1.8626 confirms the highest liquidity area below the current price, indicating strong buyer support.
➡️ The price is holding local support levels and is approaching $2.0510, a breakout of which could trigger further upside movement.
➡️ If the price holds above $2.0510, an upward push toward $2.0795 and $2.1155 is expected.
⚡ Plan:
➡️ Enter long on a confirmed breakout above $2.0510.
➡️ Risk management via Stop-Loss at $2.0235, limiting potential downside.
🎯 TP Targets:
💎 TP1: $2.0795
🔥 TP2: $2.1155
🚀 BYBIT:IPUSDT.P is gaining strength—expecting further upside!
📢 BYBIT:IPUSDT.P maintains bullish momentum. If the price holds above $2.0510, we expect further gains toward $2.0795 and $2.1155. However, a drop below $2.0235 may trigger a short-term pullback.

STOP LOSS HUNTING STRATEGY 8.8% OR 10% REWARDSHORT AT STATISTICAL STOP LOSS FROM MAJORITY
Will short at where most put their stop loss. This strategy is valid for me because this forex pair is indicating a bearish sentiment and the strongest ever recorded. But there is no previous statistics on such a price action. So I will short your stop loss which is around 160-167 (Aggressive account) and 170.5 (Buy and hold account).
I have no believe in a bearish continuation beyon that, it will just carry on going bullish and I'm not interested into shorting or buying this premium as it was bullish for decades and will not offer an exit strategy and/or a decent Stop Loss size
Factors of confluence:
- Anchored VWAP 0.618 above
- Monthly SIBI Fair Value Gap acting as strong resistance
- Previous POC levels
Take Profit:
- EMA200 Weekly chart
- Previous Fair Value Gap level
- Previous Month POC of June 2023 that hasn't been retested and had a strong bullish candle
- Quarterly Q1 Pivot Support Levels

HNT/USDT Trading ScenarioThe price chart of the asset shows a significant increase in trading volumes within a broad range from $2.875 to $11.153. From a volume analysis perspective, despite pronounced volatility, market participants continue to accumulate the asset within the current price corridor. At the moment, the asset's price is below the POC (Point of Control) level and has bounced off the support level at $2.875, which marks the lower boundary of the active range.
Given the current dynamics, a gradual price movement toward the upper boundary of the range can be expected, which may lead to a breakout of this level and further development of the upward trend. Such scenarios are supported by the fact that increasing trading volumes in the direction of the current trend typically signal its stability and the likelihood of continuation.

#BNXUSDT further bullish movement📈 LONG BYBIT:BNXUSDT.P from $0.6836
🛡 Stop Loss: $0.6436
⏱ 1H Timeframe
✅ Overview:
➡️ BYBIT:BNXUSDT.P broke through a key resistance at $0.6791, confirming buyer strength and signaling further bullish continuation.
➡️ Volume is increasing, indicating strong market interest in the uptrend.
➡️ POC at $0.4528 suggests that major liquidity was accumulated significantly lower, reinforcing the bullish trend.
➡️ The next upside target is $0.7396 , followed by $0.7873 if momentum continues.
⚡ Plan:
📈 Bullish Scenario:
➡️ Enter LONG from $0.6836 if the price maintains support above this level.
➡️ Manage risk with Stop-Loss at $0.6436 to protect against downside moves.
🎯 TP Targets:
💎 TP1: $0.7396 — first resistance level, potential profit-taking zone.
🔥 TP2: $0.7873 — strong level where buyers may exit.
🚀 BYBIT:BNXUSDT.P Expecting further bullish movement!
📢 If the price BYBIT:BNXUSDT.P holds above $0.6836, further upside toward $0.7396 and $0.7873 is likely.
📢 However, if it drops below $0.6436, the bullish setup may be invalidated.

KAVA/USDT Trading ScenarioThe asset's price, like most altcoins, has undergone a significant correction and is currently trading near its local low. However, despite the decline in quotations, the market is experiencing a noticeable increase in trading volumes, indicating strong demand from buyers. A confident absorption of supply during the downturn suggests potential interest in KAVA from large players.
From a volume analysis perspective, the price is within the Point of Control range, reflecting the highest trading volume in the current price corridor. This confirms substantial market participant interest and the formation of a liquidity zone, which may act as support if consolidation continues. If volumes continue to rise and the price holds above key levels, this could signal a trend reversal and the development of an upward momentum.

Anticipated ZEN Drop Hits Target – Long Now?The anticipated drop I was watching has played out, providing excellent long setups across many coins, including ZEN. ZEN retraced perfectly to the POC at $17.07, aligning with the fib retracement 0.85
This confluence makes it an ideal long setup, offering great potential gains
Long Entry: $17.3
Target 1: $21 (R:R 2.5)
Target 2: $27 (R:R 6)

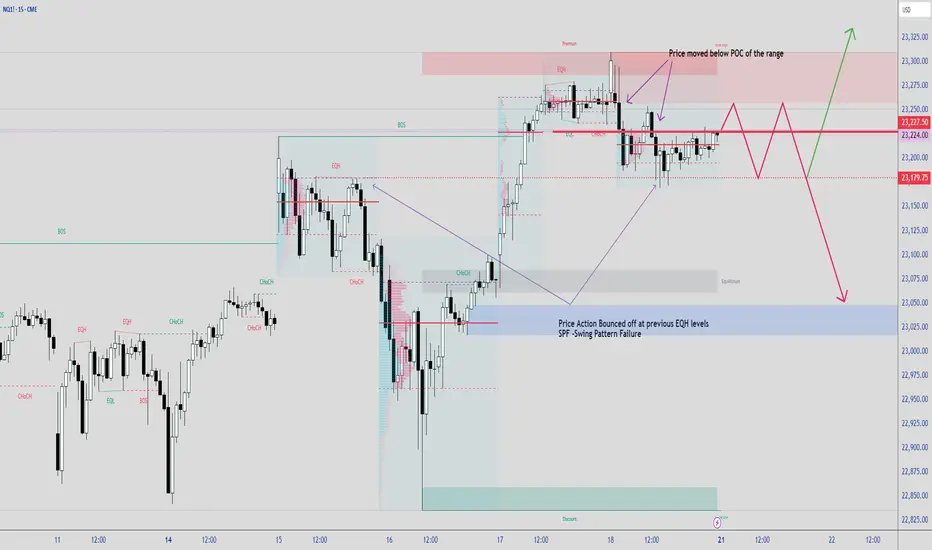
ETH Rejected at POC – Bears Eye $3000 againOver the past two days, Ethereum struggled to maintain momentum above the Point of Control (POC) of the current range. Price action formed wicks above the POC but closed below, signaling clear rejection at this level.
Key Support Zone
The $3000 area holds significant support, bolstered by several confluences:
Fibonacci Levels: The 0.786 fib retracement ($3045) aligns with the old 0.618 fib retracement ($3025)
4H Bullish Block: A strong demand zone on the 4-hour timeframe supports this level
Trend-Based Fibonacci Extension: 1:1 extension lines up perfectly with the 0.618 fib retracement
Psychological Level: The round number at $3000 adds psychological strength to this support
Short Setup:
Entry: POC of the range
Stop Loss: Above the recent high
Take Profit: $3000 zone
Risk-Reward: 3:1, offering a solid trade opportunity
Long Setup (Confirmation Needed):
Entry: Between $3025–$3000, upon bullish confirmation
Stop Loss: Below $2900
Take Profit: open

APE/USDT Trading ScenarioThe asset is currently trading 95% below its all-time high (ATH). Unlike most cryptocurrency market categories that are showing growth despite significant corrections, the NFT and metaverse segments remain in the shadows, not showing significant dynamics.
APE is currently near its all-time low, and in terms of volume profile, there is interest from market participants, as well as accumulation of positions in the current range. Fundamentally, the token is still associated with one of the most famous projects in the NFT sphere – Bored Ape Yacht Club (BAYC), as well as with the Otherside metaverse. However, it has fallen outside the zone of active investor attention amid the rapid growth and popularity of meme coins.
This asset deserves close attention, as it has the potential for significant upward movement.

Bearish Breakout: ZEN’s Path to $26 RevealedZEN has broken below both the daily open (dOpen) and weekly open (wOpen), signaling increased bearish momentum. The previous support levels now act as a Support/Resistance Zone, and bullish recovery requires reclaiming both dOpen and wOpen with significant volume. However, the current setup suggests further downside toward the $26–$25 range, which aligns with multiple confluences and the target from the Head & Shoulders (H&S) pattern.
Confluence for $26–$25 Support Zone:
Fibonacci Retracement (0.618): The key retracement level provides a strong support area.
$25 Key Level: A psychological and technical key level with historical significance.
Point of Control (POC): The POC from the previous trading range aligns perfectly with this zone.
Trend-Based Fibonacci Extension (1.272): The projected extension supports the target.
Fibonacci Speed Fan (0.777): Adds further confluence for this price level.
H&S Target: The projected target of the confirmed Head & Shoulders pattern coincides with this zone.
Outlook and Strategy:
Short-Term Bias: The bearish trend remains dominant unless bulls manage to reclaim dOpen and wOpen with strong volume.
Target Area: The $26–$25 range serves as the most probable area for a bounce or reversal due to multiple technical confluences.
Next Steps: If price reaches the support zone, look for a high-probability long setup with confirmation through increased buying volume, bullish candlestick patterns, and alignment with key indicators.

VIRTUAL at Crucial Resistance: Short Setup with 18% Potential GaThe price is approaching the high from December 16th. A short opportunity arises only if the price gets rejected with confirmation at this level.
Target Levels:
Weekly Level: The next major support lies at $2.711, which aligns with the Point of Control (POC) observed on the Fixed Range Volume Profile (FRVP).
Support Zone: The anchored VWAP (yellow line) is currently at the same level, reinforcing $2.711 as a strong support zone.
Short Setup:
A short trade from the current high, upon rejection, could target a potential drop of +16% to +18%, offering a favorable Risk-to-Reward (R:R) ratio.
Key Condition: Entry should only be considered if clear rejection confirmation is observed at the high. Without confirmation, this setup remains invalid.

ILVBTC_2X, 5X and more PotentialILVBTC is taking taking support after a long downtrend.
Entry can be taken now while the pair is available in discounted price.
Easy 2X potential until trendline resistance
5X potential until reaching POC
further until reaching ATH
Do proper risk management.
Trail SL

Why Buy LLY?A textbook spike trade... that's why!
Every morning the stock market open gives us opening volatility spikes on the first 30 minute bar. Most are noise but when that rare one comes along that fits my rules AND has multiple matching confluences... it's time to "Strike at the Spike!"
This setup has going for it:
At a 50% Retracement of the recent trend (from November 18 - December 4)
At the top of a Gap Level
At the Volume Profile Point-of-Control for the last year of price action (see below)
With a Spike that my indicator shows >80% ATR Clearance I consider the baseline for a trade; this one is 150% so it definitely fits the rules. I would take a spike if there were only 2 of those matching levels above. Targeting the local high for the first take profit at 834.
Here is the Daily chart for just how key this level is:
Full disclosure: NYSE:LLY is and has been one of my biggest holdings; having owned the stock for over a decade.

LDO/USDT Trading ScenarioAfter reaching a new high of $4.027, the price of LDO significantly declined, dropping to $0.863, which corresponds to a fall of over 78%.
According to the volume profile, the asset broke through the POC volume level at $2.4.
Special attention should be given to the increase in volume in the range of $1.026 to $1.135. This range shows active growth and is approaching the POC level, which could signal a potential reversal and the start of an upward trend.

ETH/USDT Trading ScenarioAs of writing, the asset is trading near the support level of $2130. This level was established following a sharp decline and an attempt at a quick recovery.
If this level is breached, further price drops are likely, with the next support level being the significant volume-based Point of Control level at $1585.25. This zone is attracting heightened attention from market participants, which may contribute to a price rebound.
A break below the $1585.25 level could be seen as a potential buying opportunity, both for speculative and long-term investment purposes.
