NEO/USDT is lloking for the reversal. ShortLooking at the number of factors BINANCE:NEOUSDT is preparing for the trend reversal and potential downward move. There is a number of reasons for this.
1) Price/Volume and Price/RSI divergence.
2) This divergence occurring next to the important resistance zone of $22.90
3) In the lower timeframe (2H) there is a "Sell Zone" between $22.5 - $22.9
Trading Plan:
When the price will reach the sell zone it is important to monitor the strength of Buyers and Sellers. There is a possibility that price will spike above the $22.9 level to collect the stops of short-sellers prior to the downward move. After that, there is a good chance that the price will drop below the 22.55 mark, retest this level as resistance and will start its decline.
The first take-profit target would be located in the area of $20-$21 and at this point, you can fix some position moving the stop-loss towards the break-even point. After that, If there will be no buyer on the market the price may continue its decline towards the POC of the horizontal channel.
Below POC level we may see the formation of some buying strength, however, the major support area is located at around $16.7 - $15.8
Best of luck with your trading.
POC


BTC - VPVR & FIB ComboInteresting, if you look align the FIB with the VPVR and the top, you get complete alignment with my chart, interesting.
POC is still a possibility, as you know volume profile'rs, the POC is a magnet.
This Chart is becoming more interesting everyday...
I need a coder, willing to hire, if the price is right...lol.

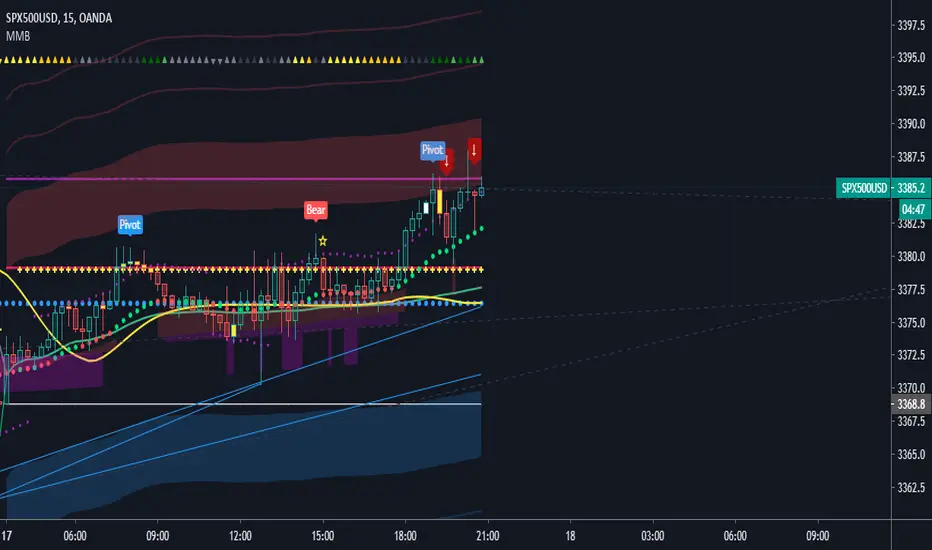
SPX is consistently staying above yesterdays POCspx is showing the possibility of up move from here as long as its staying above yesterdays POC.
XAUGBP Settles at 30 minute POC. Augurs well for bullish moveThe clear "P" shape of the profile and recent news of high profile investors selling banks and buying gold miners suggest quite a strong opening this week in gold.
I find the GBP gold price to be less prone to being pushed around by competing trading strategies that can muddy the USD gold price.
Significant upside to above GBP1580 while unlikely, cannot be ruled out this week, on my read.

BYND- Danger zoneShort it at the supply zone (132 to 140) and close the position at the target lvl coincides with SMA 200!

XRP Weekly AnalysisXRP on the weekly chart is still in an overall downtrend but it’s showing bullish signs. Currently trading just around it’s 20ema, also it’s point of control YTD as seen on the volume profile . If we can close above this with above average volume (+104.655M), we can expect more bullish sentiment to follow. I’d be looking to see a brief some resistance around the downward trending tend line and high volume node before resistance around the 50ema
Other bullish signs:
XRP is forming a morning star pattern bouncing off its value area on the volume profile and an upward trending trend line .
Bullish engulfing bar trading the most volume since the week of April 27th (141.894M) which was at the top of its last mini bull cycle before the last pullback which is now over if we use this weeks bullish engulfing bar as confirmation after last weeks doji .
Price Volume Trend is spiking upwards.
Thoughts welcome :)

PK buy1. PK is in a strong support level
2. respected MA20.
3. Oversold RSI.
i bought a 1% risk position, and will add more (averaging) if it goes lower.
Next buy target is the strong weekly + vprofile level. This level is the point of control for volume profiling indicator.
Great risk/reward.


EURUSD AnalysisEURUSD Analysis for 5/11/20
EURUSD is showing a bias to the downside. Multiple candles have failed to break the volume profile POC to the upside which gives even more confirmation that the pair should be short. MACD < 0 and it seems that it will crossover the signal the line giving another confidence booster. I hope you enjoyed the analysis and do not forget to hit the like button!

SPCE ready for lift offSPCE running on earnings this AM - about to clear top edge of POC through a low volume node...
This will clear LVN to 22.5 then work its way to 24.50 over time

LTCBTC Sellers in control| Technical Confluences| S/R FlipEvening Traders!
Today’s Technical Analysis will focus on LTCBTC which is testing a key trade location with multiple technical confluences.
Points to consider,
- Sellers in control
- Key trade location being tested
- Local support next viable target
- RSI neutral
- Stochastics in lower regions
- Volume climax nodes
LTC breached key technical structural support (now resistance) confirming that sellers have gained control. LTC is currently testing a key trade location with multiple confluences, the .50 Fibonacci, the 21 Week MA and the Point of Control. It’s viable to say that LTC is more probable to test local support due to heavy resistance; this will put in a lower high.
The RSI broke out of its wedge; this was in confluence with the oversold bounce, now is currently neutral. The stochastics on the other hand is trading in the upper regions; it has lots of stored momentum to the downside.
There has been a clear volume climax however with lack of bull volume follow through. This indicates absence of bull pressure, putting more emphasis on testing lower lows.
Overall, in my opinion, LTC is likely to test lower regions; this is due to heavy technical confluence at the current trade location which is also in direct proportion with the bearish sentiment.
What are your thoughts?
Please leave a like and comment,
And remember,
“Accepting losses is the most important single investment device to insure safety of capital.” – Gerald M. Loeb

ETH- Pullback or march toward the NEXT MAJOR RESISTANCE LVLHello everyone!
BTC dominace lvl has gone down a little and, we start to see more trading volume flow into retail's favorite crypro exchange coinbase as its trading volume increased 50% recently.
Retail money is what makes the uptrend move sustainable!
VPVR looks bullish as the price pierced through VA and both long term and short-term POC with long term trend line acting a strong support below.
However, ETH is currently facing long term fib resistance (32.8) and previous support lvl .
Furthermore, many indicators indicate the overextended status ( bollinger & ichi) and oversold status hovering around 75-80 on both daily and weekly timeframe
In terms of magnitude, 8 straight weekly green candles is probably overheating.
Next major resistance lvl is around 360. Buy on the dip within the buyzone if the price pullbacks.
Please like and follow me if you find my analysis useful. Much appreciated!

Increased Volume Suggests a Whale is Accumulating EnigmaAs bitcoin formed a pinbar that might and likely will lead to small pullback, it is a good opportunity to buy trade an alt against btc. Enigma is dancing close to its point of control. Even though there is a multiple rejection pattern, the increased volume suggests, it is only a big guy accumulating this coin.
I am already in and I expect to collect profits on the second target or higher.
I will be rating all my published analysis in 2020 transparently. This one is going to be considered successful if the price hits its second target with an ROI of 1:3.2
Good luck!

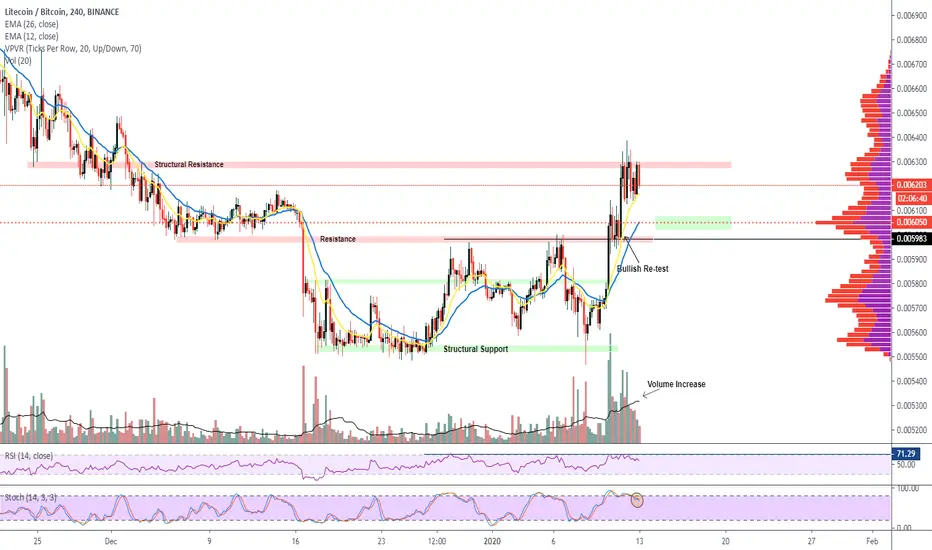
Structural Resistance|Market Structure Change|Volume Increase Hello Traders!
Welcome to another update,
Today’s chart will be on LTCBTC which has broken key levels negating the market structure. LTC is probable to reach higher levels before a bullish confirmation of the POC.
Points to consider,
- Trend change in fruition
- Major resistance broken
- EMA’s holding price
- Stochastics in upper regions
- RSI hitting resistance
- Volume increase
- POC bullish retest
LTCBTC trend change is coming to fruition as a new higher high is being established from local lows. Major resistance has been broken, a much staunched level that was confirmed with a bullish re-test.
EMA’s holding price as support must hold true for a continued bullish bias upon retests of key levels. RSI is trading at resistance; a return to neutral territory is probable in the near future.
Volume has increased visibly, confirming breaks of key structural levels; LTCBTC needs to sustain such volume for continuation in trend.
Overall, in my opinion, LTCBTC has clear levels to watch and break. A retest of the POC will be healthy as it will cool of indicators such as the RSI and Stochastics before another leg up.
What are your thoughts?
Please leave a like and comment,
And remember,
“You become fearful the moment you identify with fear. But once you begin seeing it as an impersonal changing phenomenon, you become free.” ― Yvan Byeajee,
XEM/BTC - 625 sats Hey everyone! Consolidation leads to?
Here is a great example where the price just seems to be getting that last fuel before moving up.
The RRR (Risk-Reward-Ratio) of this setup is considerably high, so the probability of failure becomes greater. Nevertheless, a worthy look as you can always chose to downsize your risk.
Lastly, not how the POC (Point of Control) is acting very clearly as resistance. Now we just need to break it :)
Take care,
Vlad The Crypto Trader


BTCUSD thinking downSo I will try out this set up:
Limit sell the red zone
Target 6860
On bearass side:
Last day POC should act as resistance
Potential retest of flipped S/R level
Last day bullish impulse has been completely rejected by now
On bullass side:
Price at support
Good luck

Come dowwwn BABABABA has been in a clear uptrend with a series of higher highs and higher lows but there are signs that it needs to correct to the downside short term- 177 is a reasonable target. We see from the graph several signs; price is above the point of control (red line on the volume profile, sufficient Fibonacci extensions from the most recent impulse wave have been met (the 1.618 can be used as a stop for any shorts), MFI is at a very high reading (unprecedented in the last 6 months), and the stock is currently just over 2 ATR (4.53 x 2 = 9.06) away from the mean where the mean is defined as the middle of the Keltner channel. Based on a .618 retracement of the most impulse wave up, the POC, and the mid line of the Keltner channel there is a high probability that 177 will hit. Furthermore there seems ot be a clear indication that the stock is under distribution by institutional investors per the Accum/ Dist line which is showing clear divergences with respect to price, this is shown in to separate ways on the graph. As always no matter how sure one is of a stock going in any given direction there is always a double digit chance it will not. Should you short please have a stop in place and/ or wait for 2 - 3 consecutive trading days with no new high made. Please ask any questions

Bitcoin Analysis on the WeeklyGood evening traders! Bitcoin is bouncing off of $7,700 support on the weekly, holding strong so far. Interestingly, starting in August, Bitcoin is following an odd green, red, red, red pattern weekly. So far, we appear to be in a green candle. Not that I can say I have firm reason to believe this will continue, but I would be skeptical of any red candle closes below $7,700. If I were in Bitcoin, my stops would be set up to protect the huge gap between $5,253.74 and $7,700. $10,148.51 is the next High Volume Node going in the opposite direction. It is noteworthy that as we zoom out on this chart, there is a more historic high volume node at the $6,400, which may provide support. These figures may seem far fetched, but we've seen some huge price moves in August and September, only time will tell if Bitcoin continues to bounce.
Keep an eye out for my daily and 4h charts for some short term fun! I'll link in the comments.
Disclaimer: This is NOT trading advice! These are merely my opinions that I have posted for educational reasons only. I hope you all kill it, but I am not responsible for any financial losses. Thanks for reading!

XRP - The Scenario We See On Short Term. ENJOY!IF THE SELLWALL AT 0.27 EURO WON'T CHANGE AND IN ACCORDING WITH FIBONACCI, POINT OF CONTROLL, STOCHASTIC, DOWNTREND CHANNEL AND SUPPORTS/RESISTENZ: WE SEE THE FORMATION OF A DOUBLE BOTTOM WHICH BRINGS THE PRICE ACTION AT THE LEVEL O.27 EURO WITH A FOLLOWING RETRACEMENT.
LET'S SEE WHAT'S HAPPEN.
LET US KNOW IF YOU AGREE WITH IT OR NOT... LET'S TALK ABOUT.
MANY THANKS AND ENJOY !
