ADA/USDT Trading ScenarioBelow is the price movement scenario for ADA.
After significant consolidation of the asset in the price range between the support level at $0.2327 and the resistance level at $0.4582, an impulsive breakout of the resistance level at $0.4582 occurred at the end of 2023. This caused a subsequent establishment of a local maximum at $0.6883.
Despite the overall positive trend in the cryptocurrency market and steady growth of BTC, the asset experienced a correction, dropping by more than 30% and testing the broken level of $0.4582. This was followed by an attempt to rebound; however, from the volume profile perspective, the asset encountered volume resistance.
We expect further development of the scenario for acquiring the asset. In case of a decrease in the asset's price and subsequent retesting of the resistance level at $0.4582, as well as holding this level, together with the shift of the global POC to this mark, we will begin to form positions with further holding.
POC

FXS/USDT Speculative TradingBelow is a speculative deal on FXS/USDT.
After the consolidation period, the asset has begun to demonstrate an upward trend, showing a strengthening of its position in the market. During this period, the asset's price bounced off the inclined support level three times, indicating strong buyer interest at this level.
As of writing, there is a consolidation phase around the Point of Control level, which may be a sign of a temporary slowdown and accumulation of positions for further movement. At the same time, a clear support level has formed at the price of $10.916, which has already been approached three times.
Such price movements can provide opportunities to enter the market.
At the current prices, there is a possibility of buying the asset with subsequent holding of the position in anticipation of overcoming the resistance level at $10.916 and further movement towards the $12.416 mark. The expected growth will be more than 30%. If the trend strength and positive market dynamics are maintained, we plan to hold part of the position for further participation in the movement.

AMZN in a triangle pattern LONGAMZN on the 15 minute time frame is in a relative symmetrical triangle pattern. A volume
profile and intermediate term anchored VWAP are overlaid. They validate one another since
the POC line and the mean anchored VWAP line up. Price is below both of them. My forecast
is that price will rise and temporarily so sideways in the high volume and volatility zone
of VWAP / POC and then ascend higher as that tug o war is finalized. My long target for now
is 170.35 as the top boundary line of the high volume area of the VP. This is a good trade
for shares on margin to get some juice into the trade. I will instead take call options for
March 16th striking $ 172 for some leverage and beyond linear RIO. AMZN is good to go.
Admittedly, this is an early bird trade. I see the risk as minimal.

TRX/USDT Trading Scenario: TRX Accumulation
We are considering the scenarios of TRX development and initiating purchases of the asset.
Since March 2023, the asset has demonstrated a noticeable upward trend. It surpassed the 200-day moving average level, which is a strong indicator. TRX’s price has increased by more than 120% since reaching the $0.12367 mark. This indicates significant attractiveness of the asset during this period.
It is also worth noting that while the price of BTC is decreasing, this asset continues to show stable growth. This may indicate its strong position and potential for further growth, despite the overall market direction.
However, given the current market scenario, there is a possibility of a correction in the price of the asset along with the overall market movement.
We are considering the possibility of entering a position on the TRX correction. We plan to start accumulating a position when the price reaches around $0.10528 and consolidates above this level. If the price declines to the sloping trendline at approximately $0.09689, we might also consider adding to the position.
This approach is based on the desire to enter a position at an optimal level that will support our risk management strategy and increase the potential profitability of the trade.

XRP/USDT Investment OpportunityWe are considering an investment position in XRP.
After a explosive growth of over 98% in a single day in July 2023, the asset's price reached $0.9378. This was followed by a swift return to pre-spike levels, then a jump from $0.4597 to $0.7490, resulting in a significant increase of over 60%.
Currently, the price has returned to the reversal zone, representing the upper boundary of a long consolidation period that lasted for a whole year. During this consolidation period, there was high trading volume, indicating significant attention and activity from large market participants.
In light of the current market dynamics, we are analyzing the possibility of acquiring the asset within the consolidation range for long-term holding. In case of further price declines, we also consider additional purchases of XRP, complementing our portfolio in line with current trends and prospects.
This strategic decision aims to capitalize on potential growth opportunities and ensure portfolio stability amidst market volatility.

AAVE Bullish and aims 5% Higher!As you see on the chart, AAVE has reclaimed all support levels and looks to test the major liquidity levels above which is the POC and Weekly level above.
I would expect a nice rejection after that level is reached.
Calculate Your Risk/Reward so you don't lose more than 1% of your account per trade.
Every day the charts provide new information. You have to adjust or get REKT.
Love it or hate it, hit that thumbs up and share your thoughts below!
This is not financial advice. This is for educational purposes only.

BEAMX/USDT Trading IdeaBelow is a speculative idea for the BEAMX/USDT coin pair.
After reaching its historical maximum in mid-December at a price of $0.027332, the asset experienced a correction, resulting in a decrease of more than 38%. Following the completion of the correction, there was a consolidation phase.
At present, a resistance level has been identified at $0.023531. Additionally, an inclined support level has been detected, indicating stability in the asset within this price range.
As part of the trading strategy, we anticipate a potential third approach of the price to the resistance level at $0.023531. If this scenario is confirmed with active trading near this level, we consider entering a position with the goal of surpassing the resistance level and further moving towards the historical maximum, potentially leading to a 15% increase.
In the event of strong market support, there is also consideration for breaking the all-time high at the price level of $0.027332, which could be viewed as a potential entry point.

INJ/USDT Speculative TradingWe are considering a speculative trading idea on the INJ/USDT coin pair.
Since the beginning of December 2023, there has been a noticeable increase in the asset, starting from the $16 level and reaching a maximum of $45. This growth amounted to more than 179%, indicating high interest in the asset from buyers.
However, after reaching the $45 mark, the asset underwent a correction, decreasing to the $29 level. During the correction, there was a false crossing of the 200-day moving average, followed by a sharp increase. The second touch of the $45 level occurred on January 9, forming a resistance level, indicating the significance of this level in the current context.
Considering the current trend, we can predict that the asset will consolidate near the resistance level at $45, with a subsequent breakthrough and establishment of the price above this level. In this case, there is a possibility of opening a long position on the asset upon retesting the $45 level and then holding the asset until the price reaches around $54, which could provide additional profit opportunities of around 20%.

CRV/USDT Accumulation PhaseBelow is the description of the accumulation phase potential development of the CRV/USDT cryptocurrency pair.
After reaching a local minimum in November 2022, when CRV was trading around $0.3982, there was a convincing upward movement that led to a significant increase to $1.29. During this period, the asset demonstrated a growth of more than 225%. Subsequently, the asset gradually declined, reaching a new local minimum at $0.3882.
During the price decrease, a descending trading channel was formed. At the moment, the asset is testing the upper boundary of this channel, which is occurring at the level of $0.6382.
Considering the current trends, we can assume that the asset is preparing to overcome the upper boundary of the trading channel. This could happen after a small corrective pullback to the average price within the descending channel.
Following a successful breakout above the upper boundary of the channel and a subsequent retest with a possible bounce from it, a positive signal for further growth of the asset can be expected. This scenario could indicate movement towards a price maximum at the level of $1.29.

AAVE/USDT Trading IdeaWe're discussing the development idea in the accumulation phase for the AAVE/USDT crypto pair.
In June 2022, there was a notable decline in the asset, hitting a local bottom of the existing bearish trend at $45.80. However, it confidently surged from this level, reaching $115.27, showing over a 150% increase . Later on, the asset chart displayed the formation of a descending triangle, accompanied by significant trading volumes.
Currently, we observe AAVE's price breaking out of the described triangle and starting to trade within an ascending channel , confined by values from $115.27. This might indicate a potential continuation of the accumulation phase with a possible price squeeze toward the local maximum. Hence, the present trends and price chart structure suggest interesting dynamics in the asset's movement.
Considering these trends, it's conceivable that the asset is preparing to surpass the local maximum of $115.27, paving the way for further upward movement. The initial target for this upward trend could be the strong resistance level at $200. If this level is successfully breached and bullish pressure is sustained, the subsequent potential target could be around $260.

BTC/USDT ScenariosWe are considering two possible scenarios for the development of the situation with BTC.
At the end of October, following a significant impulsive rise of BTC from $29,614 to $35,300 , there was an increase of more than 18%. In the following month, an ascending trading channel was observed, which was successfully broken after testing the upper boundary at $39,670. As a result of the breakout, the asset reached a price level of $44,436 , marking an increase of more than 11%.
The first scenario focuses on the current overbought condition of the BTC price, which suggests the potential for a correction. There is a possibility of a downward corrective movement until reaching the upper boundary of the trading channel, located around $40,600, with a subsequent potential reversal. If the price remains stable at this level, there is consideration for opening a long position on BTC.
In the second scenario, a significant price decrease towards the level of the highest volume POC at $37,100 is anticipated. From this level, a price reversal might occur, followed by a continuation of the upward movement. If the price remains stable at this level and there are signals for a reversal, we are also considering the possibility of buying BTC.

USDT/DOT Speculative Trading IdeaBelow is a speculative trading idea for the DOT/USDT pair.
Currently, the asset's price has broken through an inclined level after updating the minimum at the price of $3.550 within the current global downtrend. After reaching the $3.550 level, there was a rebound, amounting to over 41% to the current price. This situation indicates an attempt to break the local downtrend in effect in 2023.
As we anticipate a price correction, we identify two entry points for the asset to continue the upward movement within this correction.
We place our first limit orders to buy DOT at price levels of $4.550 with a growth potential of 37% to the price level of $6.273.
We place our second limit orders to buy DOT at price levels of $4.220 with a growth potential of 50% to the price level of $6.273.

USDT/BTC Speculative Trading IdeaBelow is a speculative trading idea for the BTC/USDT pair.
As of writing, there’s a consolidation and price chart compression towards the established local resistance level at a price of $35,195, following an impulsive 31% price increase from $26,794 with a rebound from the 50-day moving average.
Within the framework of this idea, we propose to consider the possibility of buying BTC at a price of $35,195.
We do so with the aim of continuing the BTC price rise towards the resistance zone located near the POC volume level, corresponding to the trading range of the first half of 2022. The approximate target for this trade is $38,440.
An additional factor supporting this decision is the cumulative delta, indicating sustained buyer interest. The potential for this trade is estimated at 9%, with a stop-loss set at the 3% level, which amounts to $34,100.

BNT/USDT Speculative Trading IdeaBelow is a speculative trading idea for the BNT/USDT pair.
As of writing, the asset's value has decreased by more than 50% after a strong growth of 240%. The asset meets our expected indicators and reaches a high of $1.9546 .
We decide to acquire the asset at the current price of $0.8426. The 50-day moving average serves as support. A decrease in seller activity is also noted, and the price is being held by buyers according to the cumulative delta. The volume profile also reflects market participants' interest in this asset at this price level.
The first target of our trade is to reach the mirror level at $1.0500, with a profit percentage of over 20%. Upon reaching this level, we plan to close the majority of our position, which will be 80%.
The second target, intended for the remaining 20% of the position, is to reach a price of $1.2163 in the event of a breakout of the mirror level. The expected profit at this stage will be over 40%.

MES Price ActionPrice is hovering right around POC so it makes it difficult to take a trade here. In our group we use a 6 point POC rule. Where we need to be at least 6 points in either direction of POC or the tendency is for price to revert back to POC.

Overnight Rejection, Again?Bare with my ta abilities...
POC and 50% Fib being vs overnight money? Would like to see if retail can push above this
No suggestion. DYOR.

🔴 #BTC short setupThe BTC chart looks bearish.
We've formed a pattern of a small base under a larger one, with a small base also located under the BoS short level at 29400.
I'm considering a scenario where price returns to the high-volume level of the larger base at 30262, and tests the imbalance range (30530-30900) from above before moving downward. At the high-volume level, I'll be searching for an entry into a short position with the following targets:
TP1 - 29285 - high-volume level of the small base
TP2 - 27660 - 0.5 imbalance of the 4-hour and daily candle
TP3 - 26050 - 0.5 imbalance of the daily candle and high-volume level at 25790
I will place the stop loss beyond the imbalance boundary at 31030.

WHAT'S HAPPENING? ⚡️ SUPPLY AND DEMAND IN LOCKSTEP 😢In this video I explain the current state of the Bitcoin market as seen through the lens of the latest pattern found in the forecast model, "The Lightning Volume". The Federal Reserves interest rate policy continues to create considerable headwinds for the Bitcoin price. When could it end? Watch this video and let me know your thoughts? Thanks for watching!

TBT Treasuries Bear Leveraged ETFTBT is going to take another swing now that interest rates are going up.
Fundamentally, Treasuries and other bonds will go down on their real face value
because their yield is lower than the new going rate. Inverse EFTs like TBT
will go up when Treasuries go down.
On the w Chart chart, price is sitting above the POC line of the volume profile
where there is support and high volatility. Above the line shows buyers in control
ready to move price higher.
The Awesome Oscillator flipped green today after the fed news showing that selling momentum
has been replaced by buying momentum ( capitulation at the bottom).
The volume indicator shows a clear uptick in buying volume.
TBT offers options to further leverage this trade.
I will take a call options position of several contracts for the 5/12 expiration at a strike
about 5% below the current price. I expect 100% return on risk by next Monday and more
after that.

Daytrade Plan for XAUUSDFollowing the previous XAUUSD post, the price pattern has completed the descending triangle formation and is reaching to the recommended TP2 zone, where traders should definitely start to take profits.
The reason why we should start scaling out of sell/short positions here is because there are a cluster from multiple indications on this demand zone at 1900 area including:
1) POC from fixed range volume profile of the previous swing low-swing high
2) 161.8 target from fibonacci after the consolidation of descending triangle formation
3) EMA-200 day period
Evidently, this demand zone is considered strong based on the cluster of 3 technical indications
There will likely be a technical rebound near this area, where we can trade against the trend for a very short trade. However, it would not be wise to place a trade right away.
The price actions should begin to form a range of consolidation and show a lower high first in 15m timeframe before placing a trade.
SL: at the lowest point in 15m timeframe
TP: at two cayenne lines are acting as minor resistances and should then be the TPs for this short trade plan: 1910, 1917 respectively.
Again, this short trade plan is trading against trend which can be very risky. Therefore, do not forget to put a stoploss and place in proper risk management on your positions as always

Potential BTC Short Between around 30.3k and 30.8k are some fresh resistance levels that are yet to be hit.
If price comes into this box with the criteria frp, listed I will take a short risking 1%-2% of my entire account.
*1hr money flow (Red/green oscillator
waves) coming down and crossing the 0 line
*1hr momentum creating a divergence (Blue
oscillator waves)
*1hr vwap (Yellow line on oscillator) curving down
to ward the 0 line.
*12min and down momentum divergence
*12min and down moneyflow coming down
Tp 1 - Value area high at 28870
Tp 2 - point of control at 28000
Tp 3 - Value area low at 26900
Leave the rest to ride

SPY's Triangle Reflects the Chop, but Battle Lines ConvergePrimary Chart : 195m chart of major US index, the S&P 500 represented by the SPDR® S&P 500® ETF Trust, with symmetrical triangle pattern and anchored VWAPs
SquishTrade has posted fewer analyses lately as markets have been quite uncertain and choppy. When there is less certainty in the analysis, there should be less to say. And prudence dictates avoiding confusion by creating analyses and forecasts when trends are unclear and markets remain choppy.
This post will not present a directional view given the high level of choppiness and uncertainty. Instead, it will show where the battle lines, so to speak, are drawn. The market may deign to inform us where the next trend move will be when key levels begin to break. And sometimes, markets will not inform us until after a few false moves—in other words, lies come before the truth perhaps. Indeed, this market has been difficult to trust even for directional moves under one or two days' time.
First, the smaller triangle within the larger triangle will likely break even if a false break comes before the real one. This may coincide with price breaking to the other side of key anchored VWAPs shown as well. This may signal whether the upper or lower trendline of the larger symmetrical triangle will be tagged next. But until the upper or lower trendlines of the triangle are broken decisively, i.e., not a false break, the trend may remain unclear.
Rate volatility has perhaps exacerbated the uncertainty in equity markets to an even greater degree as rates on the shorter end of the curve have whipsawed dramatically, e.g., 2-year note and yield both whipsawing along with Fed Funds rate futures and other interest-rate products and instruments like the Eurodollar futures.
Here are the key points to watch in the coming weeks:
The longer-term symmetrical-triangle pattern shown on the Primary Chart
The smaller triangle within the larger symmetrical triangle, shown on Supplementary Chart A below
Supplementary Chart A
The key anchored VWAPs, Supplementary Chart B, that are converging and compressing similar to the very nature of the larger triangle's own converging trendlines, though VWAPs are more fluid and curvy
Supplementary Chart B
The POC on a daily chart has remained around 395-396 for quite some time (not shown), and this remains a key pivot for SPY
The POC on a weekly chart has remained around 393.70-394.90 for quite some time (not shown), reinforcing the key pivot on the daily at 395
Several Anchored VWAPs and Fibonacci levels all coalesce around 390 (ranging from 389-392); a key gamma level on PSY also lies here.
________________________________________
Author's Comment: Thank you for reviewing this post and considering its charts and analysis. The author welcomes comments, discussion and debate (respectfully presented) in the comment section. Shared charts are especially helpful to support any opposing or alternative view. This article is intended to present an unbiased, technical view of the security or tradable risk asset discussed.
Please note further that this technical-analysis viewpoint is short-term in nature. This is not a trade recommendation but a technical-analysis overview and commentary with levels to watch for the near term. This technical-analysis viewpoint could change at a moment's notice should price move beyond a level of invalidation. Further, proper risk-management techniques are vital to trading success. And countertrend or mean-reversion trading, e.g., trading a rally in a bear market, is lower probability and is tricky and challenging even for the most experienced traders.
DISCLAIMER: This post contains commentary published solely for educational and informational purposes. This post's content (and any content available through links in this post) and its views do not constitute financial advice or an investment or trading recommendation, and they do not account for readers' personal financial circumstances, or their investing or trading objectives, time frame, and risk tolerance. Readers should perform their own due diligence, and consult a qualified financial adviser or other investment / financial professional before entering any trade, investment or other transaction.
Thank you for reading. If this post added clarity or prompted additional thoughts on the technicals of SPY, please comment below!

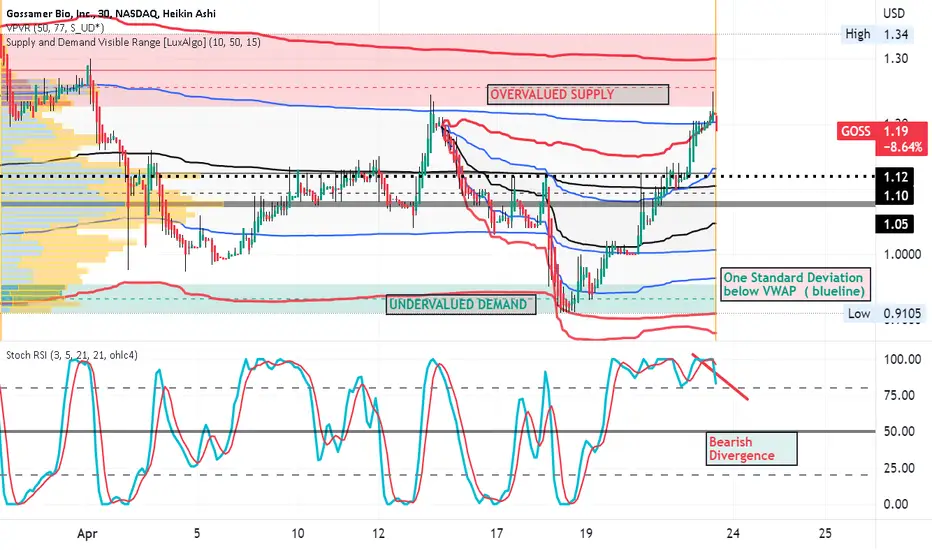
GOSS Penny Biotechology SHORTGOSS is a biotechnology penny stock without earnings valued based on future earnings
potential based on a "pipeline" which is subject to a long timeline of FDA regulation.
On the 30 minute chart. price is shown as being in the overvalued area in the upper VWAP
band and well above the POC line of the long-range volume profile. The RSI indicator is
now showing a bearish divergence as the relative strength is weakening. Price has bounced
down from the resistance of the line representing two standard deviations above VWAP.
The supply / demand zones are indicated by the Indicator applied which is authored by
Luxalgo. Price has hit the supply zone lower border and is now in an early reversal.
I see this as a swing short trade also played with taking put options. Stop loss is
in the upper area of the red supply zone. Targets include first the POC line of the volume
profile and then a final target at one STD below VWAP also being just above the demand zone.
Alternatively put options at the strike of $ 1.50 for the May monthly expiration of 5/18
This trade will benefit from any expected pullback in the general markets.