The Levels that I watch for !Here is my basic levels of value that I look for to place my trades, daily , weekly levels , pocs , and some SR .
Vwap and volume .
Now all its left is ... Place you trades .
POC

Steel in strong high-quality trend: use as "higher TF"Strong trend. Can serve as the "higher TF" for smaller TF trades.
POI's:
Steel broke out from downtrend
POC is supporting the main uptrend.
If already long on the daily. TP at $46.50, the highest price reached by previous peeks
The anchored vwap is shown below - a close-up of the trend.
Have not chosen a trade/plan yet. Hope this is useful as the "raw material".
Zoom:

Ethereum ETH 1H chart - levels and ranges to watch this weekTitle says it all.
My TA for ETH for the coming week.
Levels and ranges to watch for. Shows good long and short position entries.
Hope you like, if you do give it a thumbs up :)
Enjoy your day, everyone!

BTC/USD : Last bounce before the rejection !COINBASE:BTCUSD BINANCE:BTCUSDTPERP
Hello everyone 😃
Before we start to discuss, I would be glad if you share your opinion on this post's comment section and hit the like button if you enjoyed it !
Let's have a look into macro view before we start to take a look into LTF charts; As you can see there're two possible zones to pullback the recent dive below $40K's support.
Now there're two simple scenarios :
- Pullback from $38000 and retest $46500.
- Rejection below $38000 and dive into $36150.
The pullback is the major movement here and I won't active any other bearish setup until we get the rejection below $29000 !
As we talked about the bullish setups; I would like to inform that my main scenario is to locate SHORTs into $46500's NPOC and $50000's resistance.
- Also I have my invalidation above $53000 to locate LONGs after it...
📌 There can be more details into lower time-frame charts, Such as :
As you can see on above chart; There's a bullish order-block located on $37700 and the lower H2 can be another great entry for bulls.
If I want to set an invalidation, It would be as a rejection below H2's demand zone !
📑 Conclusion :
There's a possibility to have a bounce from $38000's support into $46500's NPOC (Naked Point Of Control).
So I'll be looking for possible pullback from $38000's order-block and $36000's H2 Demand.
- The invalidation will be a close below H2.
I would locating the possible SHORTs from $46500's NPOC and $50000's resistance to SHORT the pair into $29000's support.
- The invalidation of SHORTs will be a break-out above $53000's resistance.
Hope you enjoyed the content I created, You can support us with your likes and comments !
Attention: this isn't financial advice we are just trying to help people on their own vision.
Have a good day!
@Helical_Trades

XRP Long term outlook using POC + VWAP Hello there 👋
Here is my long term outlook for XRP
Overall Bullish if we continue holding support on July's 2021 POC
XRP is currently holding support on the Yearly VWAP and POC ( Good Sign!! )
Next we wanna see Price break the Consolidation Zone and hold above the latest ATH POC.
We can see a retest of July's POC after breakout.. but as long as we break consolidation we can expect to see bullish moves in the near future.
Thanks for reading. 📜

SENSOUSDT Price Action Range| POC| Range Low| Trend Evening Traders,
Today’s analysis – SENSO – trading at a key order block where a bounce is probable,
Points to consider,
- Price Action Corrective
- Local OB Support
- POC Support
- Price Action Trading Range
SENSOUSDT’s immediate price action is trading at a key support where a bounce into resistance, the .618 Fibonacci is likely with the the lower regions of the range to be the main target.
The POC is a key level that needs to be respected was testing.
The current volume is below average, an influx is highly imminent on the next expansion.
Overall, in my opinion, SENSOUSDT is a valid long at the range lower with defined risk, price action is to be used upon discretion/ management.
Hope this analysis helps
Thank you for following my work
And remember,
“Don’t blindly follow someone, follow market and try to hear what it is telling you.” ― Jaymin Shah’

SOLANA Expected Price Range for the week of 7 Feb to 14 Feb 2022Here is my analysis based on market profile point of control (POC; using VSFR), prices range and fair price from the week before.
Will it remain in range in expected price range, cross overbought and jump to the next range, cross oversold and fall below range?
Enjoy!

Bitcoin reversal pattern - Target 50kClear bullish hammer reversal on the 3d. We bounced off the 200MA and the POC for the range.
I expect an imminent breakout of the downtrend and test of the triangle. Target is 50k until March where we can expect further information on a potential rates increase and quantitative tightening. Ideally, we need the current candle (following the hammer) to close green.

Bitcoin touching NPOC in bullish move BTC just touched two NPOC levels in one powerful wick upwards.
High volume candle suggests a lot of bullish strength.
Next higher NPOC level around 43k.
Considering bullish strength, a move into 42k-43k territory touching upper NPOC level is not unreasonable. After which it may rejecting back down into the 30's to seek lower NPOC levels.
However, 40k remains a strong psychological barrier. If failing to break through and if rejection is confirmed, I will look at lower NPOC levels as next price targets.

GOLD Forecast 2/1Here is a downtrend continuation setup once price starts to retest and close under 1800. NFP is Friday & I am expecting a low to made around 1765 before any pull back.

S&P500 Bear MRKT?Last time this index was in the powerful green cloud in the ichimoku weekly was in August 2020.
Considerable support for partial accumulations:
- 3899 (Weekly ichimoku cloud support)
- 3415 (Weekly 200 MA support)
Note that it has already been tested twice in the last 4 years, the risk of missing this important watershed increases and would be in my opinion the beginning of Bear MRKT.

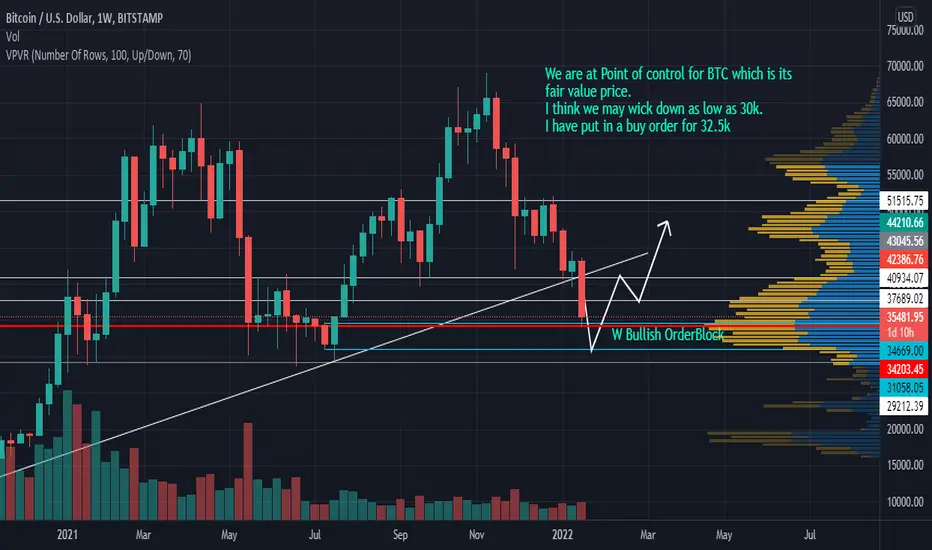
BTC Weekly Order Block filled?Hey guys I am looking to buy a big portion of BTC here, we are at a POC (point of control) for BTC, also there is a weekly order block which got filled last night (maybe only partially) so institutional investors might be looking to push the price a little lower. I am buying now, and at 32.5k and a limit order for 29.5k. We have dropped 50% from the top without any kind of recovery so we will likely have seen the worst of the capitulation. Even if the bull market has ended we will likely revisit 45-50k before taking a turn lower.
Not financial advice. Just my opinion, DOY.
BTC my targets for todayTf- H1 - Using Fibo Retracement and VPFR
enter sold
... 0.5 First entry
... 0.382 Second entry
Stop loss at 42900
sale target
... 0.786 First target. VPFR VA Support
... 1 Second target. last bottom resents
So that's it, it's all right to go wrong and from now on it's just backwards!
------------------------------------------------------------------------------------------------------------
Tf- H1 - Usando Retração de Fibo e VPFR
Entrar vendido
... 0,5 Primeira entrada
... 0,382 Segunda entrada
Stop loss em 42900
Alvo da venda
... 0,786 Primeiro alvo. Suporte VA do VPFR
... 1 Segundo alvo. Ultimo fundo ressente
Então é isso, está tudo certo pra dar errado e daqui pra frente é só pra traz !

EUR/USD Long SetupI'm seeing a long position setting up after this secondary retracement on EU. The POC and volume lines up well with the refined OB. The marked out range is the daily high and daily low (13-01-22)

Coin - POC in 3DThe right side of the ATH Reversal Diamond has a POC well above at 251. A 5-Hour Broadening Pattern has taken shape for BTC as the consolidation continues.

GBP/USD Chart AnalysisLooking for a GBP sell off this week. Targeting the OB and POC for the overall volume control. The extension on the TP is targeting a large area of un-mitigated price from the previous bullish push to the new highs. This area has to be mitigated by the institutions at some point so they can close out of their sell orders at BE.

GBP/USD Sell AnalysisMy previous Sell position charted up for cable played out perfectly and price reacted from the OB where the TP was placed (1.35325) Now price is pushing back up to fill the un-mitigated areas from the push down. I've identified an order block and refined it on the 1M timeframe. This is where my intended entry is going to be. The target is the new OB created at the bottom of the current range we're in and I've placed the SL just above the previous high of this range. POC is currently above price and we're in a period of consolidation currently.

XAU/USD LongI'm seeing a very bullish move on gold coming. We've had a stop hunt / LQ grab for this push down with a fake-out break of structure to the downside. The entry is the gold low from December 22nd. and the target is the 70.5% retracement of the push down.
The current POC of gold and overall volume control is at the 1823 range so this would favor a push to the upside also to grab liquidity for the next move.

GBP/USDShort Setup on cable using the OB and volume located within the Asia consolidation. the entry marked up also matches up as a 50% retracement of the bearish move from the 5th of January. Target is LQ which is the liquidity pool where this move originated from.

EUR/NZD - SHORT oppotunity !Hello trader,
Nice week and profitable deals 💲
EUR/NZD 4h Chart 📊
In my opinion, the ECB will keep lowering rates !!
Investor fear will further weaken the EUR !!
Technically we are at 0.382 of the last downward movement, IMO we are based on the SMA 200 4h and the POC !!
I will trade this breakout and use Fibos as TP and target 🎯
My SL is in the chart !
I want to mention that everything I post is just options and my own opinion!
Always trade with SL and do not risk more than 1% of your portfolio (max. 3%) per trade.
If you have any questions, please let me know
➡️If you like my posts, press the Like button, comment or follow me
Thanks for reading my ideas,
Trade save !!

How to use volume analysis to find key levelsVolume analysis is a vital advantage to us traders, it helps every type of trader, from day traders like us all the way to swing and trend traders.
Volume analysis helps us see where key levels are and what type of market sentiment we might have, bullish or bearish!
This video specifically focuses only on the POC, we will make a second video detailing all the other tips regarding volume profile

Bitcoin short-term - which POC will be touched next?Bitcoin short-term - which POC will be touched next?
Remember - POC of past days can have magnetic attraction.
Price action often just slightly touch and bounce as well.
What do you think? 😎
Drop me a nice comment if you'd like me to analyze any other cryptocurrency or do another comparison.
*not financial advice
do your own research before investing

POC of December 9th next target for #Crypto Marlet Cap AltcoinsPOC of December 9th next target for #Crypto Marlet Cap Altcoins?
POC of past days often act as magnetic attraction.
What do you think? 😎
Drop me a nice comment if you'd like me to analyze any other cryptocurrency.
*not financial advice
do your own research before investing
