Nice Demand zone on PERP, 1:3 trade ideaI think we could bounce off the previous POC,
we are trading at the level from wich we run up massively the first time.
let's see if we run up again
POC

BTC Weekend movementShort term movement, broke the value area of the day to the downside, nearest untouched POC is around 56600 which is between the .382 and .236 retracement fibs for a healthy pullback. Looking at 57300 to put up some support before further downside to 56. Be safe this weekend!

BTC Looking ForwardBTC has been ranging after the fall from 69k which has been great for ALTS, rather it's been great for METAVERSE tokens (SAND, MANA I'm looking at y'all). Looking forward, this weekend the general sentiment is that due to holiday in the states and it being the weekend, a dump further to 53-52 is imminent. I'm picking up big 38k vibes. While there are untouched POC's down in that region, and quite a large gap in 53-52 that would love to be filled in that volume distribution, there are also POC's above the current price that I think BTC is aiming for first. I can see another touch of 55 from here then fill out 65-67 leaving everyone longing for that 69 ATH, before retracing back to the lower 50's, 47.5 being a very strong support and my price in which i stay bullish leaning until broken.

AUDUSD – LONGBuying opportunity from Major Support Level and Demand Zone. The target is next POC level in Supply Zone.
AUDUSD – LONG
ENTRY PRICE - 0.72150
SL - 0.71680
TP - 0.73400
Please leave your comment and support me with like if you agree with my idea. If you have a different view, please also share with me your idea in the comments.
Have a nice day!

GBP/JPY 1HR Buy Position Looking for a secondary retracement on GJ into the 61.8 to the 70.50% zones to secure the liquidity for a rally upwards to fill the IPA and also collect the sell side liquidity from the POC above.

Head and Shoulders at the Midway point of Trading RangeOn the weekly we are currently closing below the 55 week moving average and potentially double topping while on the daily we are trading within a range potentially creating a Head and Shoulders pattern that if broken would likely take us to the bottom of the range.
If after making it to the bottom of the range we break through, we can then begin to target the much bigger target of the weekly double top that can take us down to $120 or even lower but to be conservative lets say $120.
I believe that payment processors are in a position of weakness and that we will see many pullback over the coming months.
For more on this you can view my idea on Visa in the related ideas section.

GBPAUD - SHORTSell opportunity according to Harmonic Pattern. The target is next POC level in Demand Zone .
GBPAUD - SHORT
ENTRY PRICE - 1.85720
SL - 1.86000
TP - 1.84600
Please leave your comment and support me with like if you agree with my idea. If you have a different view, please also share with me your idea in the comments.
Have a nice day!

UBER stock desperately needs to breakout from the box!Hi everyone,
Today we are taking a look at NYSE:UBER price movement.
We are using boxes with levels and fixed term volume profile.
What has been happening?
NYSE:UBER stock is pretty volatile asset in general (leaving out all meme stocks obviously). During last 7 months it has been moving in 37-56 price range with POC at 46-47 level.
Last 2 months, however, the price spent in a consolidation box in the 42-48 zone.
Volume profile for this period is not distributed uniformly, with value zone from 44,5 to 47,3 and POC at 45,5 .
Where are we now?
As of 17th Nov close, we are at the bottom line of the value zone at 44,4 .
Due to the fact that stock price did not close significantly outside the value zone, a reversal to 45,5 POC level is expected.
Moreover, longer-term POC of 46,9 is likely to be revisited.
What to expect?
I want to see profile structure repair at the value zone. That would signal of healthy price development.
Second biggest volume node is at 47 , so I expect POC to migrate there if we stay in the value zone.
Looking even further down the road, break of 48,7 box level takes us to 51,8 .
As always, trade wisely and good luck!
-----------------------------------------------------------------------------------------------------------------
Disclaimer!!!
This is not financial advise

USDCAD - SHORTSell opportunity to complete Harmonic Pattern. The target is next POC level in Demand Zone.
USDCAD - SHORT
ENTRY PRICE - 1.25560
SL - 1.26060
TP - 1.24400
Please leave your comment and support me with like if you agree with my idea. If you have a different view, please also share with me your idea in the comments.
Have a nice day!

GOLD short @ LPSY ( 1862).. 17/Nov/21.Short Gold at 1) LPSY ( Last Point of Supply ) Zone AND 2) Volume Profile ( POC) near 1862 .After Price re bounce near SOW ( Sign of Weakness ) Support. Stop Lost at 1876.95 ( Plus your broker spread )

LYFT Downtrend Range 2HRLFTY has seen a downtrend range since March 21', and keeps making lower lower and lower highs. Chart may look a little messy with the VPA, but here are the notable things about this pattern:
-Both support and resistance have had 2 high touches, with the 2nd touch nearing the resistance (support has had 3 touches)
-The ellipse shows a Head/Shoulder formation, with the neckline confirming a sell on the break, further rolling LYFT down the hill
-VPA suggests that the downtrends overall POC (shown in yellow) and the green POC show a average POC of $54.40-ish
-Red VPA suggests there will be a battle of $50.50, however , most of this volume was realized this last earnings call - nearly 425k to be precise, so 'battle' might be closer to $48.48 (in between red and green POC's)
-Nov. 5th gap. Historically, LYFT has had a decent rate of filling the divots, I expect this to not be different.
-MACD in stagnant divergence over the past few days.
Nevertheless, I believe LYFT will follow the trading bands for the moment, possibly making another touch on the support.

USDJPY - LONGConfirmed reaction to POC level with uptrend channel. Consider buying opportunity. The next plan is to breakout the Supply Zone.
USDJPY - LONG
ENTRY PRICE - 113.900
SL - 113.600
TP - 114.800
Please leave your comment and support me with like if you agree with my idea. If you have a different view, please also share with me your idea in the comments.
Have a nice day!

Mana Testing Wedge Pattern POC - powered by Fibonacci GeometryCurrent Pattern: Wedge
Status: Testing Lower Bound
Support: Pattern POC
Linear Support: .618
Pattern Profile: Compression

AUDUSD – SHORTSell opportunity to complete Descending Wedge pattern. The target is next POC level in Demand Zone.
AUDUSD – SHORT
ENTRY PRICE - 0.73300
SL - 0.73600
TP - 0.72600
Please leave your comment and support me with like if you agree with my idea. If you have a different view, please also share with me your idea in the comments.
Have a nice day!

GBPUSD - LONGConsider the development of North Impulse from Demand Zone . The target is next POC level.
GBPUSD - LONG
ENTRY PRICE - 1.34900
SL - 1.34100
TP - 1.36400
Please leave your comment and support me with like if you agree with my idea. If you have a different view, please also share with me your idea in the comments.
Have a nice day!

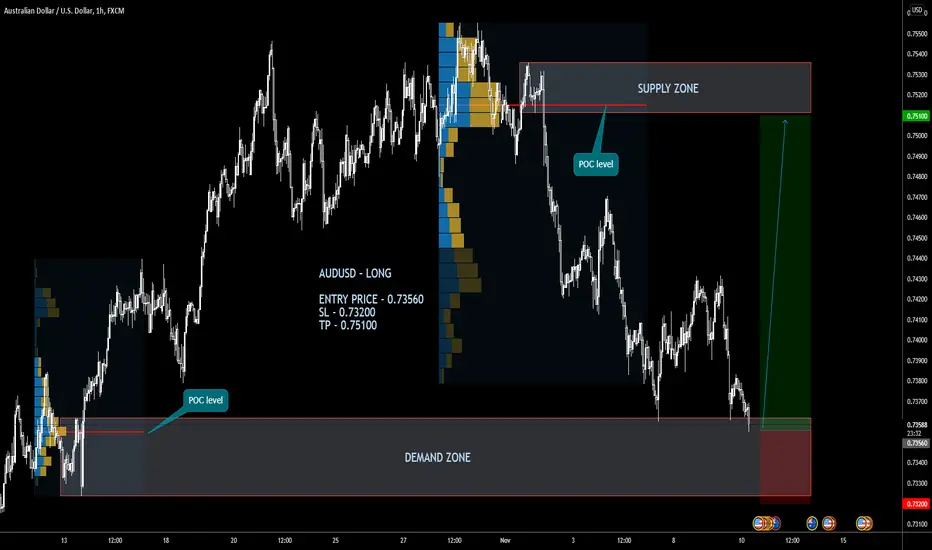
AUDUSD – LONGThe price has reached demand zone. Consider buying opportunity. The target is the next POC level in Supply Zone.
AUDUSD – LONG
ENTRY PRICE - 0.73560
SL - 0.73200
TP - 0.75100
Please leave your comment and support me with like if you agree with my idea. If you have a different view, please also share with me your idea in the comments.
Have a nice day!
CADJPY - SHORTThe price is below the Major Resistance Level. Consider the development of the South Impulse. First target is next Demand Zone.
CADJPY - SHORT
ENTRY PRICE - 91.650
SL - 92.500
TP - 89.830
Please leave your comment and support me with like if you agree with my idea. If you have a different view, please also share with me your idea in the comments.
Have a nice day!

GOLD may down to 1760 as triangle in wave (x)(Red). 10/Nov/21GOLD possible forming a bullish triangle in wave (x)(Red). Price may reached wave d (Cyan/Light Blue) of the triangle @ 1832.56 which is the major resistance zone of the long term down trend line (Red Dotted).....Wave e (Cyan/Light Blue) of the Bullish Triangle could be at around 1760 which is the zone of :- 1) Lower Support Line of the Bullish Triangle ( Cyan Dotted) .. 2) Weekly Up Trend Line Support Zone ( Cyan Dashed ) .. 3) P.O.C ( Point of Control) zone of Volume Profile,,..

USDJPY - SHORTThe price is below the Major Resistance Level. Bearish Harmonic Pattern has been completed. Consider the development of the South Impulse. First target is - POC.
USDJPY - SHORT
ENTRY PRICE - 114.200
SL - 114.700
TP1 - 113.700 (Breakeven)
TP2 - 112.100
Always follow the 6 Golden Rules of Money Management:
1. Protect your gains and never enter into a position without setting a stop loss.
2. Always trade with a Risk-Reward Ratio of 1 to 1.5 or better.
3. Never over-leverage your account.
4. Accept your losses, move on to the next trade and trust the software.
5. Make realistic goals that can be achieved within reason.
6. Always trade with money you can afford to lose.
Please leave your comment and support me with like if you agree with my idea. If you have a different view, please also share with me your idea in the comments.
Have a nice day!

AUDJPY - SHORTPrice below local POC level. Sell on a false breakout! The target is next POC level.
AUDJPY - SHORT
ENTRY PRICE - 81.700
SL - 82.100
TP - 80.250
Always follow the 6 Golden Rules of Money Management:
1. Protect your gains and never enter into a position without setting a stop loss.
2. Always trade with a Risk-Reward Ratio of 1 to 1.5 or better.
3. Never over-leverage your account.
4. Accept your losses, move on to the next trade and trust the software.
5. Make realistic goals that can be achieved within reason.
6. Always trade with money you can afford to lose.
Please leave your comment and support me with like if you agree with my idea. If you have a different view, please also share with me your idea in the comments.
Have a nice day!

Sea Ltd stock analysis w/ boxes and Volume ProfileHi everyone,
This time I am analyzing NYSE:SE stock movement using volume profile besides my usual boxes setup.
NYSE:SE stock price has shown very persistent up-trend strenght for the past year.
When we have the equity soaring up like NYSE:SE does, it is helpful to use Volume Profile to see a bigger picture.
I added three volume profiles for different timeframes: 9 months, 5 months and 2 months.
What does it show us?
As we can see in the past 9 months the biggest trading volume occured around 273 level. That is where our long-term POC is.
However, a decent volume profile started developing from 308 level and above.
For the last 4 months the highest volume has been seen at 323 level. Both 2 and 4 month profiles have universal volume distribution with same POC level.
That means that higher price level has been accepted and stock is consolidated on a higher time-frame.
What now?
As volume profile is dynamic, I expect long-term POC to migrate to 320 level.
However, for that to happen we will need to see a lot of volume at 320, which is 7% lower than the current price.
AND that would be happening at the uptrend support line, which is dangerous.
IF that is broken, we could see a return to 273 POC to repair long-term profile structure.
IF we continue higher from here, we would get unevenely distributed profile, which could be bad in the long-run.
Let me know what you think of NYSE:SE movement and if it is sustainable.
Trade wisely and good luck!
-----------------------------------------------------------------------------------------------------------------
Disclaimer!!!
This is not financial advise.

GBPUSD - SHORTHarmonic Pattern has been formed. Consider the development of South Impulse from Supply Zone . The target is next POC level.
GBPUSD - SHORT
ENTRY PRICE - 1.35850
SL - 1.36850
TP - 1.33600
Always follow the 6 Golden Rules of Money Management:
1. Protect your gains and never enter into a position without setting a stop loss.
2. Always trade with a Risk-Reward Ratio of 1 to 1.5 or better.
3. Never over-leverage your account.
4. Accept your losses, move on to the next trade and trust the software.
5. Make realistic goals that can be achieved within reason.
6. Always trade with money you can afford to lose.
Please leave your comment and support me with like if you agree with my idea. If you have a different view, please also share with me your idea in the comments.
Have a nice day!

USDCHF - LONGConsider the development of North Impulse from Demand Zone . The target is next POC level.
USDCHF - LONG
ENTRY PRICE - 0.92500
SL - 0.92150
TP - 0.93160
Always follow the 6 Golden Rules of Money Management:
1. Protect your gains and never enter into a position without setting a stop loss.
2. Always trade with a Risk-Reward Ratio of 1 to 1.5 or better.
3. Never over-leverage your account.
4. Accept your losses, move on to the next trade and trust the software.
5. Make realistic goals that can be achieved within reason.
6. Always trade with money you can afford to lose.
Please leave your comment and support me with like if you agree with my idea. If you have a different view, please also share with me your idea in the comments.
Have a nice day!
