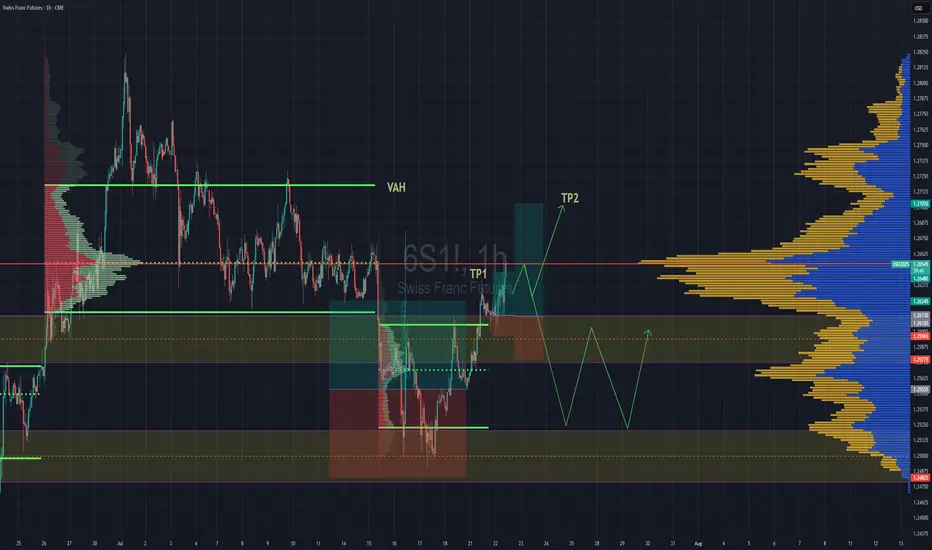
Swiss Gaining Momentum Against The DollarSwiss futures gaining strength against the dollar. We have broken back into previous rotation that was somewhat balanced, but still leaning towards a "b" style volume profile . If we are able to get above the POC, then we''ll go straight for TP2 close to Value are high.
If the POC is really strong and we reject hard from the POC then we might lose the value area and fall back down to previous value area to continue consolidation there until further notice.
Pointofcontrol
Deeper Retrace if previous monthly high and VAH are lostBTC has made a strong move up recently, but we’re now trading just above key contextual levels that could act as a tipping point if lost. Do we look for a failed auction?
🧭 Key Levels on Watch:
• PW/MHIGH (Previous Week and Month High): ~109,988
• VAH (Value Area High): ~105,573
• POC (Point of Control): ~96,815
• VAL (Value Area Low): ~87,198
• Anchored VWAP from the April low is rising steadily and currently converging with the POC.
🔍 What to Watch For:
We’ve wicked above the monthly high and are now showing signs of stalling. If BTC fails to hold above the VAH (~105.5k), it would suggest acceptance back inside the prior value area. This could open the door for a rotation lower toward the POC (~96.8k) — the area with the highest historical volume and strong structural support.
🟢 Anchored VWAP Support
The anchored VWAP from the April low continues to rise and is on a collision course with the POC. This area could become a magnet for price, offering confluence for a potential bounce or reaccumulation zone.
⚠️ Scenario Outlook:
• Lose PW/MHIGH → Caution
• Lose VAH and hold below → Expect rotation to POC
• VWAP + POC convergence could be a key buy zone if tested
This is a classic example of auction market theory in action: acceptance back into value often leads to a revisit of the point of control.

#AVAX/USDT Short-term riseHello traders!
There is an upward wave and the price is declining in a correction . I expect a similar upward wave. We have an POI Zone and I expect the wave to start from there.

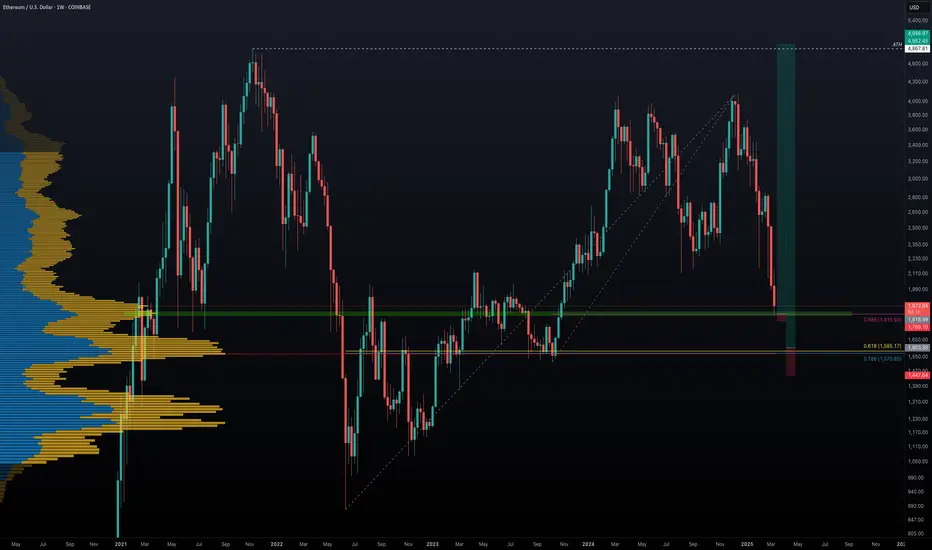
Ethereum's Potential Bottom: Could $5000 Be Next?Ethereum has experienced a significant 56% drop over the last 84 days. Has ETH found its bottom, or is more downside ahead? Let's break it down.
🔹 Fibonacci Retracement from October Low (2023) to December High (2024)
Starting with the Fibonacci retracement from the low of $1520.85 on 12th October 2023 to the high of $4109 on 16th December 2024, ETH recently hit the 0.886 Fib retracement at $1815.9 and saw a bounce. This area aligns with the Point of Control (POC) from previous price action, a potential signal that this could be a major support zone.
However, the real question is whether this is the final bottom, or if ETH will retest lower levels.
🔹 Further Fibonacci Retracement Analysis
Next, we take a larger Fibonacci retracement, from the low of $879.8 on 18th June 2022 to the high of $4109. The 0.786 Fib retracement at $1570.85 appears to be a critical support zone, as it also coincides with the POC in the volume profile of the entire market structure. This indicates that the $1570-$1600 region is a significant area of interest for buyers to step in.
🔹 Log Scale Fibonacci Confluence
To further strengthen this analysis, applying the same Fibonacci retracement on a log scale shows the 0.618 Fib retracement at $1585.17, very close to the POC and 0.786 Fib level, reinforcing this region as a major support zone.
🔹 High-Probability Long Setup
If ETH revisits the $1570-$1600 zone, this forms an ideal high-probability long setup with excellent risk/reward potential. A potential R:R ratio of more than 20:1 could materialise if this setup plays out and price targets $5000 as a take-profit level. The stop loss placement will determine the exact risk-to-reward, but the reward could be massive if this level holds.
💬 What are your thoughts? Will Ethereum find its bottom around these key levels? Excited to see how this develops! 🚀
HNT/USDT Trading ScenarioThe price chart of the asset shows a significant increase in trading volumes within a broad range from $2.875 to $11.153. From a volume analysis perspective, despite pronounced volatility, market participants continue to accumulate the asset within the current price corridor. At the moment, the asset's price is below the POC (Point of Control) level and has bounced off the support level at $2.875, which marks the lower boundary of the active range.
Given the current dynamics, a gradual price movement toward the upper boundary of the range can be expected, which may lead to a breakout of this level and further development of the upward trend. Such scenarios are supported by the fact that increasing trading volumes in the direction of the current trend typically signal its stability and the likelihood of continuation.

ABC Correction perfection A Beautiful ABC pattern
Lines up perfectly with :
- Previous range Point Of Control
- Previous month Value Area Low
- A Daily Naked
- The 1 to 1
- Global Swing Low Avwap
Elliot wave theory
I expect early next week being hit. Then target the highs for a wyckoff distribution pattern.
People are already positioning EU swing longs, without a spring.
We need to punish dem early bulls 🏌️♀️
CAPITALCOM:DXY OANDA:EURUSD CME:6E1! ICEUS:DX1!

APT/USDT Trading Scenario UpdateThe current APT price has dropped significantly, reaching a low of $4.7, which marks a decline of over 69% from its recent peak. This sharp drop could be seen as a buying opportunity for market participants, potentially offering future profit prospects.
From a trading volume perspective, a bullish divergence is forming: despite the price decline, trading volumes are increasing. This suggests growing investor interest, as they perceive the current price levels as favorable entry points. Additionally, volume profile analysis indicates that the asset is trading below the Point of Control (POC), but with higher-than-usual volume, further confirming market participants’ interest in accumulating at these lower levels.
Given these factors, a price rebound toward the POC level and a continuation of the upward trend seem likely. It's also important to monitor Bitcoin dominance, which currently stands at around 60%. A decline in Bitcoin’s dominance could impact the performance of other cryptocurrencies and the overall market sentiment.

KAVA/USDT Trading ScenarioThe asset's price, like most altcoins, has undergone a significant correction and is currently trading near its local low. However, despite the decline in quotations, the market is experiencing a noticeable increase in trading volumes, indicating strong demand from buyers. A confident absorption of supply during the downturn suggests potential interest in KAVA from large players.
From a volume analysis perspective, the price is within the Point of Control range, reflecting the highest trading volume in the current price corridor. This confirms substantial market participant interest and the formation of a liquidity zone, which may act as support if consolidation continues. If volumes continue to rise and the price holds above key levels, this could signal a trend reversal and the development of an upward momentum.

XAUMO: The Ultimate Multi-Timeframe Gold Analysis ReportXAUMO: The Ultimate Multi-Timeframe Gold Analysis Report
Period: January 27 – February 2, 2025
📊 Daily Chart (Long-Term Trend)
🔍 Ichimoku Analysis:
• Clouds (Kumo):
• Thick Kumo ($2,744-$2,752) providing strong long-term support.
• Future Kumo: Steep bullish slope with (Senkou Span A > Senkou Span B), reinforcing the bullish trend.
• Tenkan/Kijun (TK/KS) Crosses:
• Type of Cross: Bullish cross above the Kumo.
• Support Levels:
• Tenkan ($2,774): Dynamic short-term support.
• Kijun ($2,761): Key support during pullbacks.
• Chikou Span:
• Positioned above price and Kumo, confirming strong bullish control.
• Stable slope, suggesting minor consolidation.
📈 Regression Channel Analysis:
• Price is moving within an upward channel, with resistance near $2,785-$2,790, signaling potential overbought conditions.
🔗 Support and Resistance Levels (VRP):
• POC: $2,771 (Pivot point for accumulation).
• VAH: $2,785 (Supply zone).
• VAL: $2,756 (Demand zone).
📦 Supply and Demand Zones:
• Supply: $2,785-$2,790.
• Demand: $2,744-$2,752.
⏳ Sushi Kinko Cycles:
• 26-Period Cycle: Confirms bullish continuation toward $2,800.
📌 Tradeable Levels:
• Upside: $2,785-$2,810 (Fibonacci Extension 161.8%).
• Downside: Below $2,756 targeting $2,740 (VWAP).
⏳ 4-Hour Chart (Swing Trading)
🔍 Ichimoku Analysis:
• Clouds (Kumo):
• Moderate thickness supporting price at $2,744-$2,752.
• Steep bullish slope confirming momentum.
• Tenkan/Kijun (TK/KS) Crosses:
• Bullish cross above the Kumo, reinforcing the trend.
• Key Supports:
• Tenkan ($2,774): Immediate support.
• Kijun ($2,761): Major support.
• Chikou Span:
• Positioned above price and Kumo, signaling strong bullish pressure.
• Upward slope, enhancing bullish momentum.
📦 Supply and Demand Zones:
• Supply: $2,785-$2,790.
• Demand: $2,744-$2,752.
⏳ Sushi Kinko Cycles:
• 9-Period Cycle: Minor pullback toward $2,771.
• 26-Period Cycle: Signal for a move toward $2,800.
📌 Tradeable Levels:
• Upside: $2,785-$2,810.
• Downside: $2,756-$2,744.
⏳ 1-Hour Chart (Intraday)
🔍 Ichimoku Analysis:
• Clouds (Kumo):
• Weak clouds with support near $2,774-$2,771.
• Moderately bullish slope.
• TK/KS Crosses:
• Tenkan ($2,777): Immediate support.
• Kijun ($2,773): Key support level.
📦 Supply and Demand Zones:
• Supply: $2,785-$2,790.
• Demand: $2,773-$2,765.
📌 Tradeable Levels:
• Buy: $2,773 targeting $2,785.
• Sell: Rejection at $2,785 targeting $2,773.
⏳ 30-Minute Chart (Scalping)
🔍 Ichimoku Analysis:
• Thin clouds supporting upward momentum.
• Tenkan ($2,777): Immediate support.
• Kijun ($2,773): Major support for scalping.
📌 Tradeable Levels:
• Buy: $2,773 targeting $2,785.
• Sell: Rejection at $2,785 targeting $2,773.
🔑 Summary:
• Bullish Bias: Above $2,785 targeting $2,800-$2,810.
• Bearish Bias: Below $2,756 targeting $2,740.
• Pivot Point: $2,771 (POC).
📌 Session Insights:
• Tokyo: Scalping at $2,773.
• London: Rejection at $2,785 or breakout opportunities.
• New York: Breakout above $2,785 or correction toward $2,771.
🔗 A blend of analytical tools for a precise and balanced trading strategy.

APE/USDT Trading ScenarioThe asset is currently trading 95% below its all-time high (ATH). Unlike most cryptocurrency market categories that are showing growth despite significant corrections, the NFT and metaverse segments remain in the shadows, not showing significant dynamics.
APE is currently near its all-time low, and in terms of volume profile, there is interest from market participants, as well as accumulation of positions in the current range. Fundamentally, the token is still associated with one of the most famous projects in the NFT sphere – Bored Ape Yacht Club (BAYC), as well as with the Otherside metaverse. However, it has fallen outside the zone of active investor attention amid the rapid growth and popularity of meme coins.
This asset deserves close attention, as it has the potential for significant upward movement.

POL/USDT Trading ScenarioIn November, POL showed confident growth driven by euphoria following the U.S. presidential election results. The asset's price surged from $0.2852 to $0.7705, marking a gain of over 160%. However, profit-taking by market participants soon followed, resulting in a correction that now exceeds 46%.
Currently, seller activity appears to be waning, with a support level forming at $0.4104, from which the price has rebounded twice. Volume profile analysis indicates that POL has stabilized within a zone of market interest.
Further declines may occur as liquidity from short-term players is absorbed, potentially setting the stage for a trend reversal. The recovery dynamics and subsequent growth of the asset are largely influenced by U.S. macroeconomic indicators. Special attention is being paid to the Federal Reserve's decisions on adjusting the key interest rate, which are revised based on current data.

Daily Market Review and Analysis for BTC: January 13, 2025BTC (2h)
The price scenario from my review of January 8, 2025 was implemented. As expected, the #BTC price after several days of manipulation in the sideways channel ($91,160 - $95,800) eventually removed the sellers' liquidity at $90,500 and approached the next liquidity pool at $88,722. Thus, the almost 5% drop in price was also worked out.
Now, regarding the further price movement:
– #Bitcoin will most likely strive for the level of $96,258. This is the nearest point of interest (POI).
– Further, if the price consolidates at this level, it is possible to move up to the middle of the 4-hour gap ($ 99,443) and then roll back down to remove liquidity at the level of $ 88,722. In other words, we are now entering the phase of another manipulation of the tops, the end result of which will be another fall in the price.
An alternative to the above is a continuation of the downward movement with a highly probable withdrawal of liquidity to the $85,000 mark.
An important point - despite the fact that globally we are in a bull market, we should not forget that the price is currently undergoing a correction. Thus, the fundamental level at the bottom in the middle of the weekly gap ($ 85,000) after breaking through the level of $ 88,722 should also not be ignored.
I will confirm that in order to reach the next historical maximum (ATH), Bitcoin will need to clear the sellers' liquidity pool levels at $ 88,722 and $ 85,000 in the medium term.
In particular, there is an even more gloomy scenario for Bitcoin based on candlestick analysis. I'll write about this in tomorrow's review.

LTC/USDT Trading Scenario UpdateAgainst the backdrop of overall optimism in the cryptocurrency market during November and early December, LTC showed confident growth, reaching a price level of $147.32. This was followed by a correction exceeding 40%.
Interestingly, the asset's price retraced and rebounded from the upper boundary of a consolidation range that has persisted for over two years. This range has become an accumulation zone for a significant number of participants and continues to attract new ones, as LTC is trading in close proximity to this level.
Given the current dynamics, further developments in the altcoin market could be anticipated, with the potential for a strong upward trend and a possible multi-fold growth.

ADA/USDT Trading Scenario UpdateThe asset has shown a strong upward trend, rising from $0.3190 to $1.3264, indicating increased market interest. This growth was accompanied by higher trading volumes, which confirms its strength. Currently, ADA is in a correction phase, which has already retraced over 40% from its peak.
The key POC (Point of Control) level of the current local uptrend cycle is at $0.5979. This volume-based level could serve as support and potentially mark the beginning of a reversal. For investors, this represents a good entry point to purchase the asset at a more favorable price before a potential altseason.
It’s important to monitor the price action near this level, as its reaction could determine the further direction of movement.

APT/USDT Trading ScenarioIn a persistently optimistic market environment, APT has shown a strong increase of over 250% from its local low, reaching $15.3.
Despite a sharp correction, the asset’s growth potential remains significant. Volume profile analysis indicates steady interest from market participants within the current price range. The asset is currently trading near the Point of Control (POC), a strong support zone, making it an attractive buying opportunity for anticipating a continuation of the upward trend.

GMX/USDT Trading ScenarioGMX is another undervalued asset in the current market. Its price is currently 70% below its all-time high (ATH), yet there is potential for it to reach that level again. The asset is currently trading at $28.37, close to its local minimum.
From a volume analysis perspective, the asset is at the Point of Control (POC), which formed in May 2024, when the asset was in an accumulation phase. Trading volumes also indicate heightened interest from market participants in this price range.
Despite the overall positive trend, the asset has not yet shown significant growth. However, with the upcoming altseason, it has strong potential to surpass its historical maximum.

TOTAL 3 - Crypto Total Market Cap excluding BTC and ETHVery technical. A global trend, followed by a correction to the 0.618 Fibonacci level and the global order block, which is also the PoC (Point of Control) of the entire trend movement. We're clearly moving within a kind of wedge.
We haven't been fans of technical analysis for a while, but part of it will always stay with us. I think this is one of those moments when, after it plays out, people will look back and say: "How obvious it was."
There are two options here: either one more update of the lows on altcoins or a correction upwards. Two scenarios, but globally, it doesn't change anything.

RDNT/USDT Trading ScenarioAs a result of the cyberattack on Radiant Capital's protocol in October, their token RDNT lost value significantly, hitting an all-time low of $0.0375. According to the volume profile, many participants are actively accumulating the token at discounted prices, and the current decline is not deterring buyers. The protocol developers are also working on eliminating the consequences of the attack and strengthening security.
In the long term, the price is expected to recover and RDNT is to continue to grow during the altcoin season. Such situations with fundamental protocols often provide an opportunity for high returns over the medium to long term.

BAL/USDT Trading ScenarioAfter reaching a local maximum in 2024 at a price of $6.192, the asset has since declined, hitting a low of $1.544, a drop of over 94%. Currently, the asset is trading near this minimum price. The volume profile in this price range indicates strong interest from market participants for accumulation.
Given this interest and the current market dynamics, there is a likelihood of continued short-term decline, which could trigger additional liquidation of weak positions and create more favorable conditions for further accumulation. This may lay the groundwork for recovery and potential growth of the asset as the market stabilizes and investor sentiment shifts.

CRV/USDT Trading Scenario UpdateThe asset is currently trading at $0.2568, which is significantly lower than its local high of $6.7862—a decline of over 97%. However, despite this drop, the Curve Finance platform continues to draw attention from market participants, maintaining a Total Value Locked (TVL) of $1.8 billion, indicating a high level of trust in the ecosystem.
Volume profile analysis shows considerable interest in the asset within the current price range, which could signal the formation of a strong support level. Increased trading volumes further suggest heightened buyer activity, creating potential for a price recovery.

BNB/USDT Trading Scenario UpdateAt the beginning of 2024, after a short-term accumulation phase, BNB showed a significant increase, reaching a local maximum of $723.5. This growth amounted to more than 140% from previous levels. Currently, the asset is in a prolonged accumulation phase, which has been ongoing since March until the present day.
From a volume profile perspective, the current price zone represents significant interest for market participants. It is also important to note the shift of significant volumes and the Point of Control from the $315 level to $584.
The shift of the POC to a higher level ($584) indicates that market participants are showing interest in buying at higher prices, which in turn could serve as a prerequisite for sustainable price growth in the future.
A breakout of the local maximum level at $723.5, followed by consolidation above, could open up the potential for further growth of BNB. If this resistance level is successfully overcome, the asset may enter a bullish trend phase with new price targets.

SHIB/USDT Trading Scenario UpdateAfter a significant increase in February and reaching a local maximum of $0.00004575, the price declined to the $0.00001080 mark, which represented a drop of over 76%. As a result of this decline, the quote nearly reached the POC volume level at $0.00001032.
Near this level, a rebound was observed, followed by an attempt at recovery. From the perspective of Fibonacci levels, the current asset price is within a favorable range for purchases (between 1 and 0.75).
In this range, medium-term purchases can be considered with a target price of $0.00002746, which corresponds to the 0.5 Fibonacci level.

LDO/USDT Trading ScenarioAfter reaching a new high of $4.027, the price of LDO significantly declined, dropping to $0.863, which corresponds to a fall of over 78%.
According to the volume profile, the asset broke through the POC volume level at $2.4.
Special attention should be given to the increase in volume in the range of $1.026 to $1.135. This range shows active growth and is approaching the POC level, which could signal a potential reversal and the start of an upward trend.
