EURUSD Bearish SMC Setup | Premium Supply Rejection + CHoCH +FVGPair: EUR/USD
Timeframe: 4H
Price reacted strongly from a Premium Selling Zone, forming multiple CHoCH (Change of Character) and BOS (Break of Structure) confirmations.
🔻 Red Zones indicate strong institutional selling
🔺 Weak High is now likely to remain protected
Market structure has shifted bearish, and price is targeting imbalances (IMB) and Fair Value Gaps (FVG) below.
⸻
✅ Entry: Taken from the premium supply rejection
🎯 Target 1: 1.16000 – Minor imbalance fill
🎯 Target 2: 1.15000 – Mid-level demand
🎯 Final Target: 1.14500 – Major liquidity zone
❌ Invalidation: Clean break above 1.18000
⸻
📉 Smart Money Confirmation Setup:
• Premium Supply
• CHoCH
• BOS
• FVG & IMB below
🔄 Missed the entry? Wait for a pullback into lower OB or supply zone.
#EURUSD #SmartMoney #SMC #CHoCH #BOS #FVG #OrderBlock #Forex #LiquiditySweep #SupplyDemand
Points

BANK NIFTY ANALYSIS - 23/06/2023BUY ABOVE - 43810
SL - 43700
TARGETS - 43940,44100,44260
SELL BELOW - 43700
SL - 43810
TARGETS - 43530,43350,43350
Trade Safe & Happy Trading Guys
This is only for educational purpose so TAKE YOUR OWN RISK REWARD

NIFTY ANALYSIS - 23/06/2023BUY ABOVE - 18800
SL - 18750
TARGETS - 18830,18880,18950
SELL BELOW - 18750
SL - 18800
TARGETS - 18720,18660,18635
Trade Safe & Happy Trading Guys
This is only for educational purpose so TAKE YOUR OWN RISK REWARD

NIFTY ANALYSIS - 20/06/2023BUY ABOVE - 18780
SL - 18750
TARGETS - 18820,18870,18920
SELL BELOW - 18720
SL - 18750
TARGETS - 18640,18610,18580
Trade Safe & Happy Trading Guys
This is only for educational purpose so TAKE YOUR OWN RISK REWARD

SPX500 is still in an uptrend, target R1-R2. Intraday Strategy Hello traders. SPX500 is still in a downtrend but it might have an upward for tomorrow.
RSI 8 MA 8 is showing an oversold signal, in 15m,30m,45m, and 1-hour frames, this is why it might have an uptrend for tomorrow, following the Resistance, Supports and Pivot levels results.
Important take a note about this. Check the trend, confirm the uptrend when the prices cross the Pivot Point over up, and then R1, and finally the MA200. Controlling that the market doesn't reject those levels, we might get some profits with it.
Indicator MA 200, 20-8 RSI 8 MA8 Bolliger 20. Intraday Strategy Pivot Point Levels
R3 4,686.00
R2 4,557.20
R1 4,472.80
PP 4,428.40
S1 4,344.00
S2 4,299.60
S3 4,170.80

ZEC Near 16% Gains on SaturdayZcash (ZEC) was trading by over 16% higher as of writing this, as prices rose to their highest level in over three months.
After trading at a low of $748.86 yesterday, today’s high of $777.63 saw ZEC/USD break past its long-term ceiling of $772.20 in the process.
Saturday’s peak is the highest point that the price of ZEC has traded since December 9, and comes as price strength appears to be overbought.

Long EUR/USD bouncing off [R1 pivot] we are bouncing off a expanding triangle and r1 pivot on 4hr timeframe

Eth/usdA quick ideea about 24/h trading , eth will grow a little bit for the long/short LionTraders.... cheers respect

Nice entry point for SOLFor people who missed the Solusdt, it broke the descending trend line strongly and you see it is in a good position in RSI.
.
So you can enter on a pullback.
be aware of stop hunting and false breakout by trigger candle and Set your SL

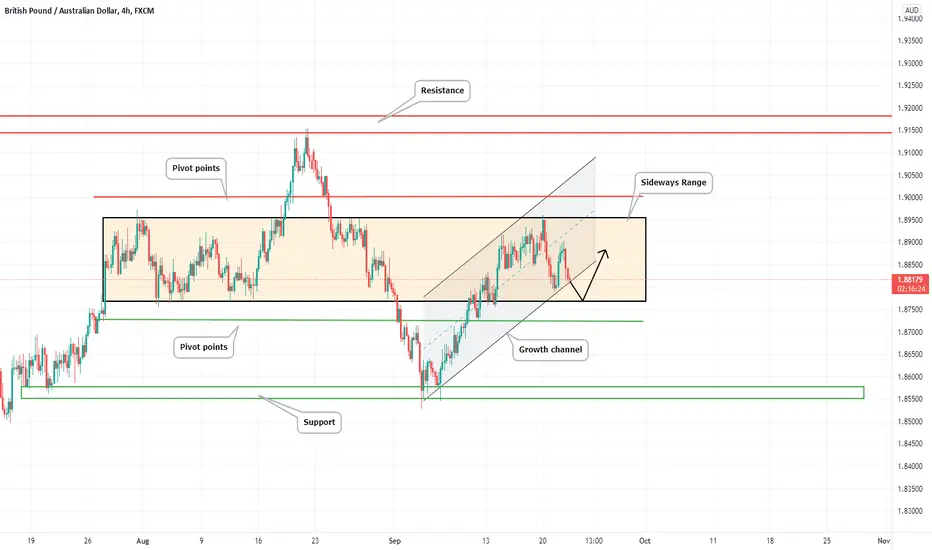
GBPAUD 📉Decline to pivot points⚡As of today, ltrym has been trading sideways since July 27th. During this time, clear boundaries and control points of support were formed. Further price movement - when the sideways range is broken, I expect a descent to the pivot point and back into the range - a false exit. We are also now at the lower boundary of the local ascending channel. If we break it, then we go down to the border of the range and push off from it. The second idea has more chances of implementation, since the sideline is quite old, which means its boundaries are quite strong.
Have a nice trade!
NFLX Weekly ProbabilitiesThis statistical indicator (Pivot Probabilities) finds the historical likelihood of any week or month closing between two given pivot points.
NFLX is particularly interesting. We have been range bound between $555.88 and $477.58 since June - July of 2020.
Using a linear regression of the last 3 months ( excluding the current month's data ), if price reached mean this week it would be at the prices $484 - $480 based on time.
Using Pivot Probabilities, looking back 19 years ( the entire time series ) the 29th Week of the year has a 26.32% historical probability of closing below $488.57 ( S3 ).
I find it unlikely that we will make this move, but being aware of the likelihood that these events could occur is a massive advantage to risk management strategy.
If I were to bias my trade bullish or bearish blindly, lets say by flipping a coin, I could look and see that 78.95% of all closes for this week are below the Central Pivot, currently at $538.30.
Just because there is close to an 80% likelihood of profitability in a trade, does not mean it will be profitable. You must make contingency plans for that remaining 20% risk. By taking care of your risk, your profit potential will take care of itself. For example, there's a 15.79% historical probability that we close above $580.04 ( R3 ) by the end of this week. You must be prepared for that R3 outcome as well as you prepare for the S3 outcome.
Be safe out there and best of luck!


Will The S&P 500 Index Clear All Time Highs This Week?Hello traders!
These are interesting times we are in right now! National pandemic, yet our markets are rising day after day!
I'm doing my weekend review, charting, homework, reviewing lessons, celebrating wins and getting ready for next week and wanted to share my analysis for the S&P500 index.
This has recently become my favorite chart to trade due to volatility and how beautifully it moves!
Anyway, we can see that price wicked an all time high on 3/11/21 and retraced back down before making another run up towards the same highs at the end of this past week.
Analyzing the Daily chart I am seeing strong bullish sentiment solely considering the candle sticks, however we must consider the fact that we are at an all time high!
So the question is: Will it break the all time high this week?
My sentiment is bullish and always be bullish since that is all that this chart has done over the long run, but with such a strong rejection of this point in the past, we must keep in consideration the fact that it may do it again!
I'm excited to see what happens this week, its so interesting to see the rise of our markets during such crazy times in our world
Let me know what you think below, thumbs up if you agree!


Hei, what do you think of my chart haha, please like for repI will like your post back :) lets get them reputation points up :)

5 Things You Should Stop Doing As A Trader1-listening to others
-you don’t know their trading plan
2-strategy hopping
-focus on one trading method
-learn more about the trading method
3-tweaking one strategy
-develop new strategies instead
4-thinking in terms of absolute
5-comparing yourself to others
if you are interested any crypto that you want analyze with me and any questions please do not hesitate and comment below the chart!
if u like it press like-comment and folow me.thx


Bitcoin targets for January and March 2021If this channel that I have proves to be consistent with previous 2017 bull pattern then I am giving two points as possible short term highs and lows. For the month of January I have a possible high of over $34k and in March we can set our first lower high at around $21k going into the first quarter of 2021.

XRP POSSIBLE BOOMLast time XRP hit my area of Weekly Demand was on July 16 2017 you can see price how price touched it again in March of 2020 , Now you also see price stalling at the 0.30 cents area the same area it was stalling in 2017 , if price does break the current area of supply its at right now , XRP may pump and who knows maybe go for a another pump to the upside for god knows how much , i personally have been holding a good amount of XRP coins since 2018 since i believe in the value its bringing and the price i got it for in my opinion is amazing but lets see how it plays out , happy trading guys :) and SHOUTOUT MY LONGTERM XRP HOLDERS
Please like and comment it pushes me to keep creating content on pairs and my bias on it :)
-This is merely MY outlook and not advice on what YOU should do just my opinion on what I see

RidetheMacro| DOW Jones📌 Wall Street closed deeply in the red on Friday and the S&P and Nasdaq linked a third weekly decline, as sharp losses in the tech sector continued. Shares of Big Tech dropped steeply led by Apple (-3.2%), Amazon (-1.8%), and Microsoft (-1.2%). On the earnings side, US Steel rallied 9% after the company reported a smaller-than-expected quarterly loss. On the policy front, Democrats and Republicans are still far from a deal on the coronavirus aid follow-on bill to the previous $2 trillion package. The Dow Jones lost 245 points or 0.9% to 27,657.
🏴 the loss of the technical structure seeks compensation. Still Need a Clear Break of Trend Area also MA death cross help to give a clear view to add shorts with Confidence.
⚡ U.S.-China tensions simmer
Tensions between China and the U.S. also dampened sentiment on Friday after the U.S. government said it will block all TikTok and WeChat downloads in the country on Sunday. Oracle, which is trying to take a minority stake in TikTok-parent ByteDance, fell 0.7%.
Major Technical Areas to watch.
Risky for longs above 27,35x
Risk for shorts above 28,25x
Like, subscribe and leave your comments below! 🤝
Until next time,
Ride the macro


GBPCHF H4 - Short SetupGBPCHF H4 - Approaching/fighting that huge 2.00 handle. Also ties up nicely with our previous supply zone and resistance area, could be a good price to look to short from.

Simple pivot strategyFree money. Price usually never misses daily pivot. And if price does miss pivot during a day - it will come back to that level sometime later. God knows when but it will. This applies to all pairs but works very well in gold as you see.
If you see price open with a gap away from the daily pivot - you can safely target daily pivot 90 percent of time it will hit it.
Those 10 percent of times when price might miss a pivot happen during the strong trends. Actually a missed daily pivot or two marks a START of a strong TREND.
Test various instruments yourself and just get convinced.
The same applies to weekly and monthly pivots. With missed weekly pivots you can catch dozens of pips.
GOOD LUCK!
