Polygon · Bottom, Recovery & 5,000% Growth PotentialPolygon has been bullish since April, clearly rising from its base for months. Now this Cryptocurrency trading pair is preparing for a new phase and market cycle. It is preparing for its 2025 bull market wave.
Polygon after a major drop produced a clear bottom and higher lows. This process has been active now four 120 days/4 months. This is a long consolidation period and there are no new lows, clearly. A rising triangle as a reversal signal is also present on the chart.
The accumulation period has been lasting, we can see how patience is key for success. Who would be able to hold for four long months? Who is still holding wise for 120 days?
Well, those who wait get paid. Those who waited will get paid but there is no need to wait because you can still buy and profit from the incoming bullish wave. The difference is that prices are higher now so growth potential is limited compared to several months in the past, that's how it works. The market builds up strength slowly and as this strength is being built prices grow.
When there is enough strength, enough interest and enough growth, the masses enter the market and this produces a major bull run. I've been warning you, we are getting very close. The action is already happening now, don't be surprised when you see a 300%+ bullish jump. That is exactly what is coming and it will all happen within a few months.
Expect 500% to start but aim for 1,000%, 2,000% and in some cases even more. Many good, strong and reputable pairs will grow 3,000%, 4,000% or 5,000%. Polygon will be one of the big ones.
Thanks a lot for your continued support.
Namaste.
POL

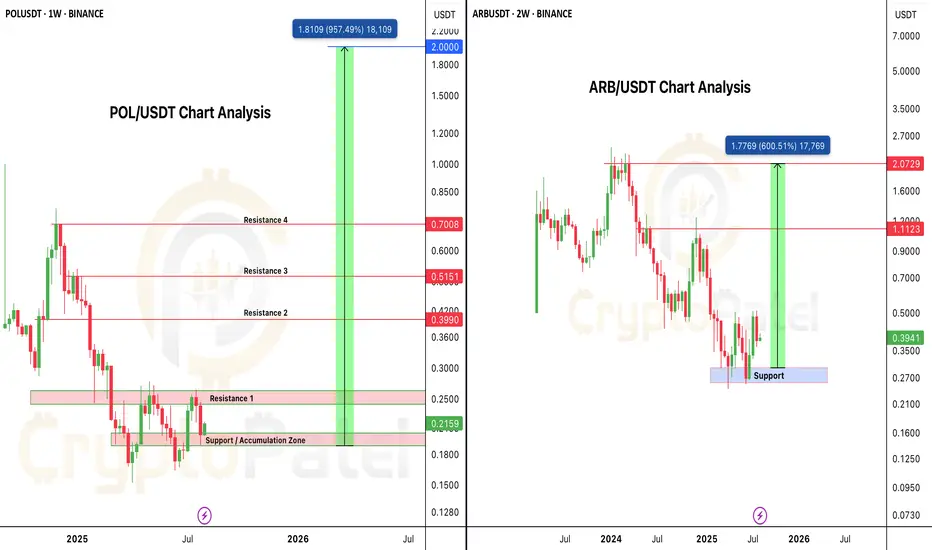
Altseason is Loading... Which One’s Your 10x Pick – $POL or $ARB🚨 BULL MARKET ACCUMULATION ALERT 🚨
Both PSX:POL and AMEX:ARB are currently trading below $0.40, and both charts are showing strong long-term bullish structure.
PSX:POL Analysis:
• Current Price: Under $0.40
• Strong Entry Zone: $0.20 – $0.17
• Bull Run Targets: $2 – $5
• Backed by powerful fundamentals, strong tech, and serious investors.
AMEX:ARB Analysis:
• Current Price: ~$0.40
• Key Accumulation Zone: $0.40 – $0.30
• Bull Run Targets: $2 – $5
• One of the strongest L2 ecosystems with deep liquidity and solid fundamentals.
Both are technically oversold, fundamentally strong, and positioned for major upside in the coming altseason.
Question for the community:
Which one hits $2 first — PSX:POL or AMEX:ARB ?
Drop your pick below 👇
NFA & DYOR
Polygon, Higher Low? Easy 1,000% Profits PotentialFour weeks red! Do you really believe the market will continue moving lower? If the answer is yes; think twice, stop! Think again.
Four weeks red is all that you will get you bearish bastard.
Your time is over. We are taking over, the bulls are entering the game.
You had your fun, you had it for a few days.
You can't have it anymore, I am calling my friends.
Friends, look at Polygon (POLUSDT), the chart looks great.
Whenever there is a retrace within a bull market, this is an opportunity to enter again.
Great timing, great prices; the start of a new bullish wave.
Prices are about to grow... Everything is about to grow... Crypto is going up. Are you in or are you out? Did you miss the initial bullish breakout? That's ok. The next bullish wave will 4-6 times bigger than the previous one for this pair. Sometimes even more. Here we have 1,000% profits potential as an easy target.
Get ready and be sure to be prepared.
Start buying like the world is about to end. Why?
Because there will be so much growth in the coming days, that you want to profit all the way. To profit you need to be in, you have to buy when prices are low.
You cannot wait for the green candle, the best time is now.
Thanks a lot for your continued support.
Namaste.

POL: Ideal Bullish SetupDuring early April to mid-May, #POL had one of the strongest bullish rises among top-tier projects.
The ongoing correction appears to be a healthy pullback before the next major leg up.
Holding above $0.15 keeps the setup valid. Passing $0.257 confirms a new rally.
#Polygon

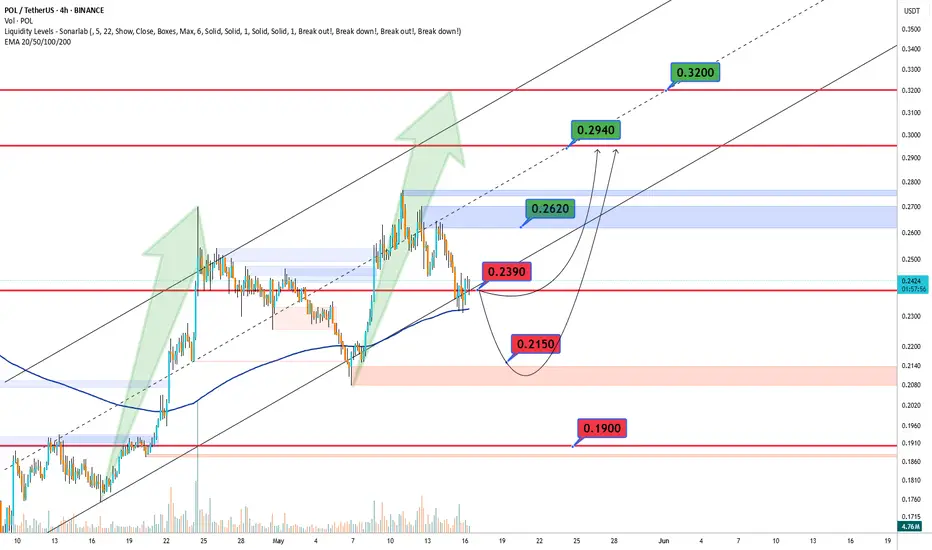
POLUSDT Bullish🔍 BINANCE:POLUSDT Technical Outlook – May 16 🔍
Bulls are watching the key $0.2390 level! 🔼
If broken, we could see a rally towards $0.2620, then $0.2940, and even $0.3200 if momentum stays strong 🚀
But if price gets rejected... 👀
Watch support at $0.2150 – and if that fails, $0.1900 could be next 🛑
📊 Current zones to watch:
🔴 Resistance: $0.2620 | $0.2940 | $0.3200
🟢 Support: $0.2390 | $0.2150 | $0.1900
Polygon's Comeback!#Polygon, a leader of the Ethereum ecosystem since 2019, shows signs of a major comeback after its recent bounce.
Maintaining $0.15 keeps the bullish case valid. Passing $0.28 is the first confirmation, while clearing $0.77 paves the way to target the ATH.
#Matic

Polygon Ecosystem Token Last Chance, It Is Not Too LateLet's close the day with a classic —RSI bullish divergence.
Polygon Ecosystem Token (POL) has been moving lower and hit bottom on the 7th of April. It's RSI on the other hand isn't doing the same, it bottomed in early July 2024. While POLUSDT went on to produce lower lows, its 3D RSI has been doing higher lows. This is a very strong bullish divergence and also a classic reversal signal.
This signal coupled with volume and marketwide action confirms that the bottom is in.
This pair is going through a pause now, a small one, before additional-huge growth.
The market is giving us one last chance to buy all we want before massive growth.
When the next move starts, there will never be a chance to buy at prices like we have now today. This is good. Cryptocurrency will evolve and the entire world will benefit.
This is a friendly reminder.
Time to work. Wake up!
It is not too late.
Namaste.

Polygon POL ex-MATIC price analysisIs the price of #POL ex-#Matic starting to wake up?
For those who are new to the crypto market, we will remind you that the last time the price of OKX:POLUSDT grew significantly was back in 2020, and since 2021 it has been in a downward trend.
The main task for #POLUSD buyers is to try to fix the price above $0.30.
📈 Only after this condition is met can a difficult and thorny path of growth to $0.66 open up.
There will surely be many people willing to sell #Polygon along the way, after 4+ years of sitting in a drawdown.
_____________________
Did you like our analysis? Leave a comment, like, and follow to get more

POL is breakout out of the descending wedge upper trend line.POLYGON is now trading outside the upper trendline of the descending wedge pattern and may be preparing for a substantial move in the month of May.
Good luck, and always use a stop-loss!

POL: The Return of The Matic#POL recently bounced in what could be a bullish reversal, possibly marking the end of a 3-year corrective major wave (4).
If the $0.151 low holds (stop-loss), a massive bull run shall start for #MATIC.
Passing $0.768 confirms the bullish idea of targeting the ATH.
#Polygon

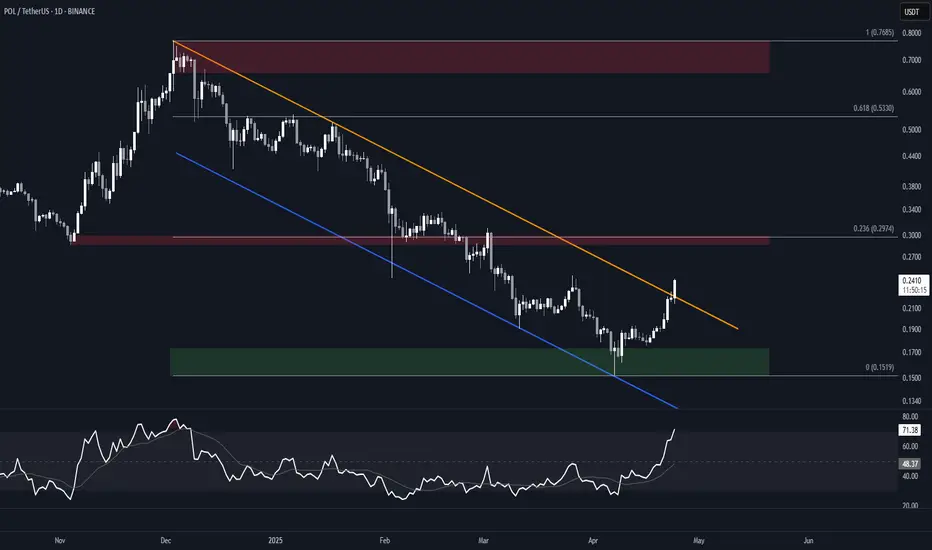
POL (MATIC) Falling Channel BreakoutBINANCE:POLUSDT is attempting a breakout from a nearly 6-months long falling channel. A daily close above the resistance would offer confirmation.
Watch for a potential retest of the resistance as support, as the overbought Daily RSI could signal an imminent pullback.
Key Levels
Aside from the support, these are all good candidates for partial TPs.
• $0.15-$0.17: Bull order block and current support
• $0.30: Previous S/R, 0.236 fib of the move down, and HVN. Will likely offer resistance.
• $0.53: Previous S/R, and 0.618 fib of the move down.
• $0.66-$0.77: Main supply zone, and December 2024 high.
MATIC/POL buyers beware; bearish signals in the mid-term (1W)The MATIC/POL pair has been dropping for over 1200 days from its peak price, but the structure suggests that a new bullish pattern may have started from the point where we placed the red arrow on the chart.
We’ve marked a supply zone on the chart that could reject the price downwards.
The minimum expectation is for the price to drop to TP1.
The best buying zone for MATIC/POL is the green zone at the bottom of the chart, which could push the price upwards by more than 500%. In fact, it is expected that wave A of the bearish pattern or X wave will end in this area, and the price will enter a mid-term or even long-term bullish phase.
A weekly candle closing above the invalidation level will invalidate this analysis.
For risk management, please don't forget stop loss and capital management
When we reach the first target, save some profit and then change the stop to entry
Comment if you have any questions
Thank You

(MATIC) POLYGON "past ticker"Polygon was originally listed to Coinbase on 3/11/2021. Now what was MATIC goes by POL. POL was listed during September of 2024. For whatever reason it seems like Polygon (POL) has not seen as much attention as with when Polygon was (MATIC). Also, Solana (SOL) has been the main avenue of attention for the last couple of years outside of the mass appeal for NFTs on Ethereum's blockchain and Bitcoin payment system, savings adjusted reality.

Polygon Ecosystem 4,300% Potential @10XHere we have several signals related to the candles low and close.
We've been looking at Polygon (POLUSDT) for a long while now and this is a great example of 'patience is key.' Definitely mandatory to have patience. It takes time for the bullish wave to unravel because we are always early, but once the action starts it cannot be stopped. We have the blessing of being able to be around right at the bottom, with plenty of time to plan, buy-up and accumulate. Many people won't be as lucky, they will hear/learn/know about the market only when it is too late or when the bullish wave is halfway.
The last candle closed as a hammer with the highest volume ever. The session low is a higher low compared to the 3-Feb session. A hammer is a reversal signal when it comes at the end of a trend. The high buy-volume confirms the hammer as a bullish reversal signal. Normally, 1-2 weeks are needed for confirmation but we know that will happen next. I don't wait.
The close this week (last week) ended up being higher than the late October 2024 market low. This is another important signal. Twice POLUSDT wicked lower in February, but closed above this level. This level is marked with a purple line on the chart.
As a friendly tip. We are active with high leverage on this pair.
The chart is ready, the market is ready and timing is great.
430% potential with 10X can lead to 4,300%. This is possible and do-able. There will be more of course. Opportunities abound in this market. Crypto is going up. Buy and hold.
Thank you for reading.
Namaste.

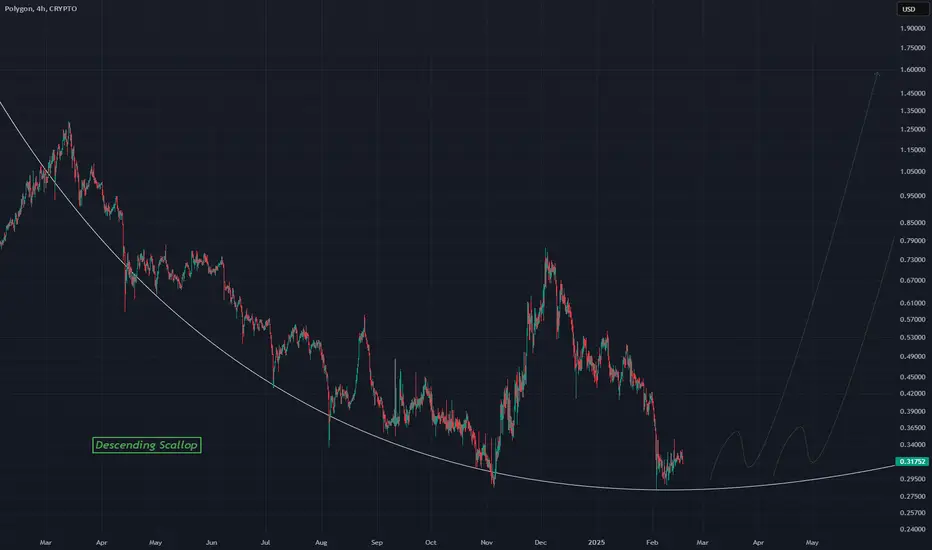
MATICUSD - Descending Scallop Reversal PatternA reversal pattern on this 4Hr chart for MATIC
MATIC has been beaten down hard and is due for a reversal and this pattern suggests it
Price slowly will flip towards the bulls favor and they will take control
The scallop pattern can be identified by a curve like this, this one being a descending one
Again the 4Hr chart
POL buying opportunity PSX:POL shows signs of potential support at $0.25-0.3, aiming for a triple bottom. If it holds, expect a move to $0.55. Always do your own research before investing. #crypto #investing

Forever Crash? The Truth About Polygon's Ecosystem Token (POL) Remember Cardano last year?
Remember how Cardano became weak during the second part of 2024 and continued to be weak for so long? How did it all end? It ended with a very strong bullish wave.
After the bearish phase, Cardano ended up being one of the strongest moving pairs.
The same can happen in this upcoming cycle with POLUSDT.
The following is also true for Notcoin (NOT).
The lower it goes, the stronger it grows when the time is right.
This pair right now is bleeding massively but this shouldn't be a cause for concern. The market moves in cycles and within these cycles we have waves.
A bearish wave is followed by a bullish wave.
A bullish wave is followed by a bearish wave.
The positive side of a bearish phase is the fact that you can't have a forever down-wave. If it is bearish now, it will turn bullish next.
The last peak was hit in early December 2024, more than two months ago.
A Cryptocurrency trading pair, within a bull-market year, can go bearish for 2-3 months, not more. This means that POLUSDT is getting very close to producing a reversal, very close to a change of trend.
The market has been going down. We saw some bullish action but this action wasn't a bullish trend. It was simply a "bounce" within the broader decline, here starting March 2024.
The great news is that the next rise won't be a bump, it will be an uptrend and an uptrend produces higher highs and higher lows. We are set to experience long-term growth.
Right now it might be hard, but patience is key.
The market can be red, shy and weak now, but everything will change within weeks.
Believe it or not, the time to buy is now.
We are in the accumulation phase.
When the first move starts, it will be too late for low prices; there will be opportunities to enter and to enjoy massive growth. But only those with a vision can buy and accumulate when prices are low.
It will be a life changing bull-market.
It will be the biggest bull-market in the history of the Altcoins.
Bitcoin will be really strong but standard.
The Altcoins will blow-UP.
Namaste.

POL/USDT: Ready to Rocket Past Resistance?POL/USDT is currently consolidating within the daily FVG after pulling back from its peak. Since early December, the price has remained below the descending trendline, acting as resistance. A breakout above this trendline could trigger bullish momentum, presenting a strong entry opportunity. Key targets are highlighted on the chart.

MATIC returning to equilibrium would be a 128% gain from here!MATIC is looking extremely undervalued at current levels. The price has pulled back considerably since the "Trump election pump" and is forming a nice wedge on the 4-hour chart, which is currently on a four-count. A price move back to equilibrium from the wedge's bottom trendline would, by itself, result in approximately a 128% gain.
Longer term, if the price breaks out of the monthly chart wedge pattern (see comments below for the chart), which is also currently trading at a four-count, we could see some incredible price appreciation over the next 6 to 9 months.
Good luck, and always use a stop-loss!

POL - Bullish Pressure Soon!Hello TradingView Family / Fellow Traders. This is Richard, also known as theSignalyst.
📈POL has been overall bearish trading within the falling channel marked in blue.
Currently, it is approaching the lower bound of the channel.
Moreover, the purple zone is a strong structure and demand.
🏹 Thus, the highlighted blue circle is a strong area to look for buy setups as it is the intersection of support and lower trendline acting as a non-horizontal support.
📚 As per my trading style:
As #POL approaches the blue circle, I will be looking for bullish reversal setups (like a double bottom pattern, trendline break , and so on...)
In parallel, for the bulls to take over long-term, a break above the upper blue trendline is needed.
📚 Always follow your trading plan regarding entry, risk management, and trade management.
Good luck!
All Strategies Are Good; If Managed Properly!
~Rich

POLYGON updatePOL full send to a new ATH!
Breaking 0.285 is the stop-loss.
Passing $0.755 is the bullish confirmation.
#Polygon

Polygon (POL) AKA "MATIC" - Long Key LevelsPolygon (POL) or "MATIC" has experienced a strong rally recently, climbing from its monthly low of $0.40 to its current price of $0.70. This implosive move has brought the bulls to push POL to a critical descending trendline resistance level that the bears have held in a long-term downtrend since 2022.
The key level to watch is the $0.76 mark, where the neckline and trend line meet with previous resistance zones. A breakout above $0.76 could potentially surge POL to it's 1st target which is around a resistance level of: $0.89. If momentum continues, then price action will retest between: $1.23 - $1.48 representing a potential upside of +100% from the breakout at this current point

The Bullish Case of POLYGONPOL or MATIC made a deviation in the 1st of Nov this year which confirmed a major bottom to end the wave (4) which lasted for almost 3 years. Now the target is a new all time high!
Passing $1.29 confirms the bullish idea.
Breaking $0.32 is a stop-loss/ invalidation.
