#POL/USDT#POL
The price is moving within a descending channel on the 1-hour frame and is expected to break and continue upward.
We have a trend to stabilize above the 100 moving average once again.
We have a downtrend on the RSI indicator, which supports the upward move by breaking it upward.
We have a support area at the lower limit of the channel at 0.2000, acting as strong support from which the price can rebound.
Entry price: 0.2023
First target: 0.2053
Second target: 0.2091
Third target: 0.2134
Poleflag

#POL/USDT#POL
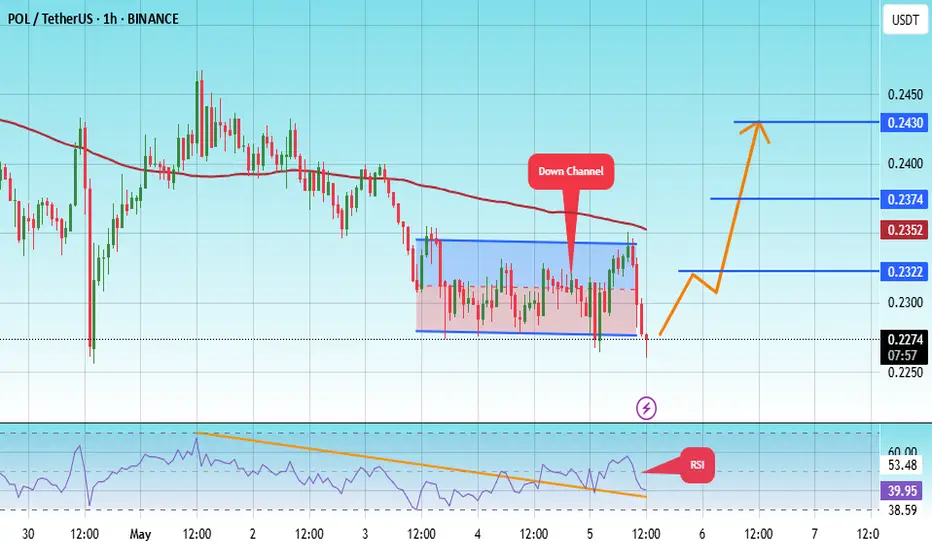
The price is moving within a descending channel on the 1-hour frame, adhering well to it, and is on its way to breaking it strongly upwards and retesting it.
We are seeing a rebound from the lower boundary of the descending channel, which is support at 2270.
We have a downtrend on the RSI indicator that is about to break and retest, supporting the upward trend.
We are looking for stability above the 100 moving average.
Entry price: 0.2270
First target: 0.2322
Second target: 0.2374
Third target: 0.2430
POV @ ICICI PRUICICI PRUDENTIAL gives Long Trend line breakout on 7th June23, and rallied till 13th July then after consolidation creating flag pattern. today, 11th September 23 giving a flag pattern breakout, so I will go bullish if 585 above closed on daily basis. that close give me confirmation of breakout of nearest resistance also. my first target will be recent higher High and after that getting 2nd and 3rd target using fib Extension tool

will Bitcoin increase?Hi every one
➡️BTC has done a Impressive Movement recently but the odds of another bullish Movement is Pretty high because the pattern which BTC is in, Is a Bullish Pennant Pattern! Since The break out has not happened, there is no confirmation of a Bullish Movement But If It happens, we Can Expect a Bullish Movement as much as the Measured Price movement (Pennant pole) to happen!
🟡Summery:
-BTC has been Bullish Recently!
-The odds of another Bullish Movement is High!
-Bullish Pennant is Visible on The chart!
-No break out yet!
🤑Stay awesome my friends.
_ _ _ _ _ _ _ _ _ _ _ _ _ _ _ _ _ _ _ _ _ _ _ _ _ _ _ _ _ _ _ _ _
✅Thank you, and for more ideas, hit ❤️Like❤️ and 🌟Follow🌟!
⚠️Things can change...
The markets are always changing and even with all these signals, the market changes tend to be strong and fast!!


NTPC Trade Plan with Fresh breakout1. Trend - Bullish
2. Strength - Very strong
3. Breakout - Confirmed
4. Consolidation before breakout

BTCUSDT Bullish pole and Flag BTCUSDT has created a Bullish pole and Flag pattern on 1 hour time frame. If it breaks 20700 our first Target would be 21000 and second Target 21200.

BANKNIFTYHello and welcome to this analysis on Bank Nifty
The steep gap down on Monday breached a very crucial support zone of 33800-34000. Post the gap down we saw attempts of recovery which appear more sideways with a very minor higher low higher high bias.
The structure appears to be making a Bearish Flag with the prior decline as the Pole. We can see a squeeze formation so far in it in lower time frame. It is indicating one more attempt for 33800-34000 before it resumes downward move towards 32500 and lower.

TRENTTrent made pole n flag pattern & it broke out of it & trading above comfortably with good volumes..
Could be bought with mentioned stoploss & target

BAJAJELECBajajelec has formed three patterns on chart; Cup n Handle, pole n flag & Bullish flag pennant.
Unfortunately it dint breakout of any of these patterns, so cannot be recommended to buy now.
But if breaks above 1320 then its a breakout in all these pattern & then it could be bought with stop-loss of 1275 & technically targets are unbelievable as per patterns which is 1600+

PidilitePidilite made an flagnpole pattern also took support @ 50% fib retracement level.
Buy with sloss 2325 & tgt of 2500

XRP/USDT - 1W - Potential bull flags and channel breakouts Hoping XRP will push up hard with/after BTC. Mid-Nov to mid-Dec could be crazy - the top even?
Binance Weekly XRP/USDT chart.
Blue curves showing overall long term trend.
Yellow channel (flag) and pole's measured move, both meet top of rising red wedge trend.
Yellow channel's measured move also hits the 0.5 fib extension from the last impulsive move up.
Yellow pole's measured move could tap the 0.618 fib extension area.
White bull flag pole's measured move, also looking like it wants to tap the 0.618 fib extension area.
Should price break up out of rising red wedge, measured moved hits a long term dotted pink trend line. It could even tap the 0.786 fib extension.
Price breaking below rising red wedge = bad times and/or DCA opportunity.
Let's see.

BITCOIN BULLISH FLAG 🏳🐂 (☠️🐻☠️)Hi everyone 👋🏽
🕊 Wish y'all have a profitable lifestyle 🍀
📌 BITCOIN /USDT DAILY CHART
📌 PRICE ACTION - BULLISH FLAG - DOUBLE BOTTOM
📍BITCOIN has created a bullish flag in daily chart along with the double-bottom
✍🏼 Straight to the point, BTC is looking bullish in long-term. I was waiting for this flag for about a week lol =))
📝 First target of the bullish flag is half of the leg that has been created since the flag pole
📝 Second target of the bullish-flag is the complete leg that has been created since the flag-pole
📏 You can calculate it with fibo expansion.
✍🏼 Another confirmation for further growth is the double-bottom (if we do not consider it a tripple-bottom); the price has not reached the targets of the double-bottom yet!
✍🏼 These price ranges 43-44k zones are risky entry zones; so safe entry zones can be when the price breaks the flag.
⚠️ PEOPLE fomo at 53k and panic sell at 40k! Guys, please do not listen to anyone trying to make FUD or FOMO. Just learn risk management in parallel with money management and enjoy your trades.
⚠️ I really hate it when people say "awww... BTC has fallen just exactly as I've predicted" . It is really cringy to publish more potential price fall just after one or two days of clear bearish momentum!
⚠️ You only have two friend: CHART & TREND (Long-term trend is STILL bullish)
⚠️ Everybody makes mistakes; whenever I am reading an idea and at the beginning I read the " as I predicted " or " just as I said ", I quit reading!
⚠️ I am never ashamed of my mistakes; you can clearly see in my trading-view page that sometimes I have made mistakes. Moreover, I will link my TA in 13th of September and show you guys that I really wanted this downfall in price! :) NOT JUST ONE DAY AFTER THE BEARISH MARKET
😇 I had fun the previous week and did not look at the chart AT ALL. I enjoyed my life and bought the dip!
THIS IS NOT A FINANCIAL ADVICE
... To be continued ...

Typical Pole and Flag PatternInvest by knowing the risk. But the stock is really good for long term. PE is higher as it is a growth company.

OMG/USDT - Huobi - Potential Bull Flag and DCA OMG at resistance meeting top of pink channel.
If it bounces at the 21EMA step line then price could break up and out to meet the pole's measured move.
Green CPR line also meets the pole's measured move target range.
Closing below the 21 EMA steps could bring price back lower into the pink channel.
Price could bounce on the green 50 EMA and/or blue CPR ranges.
Lower still, the red 200 EMA could be good for a bounce and long around $13.88.
Could get a potential wick down to grab the $12.88 range also maybe.
All dependent on BTC as always.

Hindustan Unilever , Flag & Pole in 1HOn a 1 hour chart a pole & flag pattern is seen , it is actually inside a channel pattern on a daily chart so keep your eyes wide open on this .
Simple price action, no Jazz!

Tatachemical ready for breakout 1DA triangle inside a pole & flag. Some awesome setup, keep any eye.
Pure price action, no Jazz!

Britannia about to break on weekly chartA perfect pole & flag pattern is visible in Britannia, hoping for a breakout here, keep an eye.
Simple price action , no jazz!


JSWsteel , possible breakout!With metals on spree , Jswsteel looks like will give breakout soon, keep an eye, here is a beautiful pole & flag pattern.
Simple price action, no jazz!

SNOWMAN LOGISTICS - How far can it go ?Breakout from a Pole Flag Pattern + a longer Triangle Pattern.
MACD positive and is about to move above the Histogram.

Thirumalai ChemicalsGood Breakout of Channel consolidation
we can expect 140-150 in comming days
Before taking any entry ask your financial advisor

