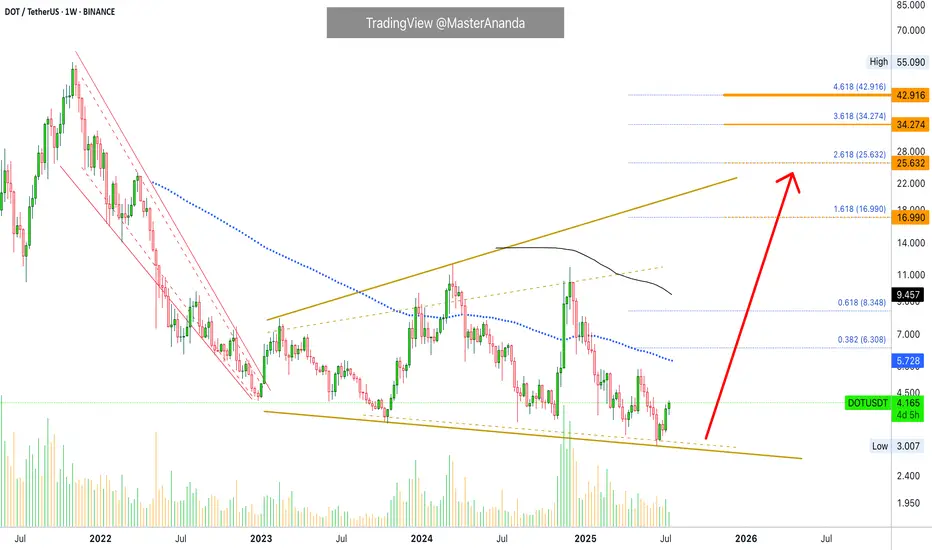
DOT It will grow soon...The DOT will increase $1 and reach to the top of the wedge in the coming weeks .
Best regards CobraVanguard.💚
Polkadot

DOT/USDT Profit Heist | Don’t Let Bears Catch You🚨Polkadot Crypto Vault Break-In Plan | DOT/USDT Robbery Blueprint🚨
🌍 Hola Heist Crew! 💰📡
Ready for another vault-cracking strategy? Here's your DOT/USDT Crypto Heist Plan based on pure Thief Trading Style™—a fusion of smart-money tactics, technical traps, and stealth execution. 🎯💸
🔓 🎯 Entry Zone – Lockpick Ready
"The vault’s wide open! Swipe the bullish loot anywhere, anytime—but smart thieves plan pullback entries."
📌 Recommended: Use 15–30 min timeframe for sniper buys near swing highs/lows.
💡 Pro Move: DCA with layered buy limits like a seasoned thief stacking getaway routes. 🧠💵
🚔 Stop Loss – Evade the Patrol
📍 Secure SL just below the nearest 4H candle wick low (e.g., 4.000 zone)
🔐 Customize SL to match your risk profile & lot size—escape routes vary by thief rank.
💣 Target – Break the Vault & Vanish
🎯 TP: 5.200
🕶️ Optional: Dip out early if market heat rises near resistance traps. Escape clean.
⚠️ High Alert – Police Checkpoint Ahead
👮 Red MA Zone = Barricade.
It’s a hotspot for bearish cops + consolidation traps.
Only strong thieves survive here—book profits before you get cornered.
💼 For Scalpers & Swing Agents
🔍 Scalpers: Only ride long—quick bags, quick exit.
💰 Swingers: Follow the full robbery plan. Patience pays.
🎯 Trailing SL is your body armor—keep it tight.
📊 Fundamental Force Behind the Break-In
🔥 DOT/USDT is flashing bullish momentum supported by:
Sentiment shift
Intermarket alignment
COT positioning
On-chain data
📡 Stay updated via macro reports & sentiment dashboards—intel is profit.
📰 News Alert – Chaos Creates Opportunity
🧨 Avoid fresh entries during high-volatility news drops.
🎯 Trailing SL can save you during headline crossfire.
❗️Disclaimer:
This blueprint is for educational purposes only. Always conduct your own recon and apply strict risk management. Thieves who don’t scout first... get caught.
🚀 Boost the Heist – Support the Crew
💥 Smash that “Boost” if this plan adds value 💥
Your boost fuels more chart crimes, more profit hits, and a growing rob-the-market brotherhood! 💪💼📈
🧨 See you in the next job... Stay hidden, stay funded!
– Thief Trading Style™ HQ 🕶️🐱👤💰🚁

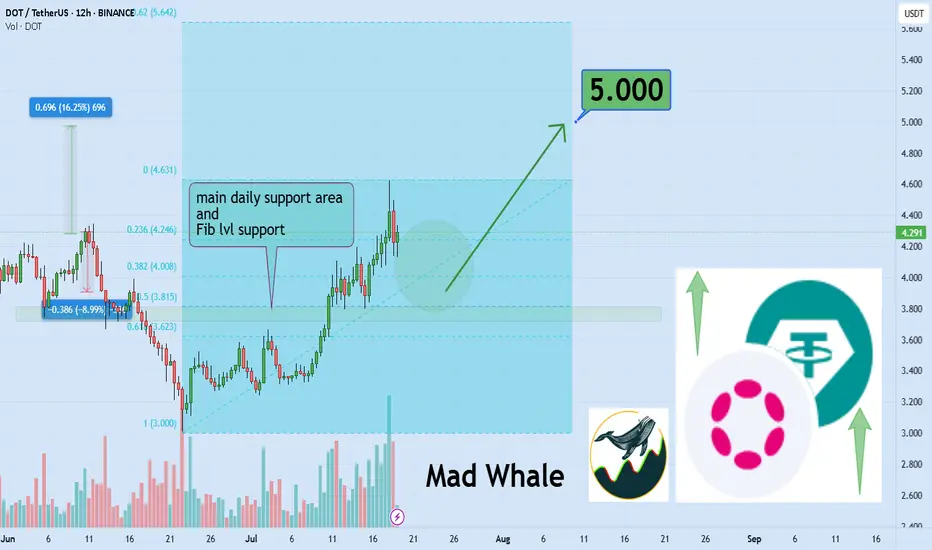
DOT Eyes 15% Rally, Targeting Key $5 Resistance LevelHello✌
Let’s analyze Polkadot’s upcoming price potential 📈.
BINANCE:DOTUSDT has broken above multiple daily resistance levels and is now consolidating near a key support zone. With this bullish structure in place, I'm targeting a minimum 15% move to the upside, with $5 as the main take-profit level. 🚀📈
✨We put love into every post!
Your support inspires us 💛 Drop a comment we’d love to hear from you! Thanks , Mad Whale 🐋
DOT Mid-Level Retest — Setup for the Next LegDOT is testing a key breakout level that previously capped the rally. If buyers defend this zone, the next major target sits around $5.50 — but failure here could send it back into range. High reward, high risk setup forming.
DOTUSDT - A Sleeping Giant in the Bull Market?Polkadot (DOT) has always been one of the leading assets during bull markets
A $10 target now seems inevitable after a clean breakout above the main trendline, followed by a successful retest.🎯
This $10 level has historically acted as a major resistance zone, often manipulated during each bull cycle — price touches it, then sharply pulls back.
But the big question is:
Will DOT break this psychological barrier this time?
Why not?
With many investors losing faith in the crypto market and considering leaving altogether, this might actually be the perfect setup for a massive price explosion.
Historically, the craziest pumps tend to come when confidence is at its lowest.🚀
Best regards Ceciliones 🎯
Polkadot Opportunity Buy Zone · Near Bottom · 2025 Bull MarketThis is what I mean: Opportunities are endless in this market. Compare Polkadot to say, Solana or Cardano which I shared just recently. Can you notice the huge difference?
First, Polkadot is still trading below EMA89 and MA200 weekly. Not to be taken as a bearish signal but instead to be interpreted as the pair being very early in its bullish cycle.
While Solana is trading ultra-high, super-strong, one of the strongest pair, which is bad if you want to go LONG (high risk with a small potential for reward), Polkadot is trading within the opportunity buy zone, very close to its bottom (low risk vs a high potential for reward).
I am a buyer. I am a Cryptocurrency fan. I am a bull.
So I want low prices and that is why low prices are good.
This is an opportunity, DOTUSDT. It is trading low now but it won't be trading this low for long, not even weeks. It is likely to start advancing within days. Once the bottom is gone it is gone forever. These altcoin projects will be the new tech giants and they will rise long-term. This is your chance. This is your opportunity for long-term trading success. Once you catch the bottom, you can't go wrong.
The chart is showing a long-term broadening channel. This is part of the transition period, from bearish to bullish, the consolidation phase. While the channel looks pretty big, the swings, if you activate the linear chart you can see the truth. Perspective. You will see a true bottom on the chart. From the bottom we grow.
When the action challenges the lower boundary of the channel, support; the market reverses, in this case Polkadot will start to go up. It is already growing. Several weeks rising. The upper boundary is the minimum giving us more than 425%. But we are not aiming for the minimum, we want high in the least, we want the maximum, so let's go for a new all-time high or just below the last one.
Namaste.
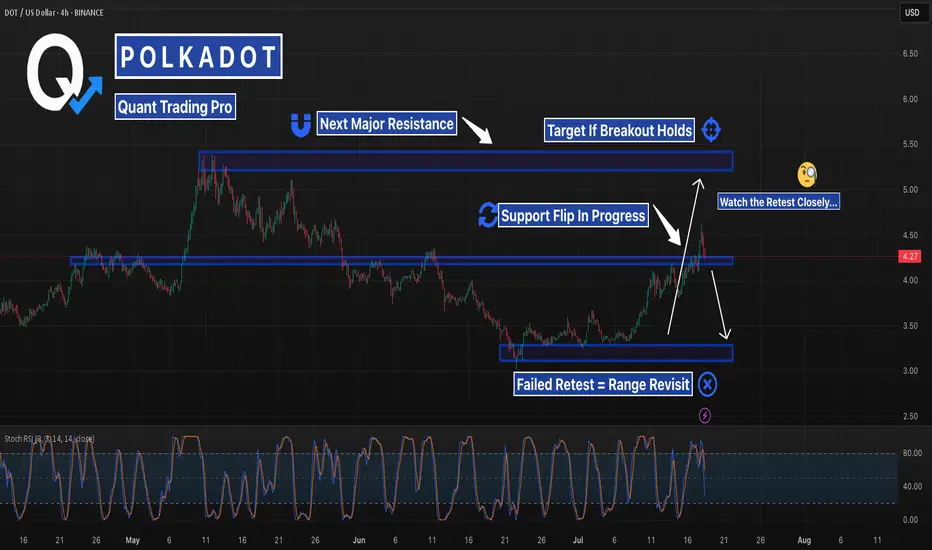
DOTUSD – Trendline Break Retested | Breakout or Trap?Polkadot broke its multi-week descending trendline and reclaimed support, but now faces resistance just above $4.20.
With a clean structure retest and rising momentum, this becomes a classic breakout-or-fakeout setup.
Measured move points to $5.40 if it runs.
Invalidation sends us back to $3.60.
#DOTUSD #Polkadot #SupportResistance #BreakoutTrading #TrendlineBreak #QuantTradingPro #TradingView

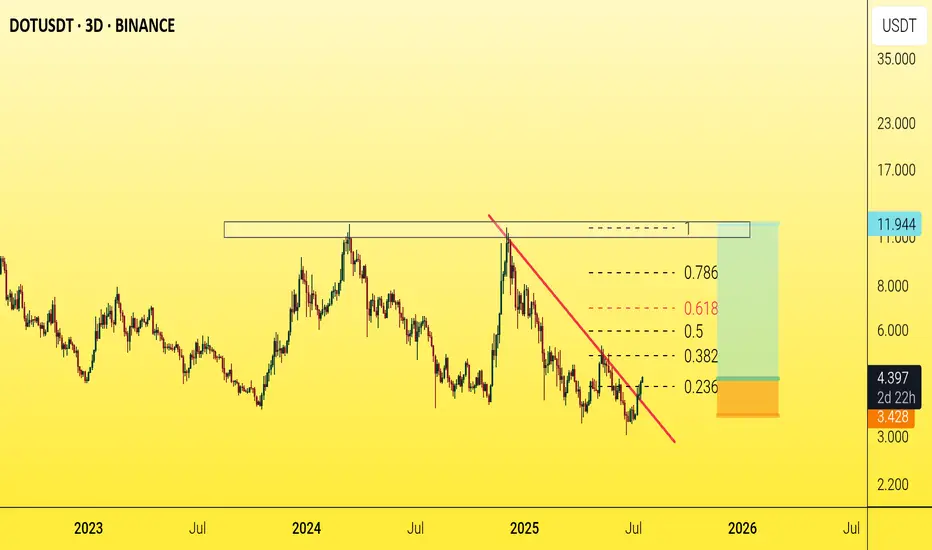
Polkadot DOT price analysisAt night, only CRYPTOCAP:BTC impressively updated its ATH, while the rest of the altcoins... haven't really woken up yet after many months, if not years, of hibernation.
For example, if memory serves, in 2020, CRYPTOCAP:DOT was buying at $1.7-1.9 during the presale (please correct me in the comments if I'm wrong). Now, the price of OKX:DOTUSDT is not that far from the initial price.
🤪 It seems that no one believes in the ultra-fashionable #Polkadot “parachain” fairy tales anymore, and that is why if the price of #DOT rises again to $11-12, it will be super happiness and luck.
✈️ Well, dreams that #DOTUSD will cost $42 again can only be included after the price has firmly consolidated above $12, and with the current price dynamics, this is something at the level of fantasy.
_____________________
Did you like our analysis? Leave a comment, like, and follow to get more

Wyckoff Pattern- To understand trading at its core, you need to understand the Wyckoff Theory.
- Everything you need is in the chart and yes, it's simple and might look like copy-paste, but it's pure Wyckoff.
- Remember this post i made in 2021 ? check it again :
Remember, trading is like a washing machine, it shakes you up, spins you around, and pressures you to sell when you should be buying or Holding.
Not a price prediction, just a smarter way to level up your strategy.
Happy Tr4Ding !

POLKADOT on last supportI think $3 is the very strong support for DOT, and the blue zone will hold, and i believe $18 resistance is very reachable for the next few months after $10 resistance got broken.

Polkadot: Bottom Already in?Given Polkadot’s recent sharp rebound toward resistance at $3.66, we consider it 35% likely that magenta wave alt. has already bottomed at $3.02. This would be confirmed by a meaningful breakout above said $3.66 level. Our primary scenario, however, still calls for lower lows as part of wave – with a break below the same $3.02 support.
📈 Over 190 precise analyses, clear entry points, and defined Target Zones - that's what we do.

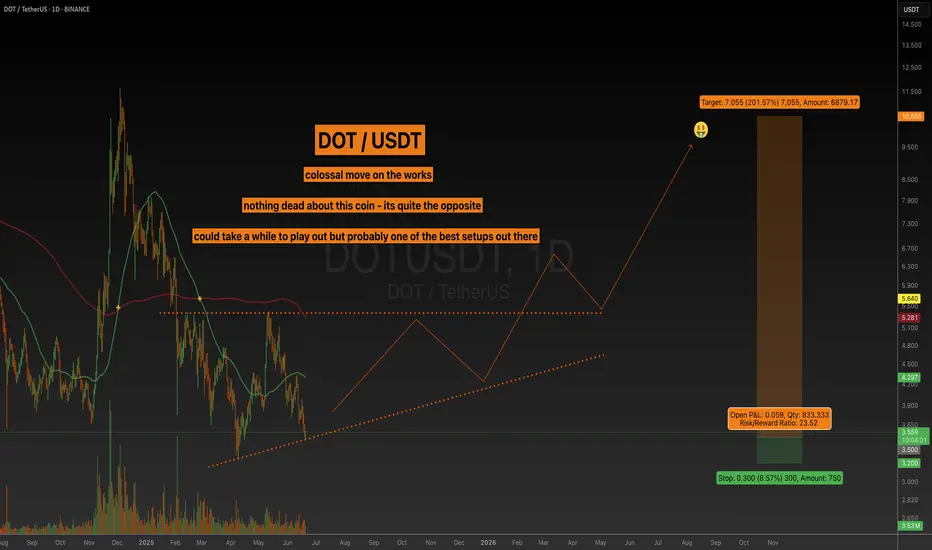
DOT - On The SpotEvening fellas,
Some say its dead, some say its asleep...
I'd stick with the second option, as to me, it's by far one of the best tech out there. Some say good tech doesn't matter, some say it does... Once again, I'll stick to the second option.
It could take a day, if they wanted... it might take years... but this is looking ahead, looking deep, looking for those big gains that change lives.
Trade thirsty...

DOT ANALYSIS (3D)Polkadot appears to have reached a fresh and significant support zone, which is potentially where the corrective wave C may come to an end.
If wave C completes here, the price could begin a strong recovery. However, it’s important to note that this is a higher time frame setup, so reaching the targets may take some time.
As long as the green support zone holds, the price can move toward the mentioned targets. The targets are marked on the chart.
A daily candle closing below the invalidation level will invalidate this analysis.
For risk management, please don't forget stop loss and capital management
When we reach the first target, save some profit and then change the stop to entry
Comment if you have any questions
Thank You

Polkadot - BEWAREI have been checking out some news and fundamentals lately on this coin.
LMAO makes me laugh people still look into trading memes, investing, whatsoever... Those might get burned once again, cause this BTC.D party aint nowhere to being done. It will continue to remove liquidity from coins with no use case.
Over 30 MILLION coins, and starting today, 99% of them will not recover!
Polkadot will though, BCH will, AVAX will, LINK will, well you get the drill.
This post is about DOT so i'll focus on it. Theres HUGE interest in these levels, and different than a lot of coins it hit a perfect .886 fib and is bouncing creating a massive Ascending Triangle, that most likely will finish by next year. Thats a good 6 months from now, but its worth it.
As a matter of fact, I dont think I could name 3 other coins that in the long run will out perform DOT. Right now they are, SOL for instance is... but I dont think SOL will out perform in a few years as DOTs fundamentals are way heavier.
Polkadot (DOTUSD) is getting closer to a scary levelPolkadot ( MARKETSCOM:DOTUSD ) is coming closer to the current lowest point of this year. If it surpasses that area, then this would place the crypto in the area, last seen five years ago, bringing it closer to inception price.
Let's dig in...
CRYPTO:DOTUSD
Let us know what you think in the comments below.
Thank you.
77.3% of retail investor accounts lose money when trading CFDs with this provider. You should consider whether you understand how CFDs work and whether you can afford to take the high risk of losing your money. Past performance is not necessarily indicative of future results. The value of investments may fall as well as rise and the investor may not get back the amount initially invested. This content is not intended for nor applicable to residents of the UK. Cryptocurrency CFDs and spread bets are restricted in the UK for all retail clients.

DOTUSDT 1W AnalysisDOT ~ 1W Analysis
#DOT Buy back gradually from this support block with a short term target of at least 20%+ from this support.

DOT Will Pump 200% Next Few MonthsWe are headed to 12$ - 11$ over this year - Profiting 200%
STOP LOSS : Dailly Close Bellow 3.30$ (-15%)
Low Risq Big WIN!
Not Financial Advice , But I'm in Baby ;)
CRYPTOCAP:DOT BINANCE:DOTUSDT COINBASE:DOTM2025 BYBIT:DOTUSDT.P BYBIT:DOTUSDT COINBASE:DOTUSDT BINANCE:DOTBTC

DOT.Give me some energy !!!What I currently expect is that the price could correct slightly, as shown on the chart, and then pump by about 18% from the PRZ (Price Reversal Zone). This signal is strengthened by the presence of strong positive divergence. In summary, the PRZ is a good entry point, derived from the confluence of touchlines and pivots. However, if the price ignores this zone and drops below it, my analysis will be invalidated.
Best regards CobraVanguard.💚

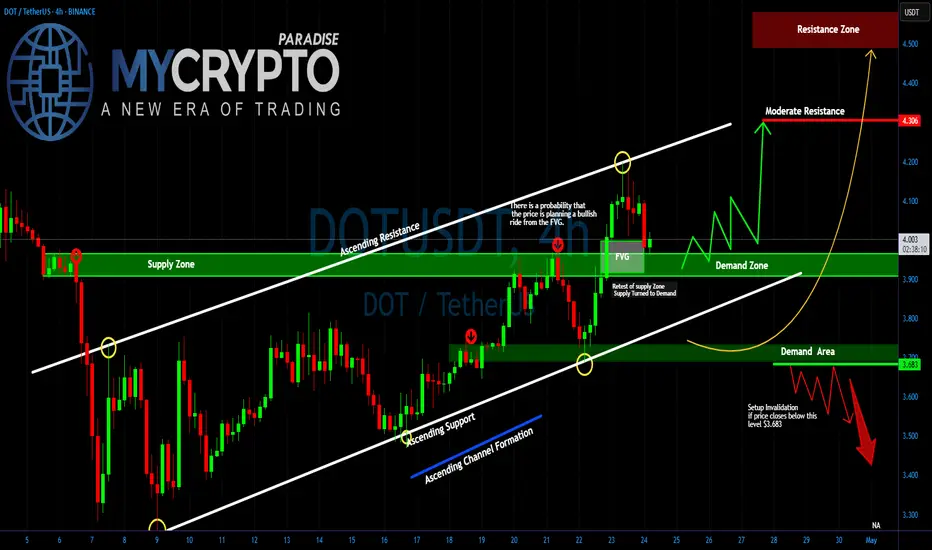
DOT/USDT About to Explode or Crash?Yello Paradisers! Are you ready for DOT's next explosive move, or will you be caught in the trap again? Right now, #DOTUSDT is sitting at a key decision point inside a textbook ascending channel — and what happens next could either print profits or wipe out the unprepared.
💎After respecting both the ascending resistance and support lines with high precision, it has now pulled back into a crucial area of interest: the Fair Value Gap (FVG). If DOT continues to hold above this level, the probability of a bullish continuation increases significantly. The area around $3.90–$3.95 is aligning perfectly with the demand zone, adding to the confluence and giving bulls a strong foundation to build on.
💎However, the real test lies ahead. POLKADOT must clear the immediate resistance around $4.10–$4.30 for the bullish momentum to gain traction. A successful break and retest of the $4.30 level would likely open the doors to a fast move toward the high-value resistance zone at $4.50 and above.
💎But here’s the twist: if DOT fails to defend the demand zone and instead closes below $3.683, the entire bullish setup becomes invalid. Such a breakdown could trigger a deeper correction, targeting the $3.40 region and possibly flushing out the overleveraged players in the process.
Stay focused, Paradisers. Be the hunter, not the hunted
MyCryptoParadise
iFeel the success🌴
PolkaDot (DOT) Structure Analysis (1D)BITGET:DOTUSDT is showing signs of strength after a deviation below the long-standing $3.70–$4.10 demand zone.
Key Levels
• 🟢 Demand Zone: $3.70–$4.10, respected since October 2023
• 🟡 Broken downtrend resistance, retested as support
• ⚪ Current falling channel (compression) following range high retest
• 🟥 Sell Order Block: $5.10–$5.40
• 🟧 Range Resistance: $5.40
• 🎯 Target on breakout: ~$7.00, potential extension to ~$7.50
Thesis
• The recent breakdown was quickly reclaimed, hinting at a possible spring/fakeout. After retesting the range high, price is now compressing within a descending channel, building energy just above demand.
• A breakout from the channel followed by an S/R flip of the $4.40–$4.60 region could trigger a rally toward the upper range.
Watching for
• Channel breakout with volume
• Clean break above $5.40 to confirm range expansion
Invalidation
• Sustained break below the $3.70–$4.10 demand zone

$DOT - Polkadot imminent bullish momentumHey traders!
Hope you are doing GREAT!
On this occasion I've decided to spot on CRYPTOCAP:DOT as its showing a clear bullish momentum ( as other alts). The chart is clear about the movement. There is no need to use fancy indicators neither a complex analysis.
Just price action.
As a brief comment, $Polkadot broke a clear bearish trend with confirmation on the daily timeframe. That's why I'm looking for a speculative trade (just in and out).
What I'm targeting? Prices between 6.00 USD and 7.00 USD in short term could be a nice zone to take profits.
Stay tuned!

DOT / USDT - Complex H & SMorning fellow traders,
Looking into this market lately, and after the previous short term uptrend the coins have been consolidating a little bit. When looking at DOT / USDT pair we can see something like a cup & handle easier that's starting to develop a handle, but I believe it's a complex head & shoulders.
Take a look at it, I think that before any major move down, creating a possible spring, we could see another move to the upside.
Trade thirsty, my friends.

Polkadot —Higher Low & Bullish ContinuationThis one is time sensitive. Polkadot (DOTUSDT) is about to produce a bullish continuation. The higher low is in and the action just turned green.
The first advance ended 12-May, it's been 16 days. There is almost no retrace, very small but it lasted more than two weeks. This is all normal price action.
The retrace ends in a higher low and the higher low evolves into a new advance or higher high. The next rise will last much longer than the previous one, say, 30 days straight up. This can be the minimum as it can go for longer.
After this advance, which will be a big one, there can be a correction followed by the bull run phase. It is hard to know the specifics because we will have six months of growth with a correction in-between. The correction can last 1 month just as it can last 3 months but no more. Most likely around 2 months, the big one.
This correction will end in a higher low followed by additional growth until we get the cycle top.
Prices are still low. It is still early.
But after the current move that is developing now, it won't be early anymore. Everybody entering the market after the start of this continuation will be late. There will be plenty of room available for growth, but bottom prices will be forever gone.
Namaste.
