DOT/USDT , Accumulation zone?Indicates the average price before the asset pumps in 2020
The price is down 93.53% from its high.
We see each time on the weak reaction of the coin (breaking the resistance line of 434 days by 58.72%).
Now is in a descending channel of 462 days , the reaction to work out the wedge +42.40% - into the resistance of the upper boundary of the channel
The price is down to low values, pushing down, there is no positive news, is it all bad?
(Creating the illusion of a commodity that has no price. Buy what is based on your analysis, don't be manipulated! They turn your head in the other direction, in the direction of the spectacle, while the backstage is preparing the next scene for you!)
Polkadot

DOTUSD request analysisThis chart are update from my previous analysis.
Right now DOT still channel up pattern, and already touch fibonacci support at channel up support, and broken channel down pattern with a strong candle.
Bullish will continue to reach previous resistance at $5.74
and we also have new bullish target at $6.41 as fibonacci 1.618 projection
*I draw path line, if $5.74 still hold bullish, our new support level at channel up support.

DOT Weekly Analysis - Are We Going to $5 or $15!?DOT broke out of its descending wedge pattern last week with a bull bar closing near its high, a strong breakout bar. Since then, the price has pulled back to the 30EMA, but will it hold?
Bitcoin is currently pulling back from its Weekly bull channel resistance as depicted in my Bitcoin 4HR and Weekly analysis. DOT will likely follow its lead with the broader market sentiment and pull back to the top of the descending wedge. If you're looking for a long, you could fade your position from here to the $5 mark and wait for a buy signal and a strong bull confirmation bar closing near its high. For the next couple of weeks, I expect the price to pull back and drip toward the downside.
Key Points
1. Breakout from Descending Wedge!
2. Pullback to 30EMA
3. Pullback may continue to the top of the wedge.
4. Bitcoin Leading Indicator, Pulling Back
5. RSI is just above 50.00, Room to Fall
You are solely responsible for your trades, trade at your own risk!
Let us know what you think in the comment section below!

DOT & Market coming down?I have a portions staked and plan on buying more but I am happily going to swing trade the portions I took out of the market.
I saved myself from some major losses of gains and I PROTECT MY PROFITS!!
I want you to protect your profits.
Plenty of people that were long term investors of all crypto were shaken out.
They went long or short 5 min early or late & missed their ride in the wrong hood.
They are now not there to help pump the price or volume and if Blackrock can watch the blood dry and then come in for the Bull run in the BULL market they would rather.
This I believe is the BEAR market bull run.
Now I have a larger portion to swing trade with.
Be safe. Good luck.
This is not financial advice. Everything can shoot the moon and also go down the toilet.
I hope the best for the ones who were wiped out today.

POLKADOT helloo dear trader
polkadot breakout downtrend channel and ready for pump
Dot is always pumped first, then chainlink , but in this bullish market 2023 , the link is pumped first, then dot will be pumped,
polkadot will soon be above 10 dollars.
polkadot one of the best crypto currency project
goodluck

DOT Polkadot Technical Analysis And Trade IdeaWelcome to our DOT/USDT Technical Analysis and Trade Idea. In this video, we will delve into the charts, focusing on the prevailing bearish sentiment found in the weekly (1W) and daily (1D) timeframes. Notably, our charts signal that Polkadot is currently on the verge of a resistance level, a pivotal turning point for this crypto asset. Throughout this discussion, we will explore the fundamental tenets of technical analysis, encompassing vital aspects such as analyzing the ongoing market trend, price dynamics, market structure, and other critical elements of technical analysis. As we progress through this analysis, we will meticulously examine a potential trading opportunity within the NAS100 index.
It is important to note that the insights we share in this presentation are intended solely for educational purposes and should not be construed as financial advice. Participating in the stock market and cryptocurrency trading carries a significant level of risk. Therefore, it is imperative to prudently incorporate robust risk management strategies into your trading plan to effectively navigate these challenges.

Is It Finally Time To Buy DOT As Polkadot 2.0 is Coming? hello dear trader and investors
do you know( polkadot v2) faster than sol and kadena?
Is It Finally Time To Buy DOT As Polkadot 2.0 is Coming?
it is time for polkadot ’s rally
Polkadot 1.0 vs 2.0 —
A comparison between Polkadot 1.0 and Polkadot 2.0 highlights significant differences. The transition from slot leasing to a cumulative asset model will enable smaller projects to access Polkadot’s infrastructure without committing millions of dollars or locking up tokens for extended periods.
The number of available parachain slots is expected to increase from a limited 50 to a range of 500 to 1,000 cores, further expanding Polkadot’s capacity to onboard projects.
Polkadot 2.0 Launch Date —
Gavin Wood, Polkadot’s founder, has been actively involved in developing Polkadot 2.0.
While the technology is expected to be ready by late 2023, the official upgrade and release will occur in early 2024.
This timing aligns with the end of the major DOT unlock events, potentially setting the stage for a new wave of positive sentiment.
Polkadot 2.0’s new system for allocating block space could increase liquidity for the DOT token. Revenue generated from core time sales will be channeled into the Polkadot Treasury, and token holders will have a say in how these funds are distributed through governance. Periodic token burns are also being considered, which could make DOT deflationary and positively impact its price.
good luck

PolkaDOT protocol is building PolkaDOT has a lot building around it!
Lots of news & hype is coming.
EverythingAltcoin on youtube has a great video posted up today. You best check it out and give him a follow!!
I believe we will see a new ATH with DOT and Cardano ADA will also be at a new ATH this cycle.
None of my work is financial advice it can go to ZERO

Polkadot DOT upside is thereWeekly chart & I will publish a Daily to show my Idea zoomed in.
PolkaDOT and Cardano ADA now are working on a partnership with Midnight is in the news.
This is the hype I believe, when the link is made I believe that will be the sell the news event.
Swapped some things around and picked up some more DOT & staked it in the last few hours.
Please bounce your ideas off of me!
None of my ideas are financial advice. Much love

Will DOT break out?
DOT's price action retests the upper limit of it's 18 month downward channel...
Is momentum slowing down & swinging to the up side?

Polkadot - Potential breakoutThe cryptocurrency polkadot is about to do a break out of the downtrend and my first target is at 7$. Keep a eye on this asset, I think it could explode much higher in the coming euphoria bull market.

DOT/USDT Upward Momentum ?? Polkadot Analysis Today💎 DOT has certainly piqued our interest, achieving a breakout from the Descending Channel with a notable ascent. It would be beneficial for DOT to undergo a retesting phase initially, ensuring a stable corrective movement.
💎 Without this, DOT might reach the supply zone only to face rejection, subsequently descending to retest at the demand level or the resistance trendline of the former descending channel. However, should it manage to breach the supply zone promptly, DOT probability could advance towards its next milestone, the Bearish OB region.
💎 In the scenario of a strategic retest, it's imperative for DOT to exhibit a bounce or a sign of rejection, striving to re-engage with the supply zone and solidify its position above, thereby validating the breakout.
💎 Conversely, if DOT fails to rally, a troubling development might unfold, where DOT is unable to hold its ground at the demand zone, compromising the subsequent level. This occurrence would signify a false breakout, potentially steering DOT into a downward trajectory towards a robust support zone.

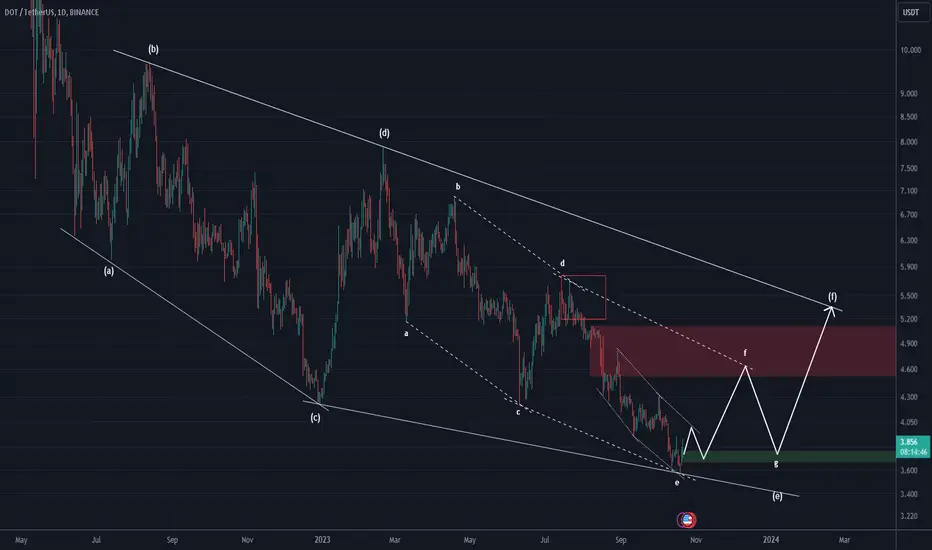
What will be the fate of DOT?We have a large diametric that has been a Polkadat symbol within this diametric for several years.
We are now in branch E of this diametric. The branch E has become a diametric itself. Now we seem to be in the F branch of E. We expect movements similar to what I drew on the chart.
For risk management, please don't forget stop loss and capital management
Comment if you have any questions
Thank You
Investments zones for PolkadotBINANCE:DOTUSDT
Here is my targets for investors who have a stable coins and waiting the best golden price for long term.
Everything in -0.18 and -0.27 zones what I've mentioned on a chart is good time to accumulate more DOT
On global daily Histogram since May 2021 drop we can see how price is break new ATH and going almost to the same bottom, but on histogram shows we are really soon can see the bottom and start new alt season to my conservative prices around 70 and 100 usd per DOT
Follow me on Trading View and other social media. Link under this idea
Thanks

OriginTrail Metcalfe UpNot financial Advice.
TRAC aka OriginTrail aka OTP on Polkadot looks ready to move
500mil tokens in total
MarketCap is under 250m
Valahala

KINT/USDT 1D. Coin as an example. Clear price action.KINTSUGI/USDT 1D. Secondary and main trend. Polkadot ecosystem coin.
Spectating this coin for quite a while.
Since the beginning of the year we saw quite an accumulation which lasted about a year.
It's marked as green rectangle on the chart.
In this accumulation there were 2 clear price movements(accumulation then pump).
Then, with the marked(as it's no longer logical to hold the price in the accumulation) - price fell out of this accumulation channel. Since then the falling wedge started to form.
Right now the price is moving inside this falling wedge and finding it's local bottom.
It's more logical to buy FROM the bottom, not TO the bottom. I believe it's clear.
Only when we see the bottom forming - it's more decent to buy rather then now, when the price only searching for it's bottom.
But we're also near the reversal zone, which is shown as blue rectangle on the chart.
Very likely price will reverse from this 0.26-0.3$ zone. Potential zones above and percentage amount from each potential reversal zone are shown on the chart.
It's better to see increasing in volatility before entering the deal. This factor allows to indicate the bottom is forming.
For the future we might see the same horizontal channel will be formed here. Hence it's possible to see couple pump cycles.
If we're speaking about time periods - it's about autumn the price should move, believe this is quite obvious.
Though it's possible to see couple moves in the potential channel - the most probable is the first move, so it's probably reasonable to work with it.
How do it it i believe i have described above.

#POLKADOT #DOT Long-Term targets analysis#POLKADOT #DOT Long-Term targets analysis
During the years 2020 to 2021, a five-wave ascending structure can be seen on the chart, which has taken 2.618 times ascension time to correct these five waves from 2021 to today. Referring to the rules and instructions of Elliott Style Percher, the conditions that have been created for the dot currency so far are the rise in wave 1 and a deep correction in wave 2. For this reason, we expect wave 3 to have a higher height than wave 1 (except for exceptions). Based on these rules and laws and ratios and the relation of wave length three to wave one, it is possible to get an estimate of the price targets until the end of 2025.
The goals are:
Minimum desired target : 28
Target1: 48$
Target2: 97$
Target3: 240$
Target4: 750$
STOP LOSS: 3$

DOT.USD (Full Analysis Long Term)Hello my dear Followers.
How are you?
I hope you feel great.
It's a new day and I want to talk about Polkadot (DOT)
Please pay attention that it's NOT financial advice because it's just a new vision that belongs to me. and I'm sharing this analysis with you.
So, please be aware and watch the market.
So, let's go into details.
I used the Fibonacci channel to analyze this chart.
0 is the bottom of the chart. 0.5 is the midline and 1 is the top of the Fibonacci channel. and so on
I want to check this asset in the daily time frame. Based on the information we had, we are still in a bearish trend. And expect to drop more.
Today market raised and I think it's just a pull-back to a lost support.
Please don't FOMO.
This market needs to drop more. According to my latest analysis about USDT.D, I expect this item to still go higher and higher. although the DXY is bullish too.
BTC.D is Bullish Too.
if BTC.D is bullish and Bitcoin drops, the altcoins drop more than you think.
It means that the market needs more correction.
There are four support zones for this asset, but just two zones are essential.
Let me define these zones for you. I believe that the main zones for Polkadot are 2.06 and 1.07 USD.
I don’t want to tell you the Polkadot will drop to 1.07 USD, I just tell you this zone (1.07 USD) is the last support and it might never touch the price.
the main support for Polkadot is 2.06 USD.
You should buy your asset at the cheapest price, so, you should be patient.
I want to put in my order of 2.06 USD to buy a Polkadot.
By the way, you should watch the market. Because bad news is coming. And they are really effective in this market.
The main correction wave has not started yet.
I want to refer you to my last analysis of BTC.USD in a weekly time Frame. we are still in the B wave and the C wave has not started yet.
It was my duty to warn you and tell you all the truth.
Sooner or later, but the correction is sure.
Please be patient. Control your emotions.
Opportunities in the market flow smoothly like a river.
It was my duty to tell you all things you need to know.
Please don’t forget to write your comments ✍️✍️ Like 👍👍 and Share 👌👌 this vision with your friends.
And tell me do you agree with me or not?
Good Luck
Ho3ein.mnD

MAJOR RESISTANCE TREND LINE NEEDS TO BREAK!!Keep it simple.
Once trend line is broken and retested, time to long.
Calculate Your Risk/Reward so you don't lose more than 1% of your account per trade.
Every day the charts provide new information. You have to adjust or get REKT.
Love it or hate it, hit that thumbs up and share your thoughts below!
This is not financial advice. This is for educational purposes only.

DOT is entering into bull market!Hello, dear friends!
We have some thoughts that DOT can start it's bull run right now. Talking about Bitcoin it has not clear setup, but DOT is finishing it's Elliott waves cycle.
The falling wedge pattern looks like the ending diagonal in wave 5. This wave also consists of 5 waves. Divergence with Awesome Oscillator confirms the potential reversal.
🚀Follow us and never miss the update

Polkadot - $3 Looms as Sellers DominateHi Traders, Investors and Speculators of Charts📈📉
Polkadot is currently trading 93% under it's ATH. Although this is bad news for most bag holders, the good news is that the bottom is either in - or very close.
There's no doubt that a bullish cycle is overdue, but not just yet. Technical indicators on lower timeframes show bears are still dominating, and there's a chance the price could fall lower once more before the accumulation phase finishes.
Incase you missed yesterday's update on Bitcoin, find it here 📈
_______________________
📢Follow us here on TradingView for daily updates and trade ideas on crypto , stocks and commodities 💎Hit like & Follow 👍
We thank you for your support !
CryptoCheck
BINANCE:DOTUSDT BINANCE:DOTUSD

Bottom section below 9.262Hello?
Hello traders!
If you "Follow" us, you can always get new information quickly.
Please also click “Boost”.
Have a good day.
-------------------------------------
(DOTUSDT chart)
In fact, it can be said that it has entered the bottom section by falling below 9.262.
Accordingly, it can be said to be a coin (token) that does not correspond to the time of transaction.
(1M charts)
One silver lining is that the StochRSI indicator has been sloping.
Therefore, it is necessary to check whether it will not decline further and lead to sideways movement.
(1W chart)
It is falling below 4.876 and renewing a new low.
Accordingly, the key is whether the price can be maintained by rising above 4.234.
If not, we recommend stopping the transaction itself and observing the situation for a while.
I think it is difficult to say that maintaining the price by rising above 4.234 will result in an upward trend.
Therefore, you need to check what kind of support it receives in the 4.234-6.523 range.
(1D chart)
We are falling to an immeasurable point.
Therefore, it is better to wait and see if the price rebounds.
Therefore, when the StochRSI indicator breaks out of the oversold range, you need to check at which point or range it receives support or resistance.
If that happens, the HA-Low indicator is expected to decline.
At this time, the key is whether it can receive support from the HA-Low indicator and rise.
-------------------------------------------------- -------------------------------------------
** All explanations are for reference only and do not guarantee profit or loss in investment.
** Trading volume is displayed as a candle body based on 10EMA.
How to display (in order from darkest to darkest)
More than 3 times the trading volume of 10EMA > 2.5 times > 2.0 times > 1.25 times > Trading volume below 10EMA
** Even if you know other people’s know-how, it takes a considerable amount of time to make it your own.
** This chart was created using my know-how.
---------------------------------

DOT - Rainy 24 Hours Ahead 🌧️ Bearish ScenarioCloudy and rainy trading conditions 🌧️ loom for the global crypto market in the next 24 hours, forecasting a bearish market with downside risk. Avalanche and Polkadot encounter extremely bearish conditions, hinting at an impending rebound.
Over a one-week horizon, the ☁️ cloudy trading conditions persist. However, Bitcoin, Cardano, and Chainlink glimpse a bit of bullish ☀️, suggesting a potential slight rebound.
Follow us for more crypto weather reports!
